Quantum Elasticity Overview: Quantum Elasticity is a sophisticated Mean Reversion Engine based on the law of statistical probability. It models market price action as an elastic system that revolves around a dynamic equilibrium point (Linear Regression).
The Core Logic: Markets are rarely efficient. When price deviates significantly from its historical mean, it creates "Statistical Tension." This script measures that tension using dynamic standard deviation envelopes (Sigma Bands).
Equilibrium: The center line represents the fair value of the asset.
Elasticity Zones: When price enters the "Extreme" bands, the probability of a snap-back towards the mean increases exponentially.
Unique Features:
Non-Lagging Linear Regression: Unlike SMA/EMA, our equilibrium line adapts to the slope of the trend without the heavy lag of traditional indicators.
Dynamic Tension Index: The built-in HUD displays the real-time elasticity of the market, helping traders identify exhaustion points.
Reversion Alerts: "REVERT" signals appear when the market reaches a 1.5x Sigma deviation, indicating a critical oversold/overbought state.
How to obtain access: This is an "Invite-only" script. To gain access, please visit my profile or send a private message for subscription details.
Zmienność

TwinSmooth ATR Bands | QuantEdgeBTwinSmooth ATR Bands | QuantEdgeB
🔍 Overview
TwinSmooth ATR Bands | QuantEdgeB is a dual-smoothing, ATR-adaptive trend filter that blends two complementary smoothing engines into a single baseline, then builds dynamic ATR bands around it to detect decisive breakouts. When price closes above the upper band it triggers a Long regime; when it closes below the lower band it flips to Short—otherwise it stays neutral. The script enhances clarity with regime-colored candles, an active-band fill, and an optional on-chart backtest table.
✨ Key Features
1. 🧠 Twin-Smooth Baseline (Dual Engine Blend)
- Computes two separate smoothed baselines (a slower “smooth” leg + a faster “responsive” leg).
- Blends them into a single midpoint baseline for balanced stability + speed.
- Applies an extra EMA smoothing pass to produce a clean trend_base.
2. 📏 ATR Volatility Bands
- Builds upper/lower bands using ATR × multiplier around the trend_base.
- Bands expand in volatile conditions and contract when markets quiet down—auto-adapting without manual tweaks.
3. ⚡ Clear Breakout Regime Logic
- Long when close > upperBand.
- Short when close < lowerBand.
- Neutral otherwise (no forced signals inside the band zone).
4. 🎨 Visual Clarity
- Plots only the active band (lower band in long regime, upper band in short regime).
- Fills between active band and price for instant regime context.
- Colors candles to match the current state (bullish / bearish / neutral).
- Multiple color palettes + transparency control.
💼 Use Cases
• Trend Confirmation Filter: Use the regime as a higher-confidence trend gate for entries from other indicators.
• Breakout/Breakdown Trigger: Trade closes outside ATR bands to catch momentum expansions.
• Volatility-Aware Stops/Targets: Bands naturally reflect volatility, making them useful as adaptive reference levels.
• Multi-Timeframe Alignment: Confirm higher-timeframe regime before executing on lower timeframes.
🎯 For Who
• Trend Traders who want clean regime shifts without constant whipsaw.
• Breakout Traders who prefer confirmation via ATR expansion rather than raw MA crossovers.
• System Builders needing a simple, robust “state engine” (Long / Short / Neutral) to plug into larger strategies.
• Analysts who want quick on-chart validation with a backtest table.
⚙️ Default Settings
• SMMA Length (Base Smooth Leg): 24
• TEMA Length (Base Responsive Leg): 8
• EMA Extra Smoothing: 14
• ATR Length: 14
• ATR Multiplier: 1.1
• Color Mode: Alpha
• Color Transparency: 30
• Backtest Table: On (toggleable)
• Backtest Start Date: 09 Oct 2017
• Labels: Off by default
📌 Conclusion
TwinSmooth ATR Bands | QuantEdgeB merges a dual-speed smoothing core into a single trend baseline, then wraps it with ATR-based bands to deliver clean, volatility-adjusted breakout signals. With regime coloring, active-band plotting, and optional backtest stats, it’s a compact, readable tool for spotting momentum shifts and trend continuation across any market and timeframe.
🔹 Disclaimer: Past performance is not indicative of future results. Always backtest and align settings with your risk tolerance and objectives before live trading.
🔹 Strategic Advice: Always backtest, optimize, and align parameters with your trading objectives and risk tolerance before live trading.

Next-Gen Market Signal Dashboard Key Features:
Trend Detection: EMA50 and EMA200 highlight bullish and bearish trends with subtle background coloring.
Momentum Indicators: RSI, MACD, and Stochastic Oscillator confirm signal strength and market momentum.
Volatility Filter: ATR ensures signals are only triggered during active market conditions.
Visual Signals: Animated triangles and colored backgrounds for LONG (green) and SHORT (red) signals.
Take Profit / Stop Loss: Automatic, elegant TP and SL lines to guide trades.
Compact Multi-Indicator Panel: Displays RSI, MACD, Stochastic, and ATR with color-coded strength indicators.
Mini-Guide: Integrated panel explanations help quickly interpret signals without confusion.
Alerts: Built-in alerts for all LONG and SHORT signals.

ParetoCapital Volatility AlgorithmParetoCapital Volatility Algorithm — Strategy Description
This strategy is a volatility-driven breakout system designed to participate only in markets that exhibit sufficient price activity and structural clarity. All signals are evaluated on candle close to ensure stable, non-repainting behavior.
The strategy adapts its execution logic based on long-term market context while maintaining consistent risk exposure across changing volatility regimes.
Volatility Filter
Trades are taken only when current market volatility exceeds a defined baseline. This filter is intended to suppress signals during low-activity or range-bound conditions and to focus execution on periods where directional movement is more likely to persist.
Market Regime Assessment
A long-term reference is used to classify the prevailing market environment:
When price is positioned above the long-term reference, the market is treated as trend-favorable.
When price is below the reference, the market is treated as non-trend or transitional.
This classification determines how entries are structured but does not attempt to forecast direction.
Entry Logic
In trend-favorable conditions, the strategy seeks continuation trades in the direction of the prevailing trend. Entries are triggered only after price confirms strength through a breakout beyond recent levels.
In non-trend conditions, the strategy prepares for volatility expansion in either direction. Trades are initiated only when price breaks decisively beyond recent boundaries, allowing the market to determine direction.
All entries are confirmation-based and are not executed at market without prior price expansion.
Position Sizing and Risk Control
Position size is dynamically adjusted according to current market volatility. Risk per trade is kept proportional and consistent, while overall capital usage is constrained to prevent overexposure.
This approach allows the strategy to remain risk-controlled during both high- and low-volatility environments.
Exit Logic
Positions are exited when price action indicates a material loss of momentum relative to recent market structure. The exit logic is designed to tolerate minor counter-moves while responding decisively to structural weakness.
Key Characteristics
Candle-close confirmation
Non-repainting behavior
Volatility-adaptive execution
Regime-aware trade logic
Systematic risk management
Strategy Objective
The objective of this strategy is to capture a limited number of structurally strong price movements while minimizing exposure during non-productive market conditions. It prioritizes selectivity, confirmation, and risk discipline over trade frequency.
Usage Notes
The strategy is optimized for major cryptocurrencys, where volatility expansion and momentum continuation are more prevalent.
Best results have been observed on BTCUSD using the 15-minute and 30-minute timeframes.
Performance on other assets or timeframes may vary and should be evaluated through independent testing.

kamonosukeThe stop loss is always set at the short-term resistance zone.
If there is no clear resistance level nearby, we zoom out to a higher timeframe and set the target at a key mid-to-long-term level.
Once the setup is complete, we simply wait to see if price moves as expected.
When the target is reached and broken, we take profit and close the trade.

DDDDD : EMA Pack (Matched Colors + MTF)📌 DDDDD : EMA Pack (Matched Colors + MTF)
🔹 Concept
DDDDD : EMA Pack is a clean and minimal Exponential Moving Average (EMA) overlay designed for trend structure analysis and multi-timeframe context.
This indicator focuses on visual clarity, consistent color mapping, and optional MTF EMA projection, allowing traders to read market structure without clutter or signal noise.
It is not an entry or signal generator, but a trend and regime visualization tool.
🔹 Logic
The script plots a fixed set of EMAs commonly used to define short-term momentum, intermediate trend, and long-term bias:
EMA 5
EMA 10
EMA 25
EMA 50
EMA 75
EMA 200
Each EMA is calculated using the standard exponential moving average formula.
If a higher timeframe is selected, the EMA is calculated on that timeframe and projected onto the current chart using request.security().
🔹 Methodology
Users may select:
Source price (default: close)
EMA timeframe
Empty = current chart timeframe
Any higher timeframe = true MTF EMA projection
All EMA colors are manually matched and fixed to maintain visual consistency across markets and timeframes.
Line thickness is kept uniform to avoid visual hierarchy bias.
This design ensures the indicator remains purely structural, without repainting logic, smoothing tricks, or adaptive parameters.
🔹 How to Use
Use EMA alignment and spacing to assess:
Trend direction
Trend strength
Compression vs expansion
Higher-timeframe EMA projection can be used as:
Dynamic support/resistance
Trend filter
Regime context for lower-timeframe execution
This indicator works best when combined with:
Price action
Market structure
Separate entry/exit logic of your own system
⚠️ This indicator does not provide buy/sell signals and should not be used alone for trade execution.
🔹 Notes
No repainting beyond standard MTF behavior
No performance or profitability claims
Designed for discretionary and systematic traders
Suitable for stocks, crypto, forex, and indices

ATR 0.5x & 1x Distance (Horizontal)What this version does (no ambiguity)
Plots true horizontal dashed lines
One at ±0.5 × ATR
One at ±1.0 × ATR
Lines extend to the right (proper levels, not floating spaghetti)
ATR is calculated from the active chart timeframe
30m chart → 30m ATR
1H chart → 1H ATR
Clean, stable, no repainting tricks
Important detail (this matters for your strategy)
The lines are anchored to a reference price, which is currently configurable:
Default: close
You can change it to:
VAH
VAL
POC
Any plotted level
This is exactly what you want for:
“How far beyond value has price gone in ATR terms?”
How you’ll likely use this in practice
For your mean-reversion framework:
Anchor Reference Price = VAH or VAL
Treat:
0.5× ATR → probabilistic rejection zone
1.0× ATR → acceptance / thesis failure
No more eyeballing. No more dragging stops because “the candle looked angry.”

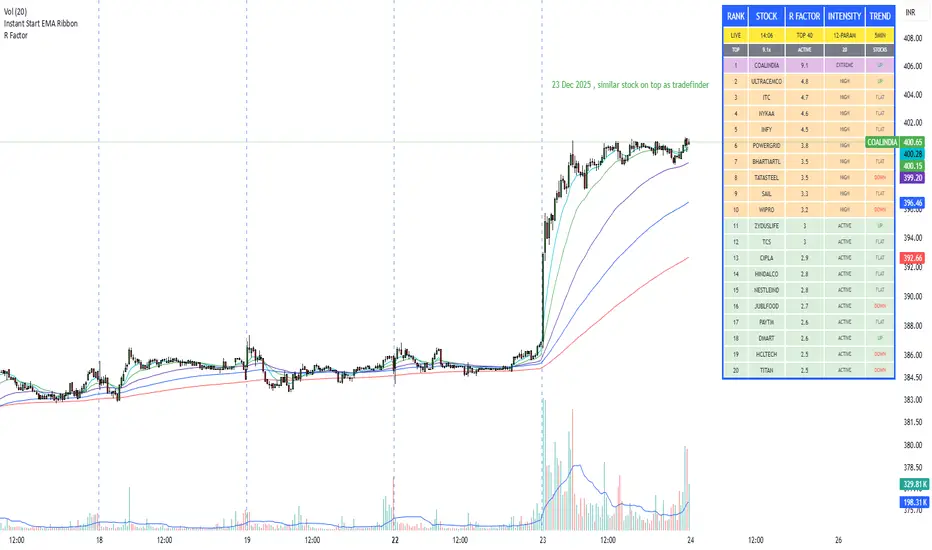
R Factor Advanced Stock Activity Ranking (Experimental) R Factor (relative factor) is a custom logic based 'momentum ranking' parameter, which measures intensity of intraday momentum and volatility. This parameter compared today's activity from last 20 days activity and ranks the stocks according to the intensity of the momentum.
Why momentum ranker?
Because traditional %change sorts intraday stock which show momentum in ascending order of value of % change, for example 3%, 2.5 %, 1% etc. But momentum ranker does not use % change as a sorting parameter for top gainers, or losers. It ranks the stocks, regardless of the direction, according to the intensity it is showing. The value of the momentum ranking has no meaning of itself, just understand that higher the value of momentum ranker, the more intensity the stock is showing.
In this indicator we can only scan 40 F&O stock of Indian Stock Market. This indicator is to be used only on 5 min timeframe.
Tip: Do not change any values in the settings otherwise, the indicator won't work as expected.
Also after applying the indicator, your canvas will shrink, manually fix it by stretching from Y axis, a table will appear showing top 20 stocks. Some times the indicator will glitch & show incorrect names of stocks, refresh the Tradingview website to fix this. Best used on a PC.
Disclaimer/Warning:
This parameter is inspired by TradeFinder and is an attempt to study the momentum of the stocks. This indicator in no way attempts to copy features of the TradeFinder software, this is purely an experimental Indicator, for the people who cannot afford to buy a trading software. This indicator does not provide Buy/Sell signals or nor is an investment advice. This indicator solely for the purpose of study of price and its momentum. Users are responsible for their own actions, profit/loss of the users is not the liability of author.
SMC Post-Analysis Lab [PhenLabs]📊 SMC Post-Analysis Lab
Version: PineScript™ v6
📌 Description
The SMC Post-Analysis Lab is a dedicated hindsight analysis tool built for traders who want to understand what really happened during any historical trading period. Unlike forward-looking indicators, this tool lets you scroll back through time and instantly receive algorithmic classification of market states using Smart Money Concepts methodology.
Whether you’re reviewing a losing trade, studying a successful session, or building your pattern recognition skills, this indicator provides immediate context. The expansion-aware algorithm processes price action within your selected window and outputs clear, actionable classifications ranging from Parabolic Expansion to Consolidation Inducements.
Stop relying on subjective post-trade analysis. Let the algorithm objectively tell you whether institutional players were accumulating, distributing, or running inducements during your trades.
🚀 Points of Innovation
First indicator specifically designed for SMC-based post-trade review rather than live signal generation
Dual-mode analysis system allowing both dynamic scrollback and precise date selection
Expansion-aware classification algorithm that weighs range position against net displacement
Real-time efficiency metrics calculating directional quality of price movement
Integrated visual FVG detection within the analysis window only
Interactive table with clickable date range adjustment via chart interface
🔧 Core Components
Pivot Detection Engine: Uses configurable pivot length to identify significant swing highs and lows for structure break detection
Window Calculator: Determines active analysis zone based on either bar offset or timestamp boundaries
Data Aggregator: Tracks window open, high, low, close and counts bullish/bearish structure break events
State Classification Algorithm: Applies hierarchical logic to determine market state from six possible classifications
Visual Renderer: Draws structure breaks, FVG boxes, and window highlighting within the active zone
🔥 Key Features
Sliding Window Mode: Use the Scroll Back slider to dynamically move your analysis zone backwards through history bar-by-bar
Date Range Mode: Select specific start and end timestamps for precise session or trade review
Six Market State Classifications: Parabolic Expansion (Bull/Bear), Bullish/Bearish Order Flow, Accumulation/Distribution Reversal, and Consolidation/Inducement
Range Position Percentile: See exactly where price closed relative to the window’s high-low range as a percentage
Bull/Bear Event Counter: Quantified count of structure breaks in each direction during the analysis period
Efficiency Calculation: Net move divided by total range reveals trending quality versus chop
🎨 Visualization
Blue Window Highlight: Active analysis zone is clearly marked with blue background shading on the chart
Structure Break Lines: Dashed lines appear at each bullish or bearish structure break within the window
FVG Boxes: Fair Value Gaps automatically render as semi-transparent boxes in bullish or bearish colors
Dashboard Table: Top-right positioned table displays State, Analysis description, and Metrics in real-time
Color-Coded States: Each classification uses distinct coloring for immediate visual recognition
Interactive Tip Row: Optional help text guides users on clicking the table to adjust date range
📖 Usage Guidelines
General Configuration
Analysis Mode: Default is Sliding Window. Choose Date Range for specific timestamp analysis.
Sliding Window Settings
Scroll Back (Bars): Default 0. Increase to move window backwards into history.
Window Width (Bars): Default 100. Range 20-50 for scalping, 100+ for swing analysis.
Date Range Settings
Start Date: Select the beginning timestamp for your analysis period.
End Date: Select the ending timestamp for your analysis period.
Visual Settings
Show Help Tip: Default true. Toggle to hide instructional row in dashboard.
Bullish Color: Default teal. Customize for bullish elements.
Bearish Color: Default red. Customize for bearish elements.
SMC Parameters
Pivot Length: Default 5. Lower values (3-5) catch minor breaks. Higher values (10+) focus on major swings.
✅ Best Use Cases
Post-trade review to understand why entries succeeded or failed
Session analysis to identify institutional activity patterns
Trade journaling with objective algorithmic classifications
Pattern recognition training through historical scrollback
Identifying whether stop hunts were inducements or legitimate breaks
Comparing your real-time read versus what the algorithm detected
⚠️ Limitations
Designed for historical analysis only, not live trade signals
Classification accuracy depends on appropriate pivot length for the timeframe
FVG detection uses simple gap logic without mitigation tracking
State classification is based on window data only, not broader context
Requires manual scrolling or date input to review different periods
💡 What Makes This Unique
Purpose-Built for Review: Unlike most indicators focused on live signals, this is designed specifically for post-trade analysis
Expansion-Aware Logic: Algorithm weighs both position in range AND directional efficiency for accurate state detection
Interactive Date Control: Click the dashboard table to reveal draggable anchors for window adjustment directly on chart
🔬 How It Works
1. Window Definition:
User selects either Sliding Window or Date Range mode
System calculates which bars fall within the active analysis zone
Active zone receives blue background highlighting
2. Data Collection:
Algorithm captures window open, running high, running low, and current close
Structure breaks are detected when price crosses above last pivot high or below last pivot low
Bullish and bearish events are counted separately
3. State Classification:
Range Position calculates where close sits as percentage of high-low range
Efficiency calculates net move divided by total range
Hierarchical logic applies priority rules from Parabolic states down to Consolidation
4. Output Rendering:
Dashboard table updates with State title, Analysis description, and Metrics
Visual elements render within window only to keep chart clean
Colors reflect bullish, bearish, or neutral classification
💡 Note:
This indicator is intended for educational and review purposes. Use it to develop your understanding of Smart Money Concepts by analyzing what institutional order flow looked like during historical periods. Combine insights with your own analysis methodology for best results.

TCI Time Oracle - Intraday
🟢 Green Zone — Opening & Closing Liquidity Window
Time:
Opening Green: ~9:15 – 9:30 AM
Closing Green: ~3:15 – 3:30 PM
Market Character:
Highest liquidity of the day
Overnight positions unwind / fresh positions initiate
Strong directional intent often revealed
Smart money sets the day’s bias
Trading Insight:
Best zone for trend bias identification
Option premiums react fastest here
Not ideal for late entries, but excellent for confirmation
🔵 Blue Zone — Midday Compression / Algo Control
Time: ~11:15 AM – 12:00 PM
Market Character:
Volatility contraction
Algo-driven price control
Time decay dominates options
Fake breakouts and mean reversion
Trading Insight
Worst zone for aggressive option buying
Best for range scalping or staying flat
Institutions wait, retailers get chopped
🔴 Red Zone — Institutional Expansion / Trap Zone
Time: ~1:15 PM – 2:00 PM
Market Character:
Sudden volatility expansion
Institutional orders hit the market
Trend acceleration or sharp reversal
Options see rapid delta & gamma shift
Trading Insight:
High probability trend continuation or trap creation
Strong zone for directional option trades
Requires strict risk management
Big Picture Takeaway
Green sets the intent
Blue compresses and traps
Red expands and delivers the real move
This time-zone behavior is exactly why one strategy cannot work all day. Edge comes from trading the right setup in the right time window.

ZeroDegen Mega Pro Pack v2═══════════════════════════════════════════════════════════════════════════════
ZERODEGEN MEGA PRO PACK v2 — Multi-Mode Trading System
═══════════════════════════════════════════════════════════════════════════════
Professional trading indicator with 11 modes for crypto markets. Clear BUY/SELL signals, real-time market analysis, and institutional-grade filters.
🎯 WHAT IT DOES
Analyzes price action using multi-factor confirmation:
- EMA crossovers (9/21) for trend direction
- RSI momentum filtering
- ADX trend strength validation
- Volume confirmation
- Higher timeframe bias (1H trend filter)
- Institutional concepts: Liquidity sweeps, Fair Value Gaps
Generates clear BUY and SELL signals directly on your chart with a real-time status panel showing all market conditions at a glance.
📊 11 TRADING MODES
SCALP (15m): Standard, Aggressive, Conservative
TREND (1H-4H): Standard, Cloud, Institutional
INSTITUTIONAL: Liquidity Engine
MIXED: Pro, Reversal, Auto Engine, Automation + Confidence
Switch modes with one click to match market conditions.
⚡ KEY FEATURES
✓ Clear visual BUY/SELL/EXIT signals
✓ Real-time status panel with all indicators
✓ Smart filters (Volume, ADX, ATR, Range)
✓ HTF Bias display (1H trend direction)
✓ Institutional Confidence score
✓ Works on any crypto pair
✓ TradingView alert-ready
📈 RECOMMENDED USAGE
Timeframes: 15m (scalp), 1H (swing), 4H (trend)
Markets: BTC, ETH, SOL, and other liquid crypto pairs
🔐 HOW TO GET ACCESS
Visit: xeroc00l.org
- Monthly: $59/mo
- Quarterly: $149 (save 15%)
- Lifetime: $497 (one-time)
After payment, send your TradingView username to zerocool@xeroc00l.org — access granted within 24 hours.
🚀 COMING SOON
We're actively developing additional features including bot integration, automated execution, and a private trading community. Subscribe now and get access to all future updates.
Learn more: xeroc00l.org
⚠️ LEGAL DISCLAIMER
This indicator is provided for educational and entertainment purposes only. It is not financial advice and should not be construed as a recommendation to buy, sell, or hold any cryptocurrency or financial instrument.
Trading cryptocurrencies and leveraged products involves substantial risk of loss and is not suitable for all investors. Past performance is not indicative of future results. You should not trade with money you cannot afford to lose.
The creators of ZeroDegen are not licensed financial advisors, brokers, or dealers. By using this indicator, you acknowledge that all trading decisions are your own responsibility and you agree that ZeroDegen and its creators are not liable for any losses incurred.
Always do your own research and consider consulting a licensed financial professional before making investment decisions.
© 2025 ZeroDegen | For entertainment purposes only

Impulsive Trend Detector [dtAlgo]This advanced Pine Script indicator identifies and tracks impulsive price movements based on Break of Structure (BOS) and Change of Character (CHoCH) concepts from Smart Money trading methodology.
The indicator automatically detects pivot highs and lows, then monitors when price breaks these key levels to signal potential impulsive moves. BOS indicates continuation in the current trend direction, while CHoCH signals potential trend reversals. Each detected move is measured from the break point to the next opposing pivot, providing accurate percentage calculations that match TradingView's measuring tool.
Impulsive moves are categorized into four levels based on magnitude (Level 1: 5-10%, Level 2: 10-15%, Level 3: 15-20%, Level 4: 20%+), with color-coded visual labels and connecting lines displayed directly on the chart.
Comprehensive Session Analysis:
Track moves across 11 distinct trading sessions in Eastern Time: Pre-London/NY, London/NY overlap, NY (with Power Hour and End subdivisions), Sydney, Asia, Sake Time, Asia/London overlap, London, Weekend, and No Session periods.
Three Dynamic Tables provide:
Real-time statistics (bullish/bearish, BOS/CHoCH, levels)
Session breakdown with move counts and average percentages
Event log showing last 10 moves with date, day, session, direction, type, level, percentage, duration, and bar count
Perfect for Smart Money traders seeking data-driven insights into market structure behavior across global trading sessions.

Swing HelperThis script, titled "Swing helper", is a multi-metric dashboard designed to provide a comprehensive snapshot of a security's volatility, relative volume, and price action health directly on the chart. It focuses on Average Daily Range (ADR) relationship and key performance indicators to help traders identify setups like volatility contractions or trend strength.
Key Features
Dual-ADR Analysis: Calculates and compares Long-Term (LT) and Short-Term (ST) ADR percentages. The ADR Ratio helps identify when volatility is expanding or contracting relative to historical norms.
Relative Volume (RVol): Compares current volume to a 20-day moving average, highlighting institutional participation.
Dynamic Closing Range: Visualizes where the price is closing relative to the day's true range (the "Closing Range %"), indicating buying or selling pressure.
SMA 50 Distance: A unique metric that measures the price's distance from the 50-day Simple Moving Average in "ADR units," helping to gauge how overextended a stock is.
Automated Price Projections: Dynamically plots -1x and -2x ADR levels from the current price to provide immediate downside targets or support levels.
Custom Bar Coloring: Highlights specific price action patterns:
Inside Days (Blue)
Upside Reversals (Green)
Downside Reversals (Red)
Visual Customization
The script includes a highly flexible Summary Table with customizable positions, sizes, and colors (including borders and headers), allowing it to fit into any dark or light mode chart layout without obstructing price action.
How to Use
Volatility Contraction: Watch for the ADR Ratio to drop, indicating a tightening range before a potential breakout.
Relative Strength: Look for high RVol combined with a high Closing Range % (e.g., >75%) to confirm strong demand.
Mean Reversion: Use the SMA50 Dist metric to identify when a stock is "stretched" too far from its moving average relative to its daily volatility.

MACD Classic MT5 Style (2 Lines + Histogram)MACD Classic MT5 Style (แบบ MetaTrader 5) มีความแตกต่างจาก MACD ทั่วไปที่ใช้กันใน TradingView พอสมควรครับ นี่คือคำอธิบายว่ามันทำงานอย่างไรและอ่านค่าอย่างไรครับ:
1. ความแตกต่างสำคัญ (Key Difference)
MACD ทั่วไป (Standard):
มี 2 เส้น (เส้น MACD และ เส้น Signal)
ฮิสโตแกรม (แท่งกราฟ) คือ ส่วนต่าง (Gap) ระหว่าง 2 เส้นนั้น
MACD แบบ MT5 (Classic MT5):
เส้น MACD จะถูกวาดออกมาเป็น แท่งกราฟ (Histogram) แทนที่จะเป็นเส้น
เส้น Signal จะเป็น เส้น (Line) สีแดงพาดผ่านแท่งกราฟ
สรุปคือ: ในแบบ MT5 แท่งกราฟคือตัวพระเอก (MACD) ส่วนเส้นคือตัวช่วยกรอง (Signal)
Here is the English translation of the explanation:
MACD Classic MT5 Style vs. Standard MACD
The "Classic MT5 Style" MACD differs significantly from the standard MACD typically found on TradingView. Below is an explanation of its mechanics and how to interpret it.
1. Key Differences
Standard MACD (TradingView Default):
Displays 2 Lines (MACD Line and Signal Line).
The Histogram represents the difference (gap) between those two lines.
MT5 Style MACD (Classic):
The MACD value is plotted as a Histogram (bars) instead of a line.
The Signal Line appears as a standard Line (usually red) overlaying the histogram.
In summary: In the MT5 style, the Histogram represents the actual MACD Line, while the separate line acts as the Signal filter.

SETUP XANDAO ETFEste setap é usado para operar nos futuros, usamos essas métricas para poder achar entradas

IDAHL | QuantEdgeBIDAHL | QuantEdgeB
🔍 Overview
The IDAHL indicator builds adaptive, volatility-aware threshold bands from two separate ALMA lines—one smoothed from recent highs, the other from recent lows—then uses percentiles of those lines to define a dynamic “high/low” channel. Price crossing above or below that channel triggers clear long/short signals, with on-chart candle coloring, fills, optional labels and even a built-in backtest table.
✨ Key Features
• 📈 Dual ALMA Bands (with DEMA pre-smoothing)
o High ALMA: ALMA applied to DEMA-smoothed highs (high → DEMA(30) → ALMA).
o Low ALMA: ALMA applied to DEMA-smoothed lows (low → DEMA(30) → ALMA).
• 📊 Percentile Thresholds
o Computes a high threshold at the Xth percentile of the High ALMA over a lookback window.
o Computes a low threshold at the Yth percentile of the Low ALMA.
o Shifts each threshold forward by a small period to reduce repainting.
• ⚡ Dynamic Channel Logic
o When price closes above the high percentile line, the “final” threshold flips down to the low percentile line (and vice versa), creating an adaptive channel that only moves when the outer bound is violated.
o Inside the channel, the threshold holds its last value to avoid whipsaw.
• 🎨 Visual & Alerts
o Plots the two percentile lines and fills between them with a color that reflects the current regime (green for long, yellow for neutral, orange for short).
o Colors your candles to match the active signal.
o Optional “Long”/“Short” labels on confirmed flips.
o Alert conditions fire on each long/short crossover.
• 📊 On-Chart Backtest Metrics
o Toggle on a small performance table—complete with win-rate, net P/L, drawdown—from your chosen start date, without any extra code.
⚙️ How It Works
1. Adaptive Smoothing (ALMA)
o Uses ALMA (Arnaud Legoux Moving Average) for smooth, low-lag filtering. In this script, the inputs are additionally pre-smoothed with DEMA(30) to reduce noise before ALMA is applied—improving stability on highs/lows.
2. Percentile Lines
o The High ALMA series feeds a linear-interpolation percentile function to generate the upper bound; the Low ALMA produces the lower bound.
o These lines are offset by a small look-ahead (X bars) to reduce repaint behavior.
3. Channel Logic
o Breakout Flip: When the selected source (default: Close) closes above the upper bound, the active threshold “jumps” to the lower bound—locking in a new channel until price next crosses.
o Breakdown Flip: Conversely, a close below the lower bound flips the threshold to the upper bound.
4. Signal Generation
o Long while the source is above the current “final” threshold.
o Short while below.
o Neutral inside the channel before any flip.
5. Visualization & Alerts
o Dynamic fills between the two percentile lines change hue as the regime flips.
o Candles adopt the regime color.
o Optional pinned “Long”/“Short” labels at flip bars.
o Alerts on every signal crossover of the zero-based regime line.
6. Backtest Table
o From your chosen start date, a mini-table displays cumulative P/L, win rate and drawdown for this strategy—handy for quick in-chart validation.
🎯 Who Should Use It
• Breakout Traders hunting for adaptive channels that auto-recenter on new highs/lows.
• Volatility Traders who want thresholds that expand and contract with market turbulence.
• Trend-Chasers seeking a fresh take on high/low channels with built-in smoothing.
• Systematic Analysts who appreciate on-chart backtesting without leaving TradingView.
⚙️ Default Settings
• ALMA Length: 14
• Percentile Length: 35 bars
• Percentile Lookback Period (offset): 4 bars
• Upper Percentile: 92%
• Lower Percentile: 50%
• Threshold Source: Close
• Visuals: Candle coloring on, labels off by default, “Strategy” palette
• Backtest Table: on by default (toggleable)
• Start Date (Backtest): 09 Oct 2017
📌 Conclusion
IDAHL blends two smooth, low-lag ALMA filters (fed by DEMA-smoothed highs/lows) with percentile-based channel construction for a self-rewiring high/low envelope. It gives you robust breakout/breakdown signals, immediate visual context via colored fills and candles, optional labels, alerts, and even performance stats—everything you need to spot and confirm regime shifts in one compact script.
🔹 Disclaimer : Past performance is not indicative of future results. Always backtest and align settings with your risk tolerance and objectives before live trading.
🔹 Strategic Advice : Always backtest, optimize, and align parameters with your trading objectives and risk tolerance before live trading.

BTE/TSS - IB 2.0📊 BTE – IB 2.0 (Initial Balance Framework)
BTE – IB 2.0 is a professional Initial Balance (IB) indicator designed for intraday traders who focus on market structure, auction logic, and contextual decision-making — not signal chasing.
The indicator automatically calculates IB High, IB Low, and IB Mid from a user-defined session (default: NY open) and projects IB-based extensions derived from the actual IB range, not arbitrary multipliers.
This is not a predictive tool.
It is a structural framework for understanding market behavior.
📐 What the indicator displays
• IB High & IB Low – core auction boundaries
• IB Mid (50%) – balance point of the auction
• IB Extensions (1×, 2×, 3×) – range-based projections
• Intermediate 50% levels between all extensions
• Optional IB calculation area (boxed range)
• Clean, readable IB level labels directly on the chart
All elements are fully customizable: colors, line styles, extensions, labels, and visibility.
📊 IB Delta & NY Range Analytics
The indicator includes a 20-day statistical table showing:
• IB Range (IB Delta)
• NY Session Range
• Maximum / Mean / Minimum / Current day values
This helps traders:
• evaluate volatility context
• distinguish rotational vs. expansion days
• avoid trading breakouts when statistics do not support them
👤 Who this indicator is for
• Traders using auction market theory
• Traders working with Initial Balance structure
• Traders focused on context, behavior, and reaction
🚫 Who this indicator is NOT for
• Traders looking for buy/sell signals
• Traders expecting predictions
• Traders ignoring session context and structure
🕒 Recommended use
• ES / NQ / YM / RTY
• Futures & index markets
• NY RTH session
• Best combined with Market Profile, order flow, and price action
⚠️ Important note
This indicator does not predict direction.
It defines auction boundaries — execution and bias are the trader’s responsibility.
If you do not understand how to work with Initial Balance, the issue is not the tool.
📩 Contact
For questions, access, or professional use inquiries:
admin@tradingstrategystore.com

Global Sessions Pro NY/London/Tokyo - O/C/H/LGLOBAL SESSIONS PRO — NY / LONDON / TOKYO
Session Opens, Highs, Lows, Midpoints, Closes, Ranges & Killzones
OVERVIEW
Global Sessions Pro is a comprehensive session-mapping indicator designed for traders who rely on market structure, session context, and time-based behavior.
The indicator automatically plots New York, London, and Tokyo sessions, including:
• Session Open, High, Low, Midpoint, and Close
• Prior session levels projected forward
• Session range boxes
• Right-side labeled price levels (clearly identified)
• Stacked session summary labels (no overlap)
• Optional killzones and overlap windows
• Breakout alerts (prior or current session levels)
The script is fully timezone-aware, DST-safe, and works on any chart timeframe.
KEY FEATURES
SESSION MAPPING
For each session (NY / London / Tokyo), the indicator can display:
• Open
• High
• Low
• Midpoint (High + Low) / 2
• Close
Each level is drawn with its own horizontal line and optional right-side label, so there is never confusion about which line represents which level.
SESSION RANGE BOXES
Optional shaded boxes highlight the true session range as it develops in real time.
These are useful for visualizing:
• Compression vs expansion
• Relative session volatility
• Strength or weakness between sessions
Opacity and visibility are fully configurable.
RIGHT-SIDE LEVEL LABELS
Each session level can be labeled on the right edge of the chart, showing:
• Session name (NY / Lon / Tok)
• Level type (O / H / L / M / C)
• Optional price value
Examples:
NY H: 18234.25
Lon L: 18098.50
Tok M: 18142.75
This eliminates ambiguity when multiple session levels overlap or share similar colors.
SESSION SUMMARY LABELS (AUTO-STACKED)
At the top of each session range, an optional summary label displays:
• Session name
• Open / High / Low / Close
• Total range (points)
• Range in ticks
• ATR multiple
Summary labels are automatically stacked vertically using ATR-based or tick-based spacing, preventing overlap even when multiple sessions occur close together.
PRIOR SESSION LEVELS
The indicator can project prior session levels into the next session, including:
• Prior High and Low
• Optional prior Open, Close, and Midpoint
These levels are commonly used for:
• Support and resistance
• Liquidity sweeps
• Mean reversion
• Failed breakouts
Projection length is configurable and safely capped to comply with TradingView drawing limits.
KILLZONES AND SESSION OVERLAPS
Optional background shading highlights key institutional windows:
• London Open
• New York Open
• London / New York overlap
These zones help identify high-probability volatility windows and time-based trade filters.
All killzones respect the selected session timezone basis.
ALERTS
Built-in alerts are available for:
• Break of prior session high
• Break of prior session low
• Break of current session high
• Break of current session low
Alerts can be configured to trigger on wick or close.
Alert logic is written using precomputed crossover detection to ensure historical consistency and avoid missed or false alerts.
TIMEZONE AND SESSION HANDLING (IMPORTANT)
SESSION TIME BASIS OPTIONS
The indicator supports three session-time modes:
Market Local (DST-aware) – Recommended
• New York uses America/New_York
• London uses Europe/London
• Tokyo uses Asia/Tokyo
• Automatically adjusts for daylight saving time
UTC (Fixed)
• Sessions are interpreted strictly in UTC
• Best for crypto or non-DST workflows
• Requires manual adjustment during DST changes
Custom Timezone
• Define a single custom timezone for all sessions
This ensures sessions display correctly regardless of the chart’s timezone.
DEFAULT SESSION TIMES
(Default values assume Market Local (DST-aware) mode)
Tokyo: 09:00 – 15:00
London: 08:00 – 16:30
New York: 09:30 – 16:00
These defaults are optimized for cash and index trading.
FX traders may adjust session windows as needed.
BEST USE CASES
This indicator is particularly effective for:
• Index futures (ES, NQ, RTY, DAX, FTSE)
• Forex session-based strategies
• Time-based breakout systems
• Liquidity sweep and mean-reversion models
• London Open and New York Open trading
• Multi-session market context analysis
PERFORMANCE AND SAFETY NOTES
• All future-drawn objects are capped to comply with TradingView limits
• Crossover logic is evaluated every bar to prevent calculation drift
• Old session drawings are automatically culled to reduce chart clutter
• Works on all intraday and higher timeframes
RECOMMENDED SETTINGS
For most traders:
• Session Time Basis: Market Local (DST-aware)
• Show Open / High / Low / Midpoint: ON
• Prior Session Levels: ON
• Summary Labels: ON
• Killzones: ON
• Alerts: ON (Close-based)
FINAL NOTES
This indicator is designed to provide objective session structure without opinionated trade signals. It works best as a context layer combined with your own execution rules, confirmations, and risk management.
If you trade time, structure, and liquidity, this script provides the framework.

HoneG_MATSU_4GYAKUBARI_MAIN_v3This tool generates counter-trend signals recommended for 3- to 5-minute trades, though it is applied to 1-minute charts.
適用するのは1分チャートですが、取引は3分~5分推奨の逆張りサインツールです。

MARAL Execution WorkflowOverview
MARAL Execution Workflow is a discretionary execution decision-support indicator designed to organize market context into a consistent workflow. It is not an automated trading system, does not place orders, and does not predict outcomes.
Meaning of MARAL: Market Alignment + Risk Awareness + Logic-based execution gating — a structured workflow framework designed to improve clarity and consistency in discretionary execution.
This tool supports discretionary decision-making across three stages: Context → Qualification → Management.
It extends analysis beyond entry by supporting post-entry decisions such as: Should I stay? Should I reduce risk? Should I exit? Or should I wait? These are decision-support questions, not predictions.
Key Features
9-Layer Framework + 3 Boards + EDC
The script uses a 9-layer framework coordinated by a centralized decision-state layer (EDC). Each layer has a defined role:
1. Directional Context (Trend/Bias Layer) — establishes a directional preference using configurable bias filters.
2. Higher-Timeframe Context (HTF Layer) — anchors execution to broader context when enabled.
3. Structure Mapping (Swing/Structure Layer) — identifies structural behavior (highs/lows) to frame decision areas.
4. Location / Proximity Awareness (Obstacle Layer) — evaluates proximity to likely reaction areas for risk awareness.
5. Momentum Quality (Momentum Layer) — distinguishes healthier follow-through vs weakening/choppy conditions.
6. Volatility / Stability Regime (VOL/REGIMI) evaluates volatility using ATR% thresholds and regime support using ADX.
7. Pre-Entry Qualification (Checklist Layer) — confirms whether minimum execution conditions are satisfied before entry.
8. Post-Entry Management Context (Management Layer) — monitors changing conditions after a setup for discretionary management.
9. Liquidity Context (Liquidity Layer) — integrates liquidity-based location context using PDH/PDL proximity, sweep/reclaim behavior, and lookback extreme breaks. When enabled, the script may also plot liquidity reference points for visual mapping.
Liquidity Regime States (Panel Output)
The Liquidity Layer displays a 3-state liquidity regime used for execution risk awareness:
• HIGH — a liquidity event is detected (e.g., sweep/reclaim or lookback extreme break).
• NEUTRAL — no event, but liquidity is nearby (proximity to PDH/PDL within a defined threshold).
• LOW — no event and no nearby liquidity pressure detected.
These are context/risk states used for discretionary gating — not buy/sell signals and not outcome predictions.
Boards
• Context Board — summarizes direction, HTF context, structure, momentum, volatility (ATR%), trend regime (ADX), scores, and liquidity context.
• Qualification Gate — rule-based checklist view to confirm minimum execution conditions before entry.
• Management Desk — post-setup view to monitor risk changes, obstacle proximity, deterioration cues, and management states.
EDC — Execution Decision Core
EDC consolidates outputs from the framework into unified workflow states. It applies rule-based gating to reduce conflict when conditions are mixed.
EDC Unified Output States (Decision-Support Only):
• SETUP: WAIT / LONG / SHORT
• ENTRY PERMISSION: ENTER / WAIT / SKIP
• LIQUIDITY: HIGH / NEUTRAL / LOW
• TRADE STATUS: VALID / RISKY / WEAK / —
• ACTION STATE: HOLD / TIGHT SL / SCALE OUT / EXIT / —
— may appear when a state is not applicable (e.g., no active management window is being tracked).
Panels & Labels (Exact On-Chart Meanings)
1) Context Board (Market Environment Snapshot)
• DIRECTION → Bullish / Bearish / Neutral
• H1 CONTEXT / H4 CONTEXT / DAILY CONTEXT → HTF bias states (when enabled). If HTF is disabled, shows OFF.
• STRUCTURE → Bull Struct / Bear Struct / Neutral Struct
• MOMENTUM → BULL / BEAR / NEUTRAL
• VOLATILITY (ATR%) → ATR as a percentage of price (volatility context)
• TREND STRENGTH → ADX context value
• LONG SCORE / SHORT SCORE → internal workflow alignment scores (0–100) with grade: A++ / A+ / A / B / No-Trade
• ALIGNMENT SCORE → combined alignment score used for gating
• LIQUIDITY CONTEXT → HIGH / NEUTRAL / LOW
Important: Scores are internal workflow scoring for filtering/alignment. They are not performance statistics and do not imply guaranteed probability or outcomes.
2) Qualification Gate (Pre-Entry Checklist)
Gate Legend: OK = passes filter, WARN = mixed/caution, BAD = fails filter (execution gated).
• SETUP → WAIT / LONG / SHORT
• HTF CONTEXT → OK / WARN / BAD / —
• STRUCTURE → OK / WARN / BAD / —
• MOMENTUM → OK / WARN / BAD / —
• VOL/REGIME → OK / WARN / BAD / — (Volatility + regime filter; not volume)
o OK = ATR% within thresholds AND ADX meets regime requirement
o WARN = ATR% within thresholds but regime is mixed (ADX below threshold)
o BAD = ATR% outside thresholds
• LIQUIDITY → HIGH / NEUTRAL / LOW
• ALIGNMENT → shows score vs required minimum threshold
• ENTRY PERMISSION → ENTER / WAIT / SKIP
Purpose: reduce forced entries by requiring minimum execution quality.
3) Management Desk (Post-Setup Decision Support)
The Management Desk operates inside an Active Window measured in bars after the last setup (configurable by input). When the management window is not active, some fields may show —.
• TRADE STATUS → VALID / RISKY / WEAK / —
— appears when no active trade state is being tracked (not applicable).
• MARKET PHASE → RANGE / IMPULSE / PULLBACK / CONTINUATION
Environment classification used for management context (not prediction).
• OBSTACLE AHEAD → YES / NO
Proximity risk context (e.g., near PDH/PDL or near swing levels under the script’s logic).
• EXIT PRESSURE → LOW / RISING / HIGH
Management pressure context based on deterioration cues (not a signal).
• MOMENTUM HEALTH → STRONG / WEAKENING / WEAK / NEUTRAL
Follow-through quality context used for management.
• SCORE TREND → IMPROVING / DETERIORATING / STABLE
Direction of the internal workflow score trend (not P&L, not performance).
• RISK STATE → OVEREXTENDED / NORMAL
Overextension context based on distance from EMA vs ATR.
• TRADE AGE → FRESH / MID / LATE / —
Workflow age based on bars since last setup. — when not applicable.
• SL MODE → BE OK / TIGHT / NORMAL / —
Stop-management context used for discretionary risk control. — when not applicable.
• ACTION STATE → HOLD / TIGHT SL / SCALE OUT / EXIT / —
o HOLD = maintain the current plan under present conditions
o TIGHT SL = discretionary prompt to reduce risk by tightening protection
o SCALE OUT = discretionary prompt to partially reduce exposure (partial exit / trim size), typically when obstacle proximity risk is detected
o EXIT = discretionary prompt that conditions deteriorated and exit may be considered
o — = not applicable
• ACTIVE WINDOW → ON / OFF
Shows whether the post-setup management window is active (bars after the last setup, per the “Active Window” input). When OFF, management/trade states may show —.
Optional Modules (Toggleable)
To keep the chart clean and workflow-focused, optional modules can be enabled/disabled:
A) PDH/PDL Reference (Optional)
• Plots Previous Day High / Previous Day Low as structured reference points (risk awareness only).
B) ATR-Based Planning Guides (Optional)
• Optional visual guides for SL / TP1 / TP2 / TP3 based on ATR.
• Visual planning references only. Does not place orders and does not guarantee outcomes.
C) Visual Color Layer (Optional)
• Optional state-based candle coloring for readability only.
D) State Markers (Optional)
• Optional state markers (e.g., LONG/SHORT confirmations). These are state confirmations only, not trade recommendations.
Display & Layout Options
• Display Mode: Mobile / Medium / Desktop
• Mobile Minimal View: optional minimal mode (EDC-only)
• Panel Positioning: 9 anchor positions
(Top Left / Top Center / Top Right / Middle Left / Middle Center / Middle Right / Bottom Left / Bottom Center / Bottom Right)
Why This Is Not a “Mashup”
This publication is not intended to bundle multiple classic indicators as independent buy/sell tools. While it uses familiar building blocks (trend/bias filtering, volatility/regime context, structure references, liquidity context), each component has a defined role inside a single execution workflow:
• Context Board → Qualification Gate → Management Desk organizes information into a consistent discretionary process.
• EDC consolidates multi-layer conditions into unified states using rule-based gating to reduce conflict and prioritize risk awareness.
This is a decision-support framework designed to improve clarity and consistency in discretionary execution. It does not place orders and does not provide guaranteed outcomes.
How to Use (Recommended Workflow)
1. Set context: Use the Context Board to determine directional preference, volatility/regime stability, and location context.
2. Qualify execution: Use the Qualification Gate as the filter. If alignment is not sufficient, avoid forcing entries.
3. Execute with location awareness: Avoid late entries into nearby obstacles. Treat proximity as increased risk.
4. Manage post-setup: Use the Management Desk to monitor risk changes. If states deteriorate, follow your plan (reduce risk, protect, or exit).
5. Stay consistent: Works best with position sizing rules and disciplined confirmation.
Screenshots / Visual Reference (What each panel shows)
Screenshot 1 — Full Workflow View (Desktop)
Shows the complete workflow layout on one chart: Context Board, Qualification Gate, Management Desk, and the EDC (Execution Decision Core) summary together.
Screenshot 2 — Context Board
Shows directional context, HTF context (if enabled), structure mapping, momentum quality, volatility/stability regime (ATR + ADX), and liquidity context (HIGH/NEUTRAL/LOW). This board is used to understand “market alignment” before considering execution.
Screenshot 3 — Qualification Gate (Pre-Entry)
Shows the rule-based checklist view used for discretionary pre-entry qualification. It summarizes SETUP (WAIT/LONG/SHORT), key confluence checks, liquidity context, and ENTRY PERMISSION (ENTER/WAIT/SKIP). This is a gating view—meant to prevent forced entries when alignment is insufficient.
Screenshot 4 — Management Desk (Post-Entry)
Shows post-entry condition monitoring within the active window after the last setup. It highlights trade status shifts (VALID/RISKY/WEAK), obstacle proximity, exit pressure, momentum health, score trend, risk state, SL mode, and action guidance context.
Screenshot 5 — EDC Panel (Execution Decision Core) — Centralized State
Shows the unified decision-support outputs consolidated from the workflow layers and boards into one compact view:
• SETUP: WAIT / LONG / SHORT
• ENTRY PERMISSION: ENTER / WAIT / SKIP
• LIQUIDITY: HIGH / NEUTRAL / LOW
• TRADE STATUS: VALID / RISKY / WEAK
• ACTION STATE: HOLD / TIGHT SL / SCALE OUT / EXIT
These are rule-based guidance states for discretionary execution and risk awareness — not automated actions.
Screenshot 6 — Example –Execution context
The screenshot shows MARAL Execution Workflow applied to XAUUSD on the 1-hour timeframe. All three boards and the EDC panel are visible:
• Context Board (top-right) – Confirms a fully aligned bullish environment: direction and all HTF contexts are Bullish, structure is “Bull Struct”, momentum is “BULL”, volatility (ATR%) is within normal bounds, and the long-side alignment score is high while the short-side score is in “No-Trade” territory. Liquidity Context is “LOW”, indicating limited immediate liquidity pressure.
• Qualification Gate (top-center) – For the same bar, the checklist produces a LONG setup with HTF CONTEXT, STRUCTURE, MOMENTUM and VOL/REGIME all marked OK. Liquidity is LOW, and ALIGNMENT shows “93 / 65”, meaning the current long-side score (93) is above the user-defined minimum threshold (65). ENTRY PERMISSION = ENTER, signaling that, within this framework, execution conditions are sufficiently aligned to allow a discretionary long entry according to the trader’s own plan.
• Management Desk (left) – Once a trade is active, the post-entry view monitors evolving risk. In this example the trade status is VALID and MARKET PHASE is CONTINUATION, while RISK STATE highlights OVEREXTENDED and TRADE AGE is FRESH. MOMENTUM HEALTH = STRONG, SCORE TREND = STABLE, and ACTION STATE = HOLD. This illustrates how the panel can flag extension or emerging pressure without forcing a decision.
• EDC | Execution Decision Core (bottom-right) – The EDC panel consolidates the key states into one unified view: SETUP = LONG, ENTRY PERMISSION = ENTER, LIQUIDITY = LOW, TRADE STATUS = VALID, ACTION STATE = HOLD. These are rule-based guidelines summarizing the interaction between Context, Qualification, Management and liquidity conditions. They are decision-support outputs only; they do not place orders and do not imply any guaranteed outcome.
Inputs & Customization
Inputs are provided to adapt the workflow to different instruments and timeframes, including:
• bias/trend parameters and smoothing, optional HTF context,
• structure sensitivity and lookback,
• momentum thresholds,
• volatility thresholds (ATR% limits) and regime filter (ADX),
• liquidity sensitivity (lookback / proximity thresholds),
• visuals (show/hide boards, display mode, mobile minimal view, text size, positioning).
Markets & Timeframes
Designed for multiple markets and instruments available on Trading View, including:
• Indices (index charts / index futures where available — not an options-chain or options-pricing tool)
• Crypto
• Forex
• Stocks / ETFs
• Commodities
Timeframe-agnostic: can be applied from lower to higher timeframes based on your trading style. Results vary by instrument, timeframe, and volatility/regime.
Limitations (Important)
• Discretionary analysis tool only; does not place trades.
• Optional markers/labels (if enabled) are state confirmations only, not recommendations.
• HTF values can update as HTF candles develop.
• Structure/obstacle references are informational decision areas and may be exceeded.
• No indicator removes risk; risk management remains essential.
• Provided “as-is.” Outputs may differ across symbols, sessions, spreads, or data feeds.
Risk & Disclaimer
Trading involves risk. Past behavior does not indicate future performance. This script is provided for educational and analytical purposes only. You are responsible for all trading decisions, including entries, exits, position sizing, and risk management. The script does not place trades and does not provide investment advice.


ICT Smart Bias Toolkit FVG, CRT and Multi-Timeframe Market Bias📌 Indicator Description — ICT Smart Bias Toolkit
ICT Smart Bias Toolkit is an advanced price action indicator designed for ICT / Smart Money traders.
It combines Fair Value Gaps (FVG), Candle Range Theory (CRT) logic, and a multi-timeframe (HTF) bias screener to provide clear top-down market context and precise areas of interest.
The indicator does not repaint and is based strictly on closed candles.
🔍 Core Features
🟩 Fair Value Gaps (FVG)
Automatically detects Bullish and Bearish FVGs on the current timeframe
FVG zones:
extend forward in time,
register first touch,
deactivate after full mitigation
User-configurable number of visible FVG zones (default: 2)
📏 CRT – Previous High / Low Levels
When a CRT candle forms, the previous candle’s High and Low are plotted
These levels:
extend until price is reached,
stop automatically on touch
Each level is labeled with its timeframe (W / D / H4)
No arrows or candle markers → clean and uncluttered chart
🧭 HTF Bias Screener (Weekly / Daily / H4)
A compact screener displays:
BIAS for Weekly, Daily, and H4
DIRECTION: Bullish / Bearish
REASON, using a strict priority logic:
If a CRT candle formed on the last closed candle
Otherwise, Close vs Previous Close
This screener is intended for context and directional bias, not trade entries.
🔔 Alerts (Fully Configurable)
Practical, trader-focused alerts are included for:
FVG formation
FVG touch
FVG full mitigation
CRT Previous High / Low hit
Bias change (Weekly / Daily / H4)
Top-down confluence alerts, such as:
Daily CRT bias + H4 FVG touch
Weekly CRT bias + Daily FVG touch
All alerts are designed for real trading scenarios, not signal spam.
🧠 How to Use
Identify directional bias using the HTF screener
Wait for price to return into a relevant FVG zone
Use CRT High/Low levels as liquidity reference points
Execute trades using your own price action confirmation
This indicator provides context, not entries.
⚠️ Disclaimer
This is not a signal indicator.
It is a market structure and bias tool, intended to support an ICT / Smart Money trading framework.

MarketMastery Pivot Matrix by DGTThe MarketMastery Pivot Matrix™ is an advanced pivot point framework designed to provide comprehensive market context, bias assessment, and trend analysis. It integrates multiple pivot calculation methods, central pivot ranges, higher-timeframe references, and a suite of add-on indicators to deliver a complete market structure toolkit. Suitable for intraday, swing, and positional traders, the tool consolidates key support/resistance levels, equilibrium zones, directional flow, and volatility insights into a single, visually intuitive interface.
KEY FEATURES
⯌ Pivot Point Framework
The MarketMastery Pivot Matrix™ offers a complete solution for analyzing pivot points, price equilibrium, trend direction, and volatility. Supporting multiple pivot calculation methods—including Camarilla, Fibonacci, Swing, Traditional, and Woodie—it allows traders to customize analysis according to strategy and timeframe.
⯌ Central Pivot Range (CPR)
CPR is a core component of the Pivot Matrix™, offering a clear view of market structure and key decision zones. Traditionally used for intraday analysis, CPR is equally effective on higher timeframes (daily, weekly, monthly), highlighting support/resistance, market balance, and swing opportunities. Integrated within the Pivot Matrix™, it works seamlessly with other pivot components to provide a comprehensive trading framework across all timeframes.
⯌ Higher-Timeframe OHLC References
Displays previous session Open, High, Low, and Close from user-selected or dynamically calculated higher timeframes. Assists traders in assessing intraday support/resistance and session reactions.
⯌ Pivot High-Low Levels
Identifies key swing highs and lows as well as short-term potential pivot points. Highlights support/resistance zones, helping traders assess market structure, anticipate reversals, and spot trend continuation opportunities.
⯌ Directional Flow State
Combines ADX and DMI to provide clear insight into trend direction, strength, and momentum. Helps distinguish valid trending conditions from weak or ranging periods.
⯌ Mean Proximity State
Measures price deviation from equilibrium to classify balanced, extended, or extreme market states. Assists in evaluating potential reversion pressure and volatility expansion.
⯌ Logistic EMA Trend State (LEMA)
Applies a logistic transformation to price dynamics, smoothed by EMA for adaptive trend detection. Provides responsive trend visualization with reduced noise, helping identify trend direction and momentum.
⯌ Ichimoku Cloud Projection
Extends the Kumo cloud forward to visualize market bias, momentum, and dynamic support/resistance. Helps identify consolidation, trend direction, and equilibrium zones.
⯌ Linear Regression Channel
Fits a least-squares trend line to price, displaying slope and price dispersion. Helps traders identify trend direction, stability, and volatility.
⯌ Market Sentiment State
Evaluates market bias by analyzing price position relative to CPR and pivot levels. Provides a quick visual assessment of bullish, bearish, or neutral conditions.
⯌ Price Range & ATR State
Displays current and previous higher-timeframe ranges alongside ATR-based expected ranges. Helps assess volatility, monitor session expansion/contraction, and identify potential exhaustion zones.
DISCLAIMER
This script is intended for informational and educational purposes only. It does not constitute financial, investment, or trading advice. All trading decisions made based on its output are solely the responsibility of the user.
Płatny skrypt
