FunctionMatrixSolveLibrary "FunctionMatrixSolve"
Matrix Equation solution for Ax = B, finds the value of x.
solve(A, B) Solves Matrix Equation for Ax = B, finds value for x.
Parameters:
A : matrix, Square matrix with data values.
B : matrix, One column matrix with data values.
Returns: matrix with X, x = A^-1 b, assuming A is square and has full rank
introcs.cs.princeton.edu
Arrays

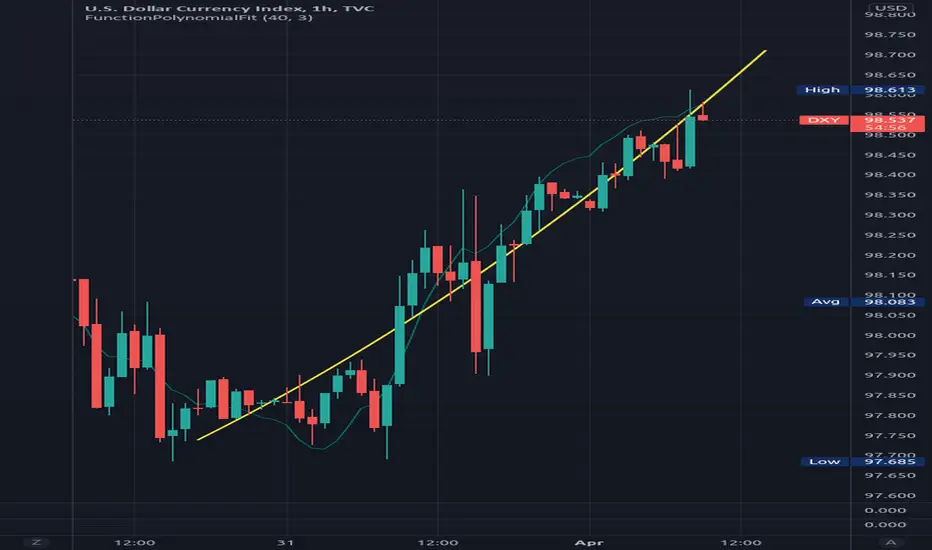
FunctionPolynomialFitLibrary "FunctionPolynomialFit"
Performs Polynomial Regression fit to data.
In statistics, polynomial regression is a form of regression analysis in which
the relationship between the independent variable x and the dependent variable
y is modelled as an nth degree polynomial in x.
reference:
en.wikipedia.org
www.bragitoff.com
gauss_elimination(A, m, n) Perform Gauss-Elimination and returns the Upper triangular matrix and solution of equations.
Parameters:
A : float matrix, data samples.
m : int, defval=na, number of rows.
n : int, defval=na, number of columns.
Returns: float array with coefficients.
polyfit(X, Y, degree) Fits a polynomial of a degree to (x, y) points.
Parameters:
X : float array, data sample x point.
Y : float array, data sample y point.
degree : int, defval=2, degree of the polynomial.
Returns: float array with coefficients.
note:
p(x) = p * x**deg + ... + p
interpolate(coeffs, x) interpolate the y position at the provided x.
Parameters:
coeffs : float array, coefficients of the polynomial.
x : float, position x to estimate y.
Returns: float.
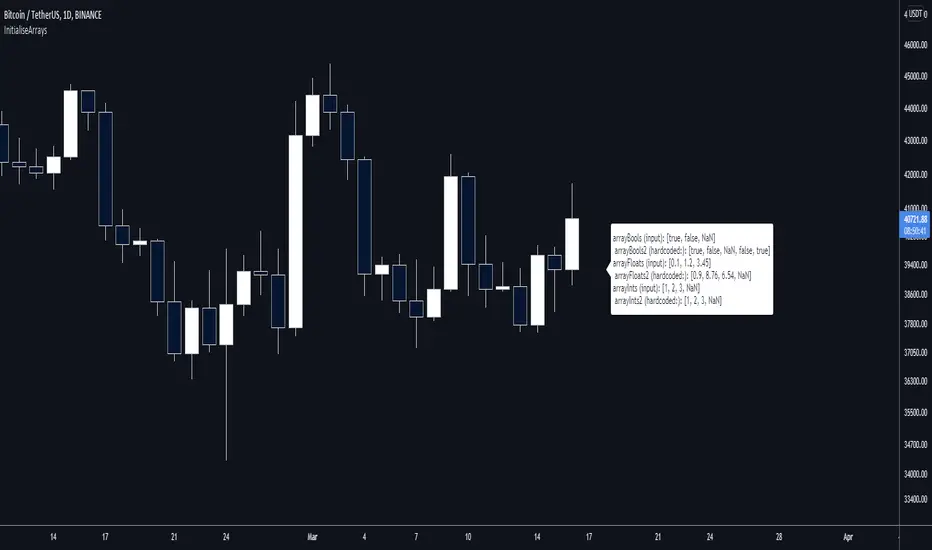
InitialiseArraysLibrary "InitialiseArrays"
@description: Efficiently create arrays, populating them with an arbitrary number of elements and setting their starting values. Works with a mix of typed and na values.
A limitation of the built-in functions to create arrays is that while you can create and populate arrays with a single command, you can only set all elements to the same value in this way.
Or, you can create an array from a set of values or variables, but you can't include any na values.
Now, it's easy enough to work around this, but I wanted to make something more efficient (because I want to use lots of arrays), hence this library.
Calling a function from here is more efficient because you only do it once (assuming it's a var) and don't evaluate an if condition each run, and don't create unnecessary variables.
It's also easier to read and takes less space.
f_initialiseBoolArray()
@function f_initialiseBoolArray(string _values) Creates a boolean array, populated with the values that you specify in the input string.
@param _values is a string that contains a comma-separated list of the values that you want to initialise the boolean array with. Values other than true, false, and na are disregarded. Spaces are disregarded.
@returns Returns a boolean array of arbitrary length.
f_initialiseFloatArray()
@function f_initialiseFloatArray(string _values) Creates a float array, populated with the values that you specify in the input string.
@param _values is a string that contains a comma-separated list of the values that you want to initialise the float array with. Non-numerical entries are converted to NaN values. Spaces are disregarded.
@returns Returns a float array of arbitrary length.
f_initialiseIntArray()
@function f_initialiseIntArray(string _values) Creates an int array, populated with the values that you specify in the input string.
@param _values is a string that contains a comma-separated list of the values that you want to initialise the int array with. Floating-point numbers are rounded down to the nearest integer. Any na values are preserved. Spaces are disregarded.
@returns Returns a float array of arbitrary length.
V1 includes functions for bools, floats, and ints. I might extend it if people want.
drawingutilsLibrary "drawingutils"
Private methods used in my scripts for some basic and customized drawings. No documentation provided as these are meant for private use only.
draw_line()
draw_label()
draw_linefill()
draw_labelled_line()
draw_labelled_box()
runTimer()
ConditionalAverages█ OVERVIEW
This library is a Pine Script™ programmer’s tool containing functions that average values selectively.
█ CONCEPTS
Averaging can be useful to smooth out unstable readings in the data set, provide a benchmark to see the underlying trend of the data, or to provide a general expectancy of values in establishing a central tendency. Conventional averaging techniques tend to apply indiscriminately to all values in a fixed window, but it can sometimes be useful to average values only when a specific condition is met. As conditional averaging works on specific elements of a dataset, it can help us derive more context-specific conclusions. This library offers a collection of averaging methods that not only accomplish these tasks, but also exploit the efficiencies of the Pine Script™ runtime by foregoing unnecessary and resource-intensive for loops.
█ NOTES
To Loop or Not to Loop
Though for and while loops are essential programming tools, they are often unnecessary in Pine Script™. This is because the Pine Script™ runtime already runs your scripts in a loop where it executes your code on each bar of the dataset. Pine Script™ programmers who understand how their code executes on charts can use this to their advantage by designing loop-less code that will run orders of magnitude faster than functionally identical code using loops. Most of this library's function illustrate how you can achieve loop-less code to process past values. See the User Manual page on loops for more information. If you are looking for ways to measure execution time for you scripts, have a look at our LibraryStopwatch library .
Our `avgForTimeWhen()` and `totalForTimeWhen()` are exceptions in the library, as they use a while structure. Only a few iterations of the loop are executed on each bar, however, as its only job is to remove the few elements in the array that are outside the moving window defined by a time boundary.
Cumulating and Summing Conditionally
The ta.cum() or math.sum() built-in functions can be used with ternaries that select only certain values. In our `avgWhen(src, cond)` function, for example, we use this technique to cumulate only the occurrences of `src` when `cond` is true:
float cumTotal = ta.cum(cond ? src : 0) We then use:
float cumCount = ta.cum(cond ? 1 : 0) to calculate the number of occurrences where `cond` is true, which corresponds to the quantity of values cumulated in `cumTotal`.
Building Custom Series With Arrays
The advent of arrays in Pine has enabled us to build our custom data series. Many of this library's functions use arrays for this purpose, saving newer values that come in when a condition is met, and discarding the older ones, implementing a queue .
`avgForTimeWhen()` and `totalForTimeWhen()`
These two functions warrant a few explanations. They operate on a number of values included in a moving window defined by a timeframe expressed in milliseconds. We use a 1D timeframe in our example code. The number of bars included in the moving window is unknown to the programmer, who only specifies the period of time defining the moving window. You can thus use `avgForTimeWhen()` to calculate a rolling moving average for the last 24 hours, for example, that will work whether the chart is using a 1min or 1H timeframe. A 24-hour moving window will typically contain many more values on a 1min chart that on a 1H chart, but their calculated average will be very close.
Problems will arise on non-24x7 markets when large time gaps occur between chart bars, as will be the case across holidays or trading sessions. For example, if you were using a 24H timeframe and there is a two-day gap between two bars, then no chart bars would fit in the moving window after the gap. The `minBars` parameter mitigates this by guaranteeing that a minimum number of bars are always included in the calculation, even if including those bars requires reaching outside the prescribed timeframe. We use a minimum value of 10 bars in the example code.
Using var in Constant Declarations
In the past, we have been using var when initializing so-called constants in our scripts, which as per the Style Guide 's recommendations, we identify using UPPER_SNAKE_CASE. It turns out that var variables incur slightly superior maintenance overhead in the Pine Script™ runtime, when compared to variables initialized on each bar. We thus no longer use var to declare our "int/float/bool" constants, but still use it when an initialization on each bar would require too much time, such as when initializing a string or with a heavy function call.
Look first. Then leap.
█ FUNCTIONS
avgWhen(src, cond)
Gathers values of the source when a condition is true and averages them over the total number of occurrences of the condition.
Parameters:
src : (series int/float) The source of the values to be averaged.
cond : (series bool) The condition determining when a value will be included in the set of values to be averaged.
Returns: (float) A cumulative average of values when a condition is met.
avgWhenLast(src, cond, cnt)
Gathers values of the source when a condition is true and averages them over a defined number of occurrences of the condition.
Parameters:
src : (series int/float) The source of the values to be averaged.
cond : (series bool) The condition determining when a value will be included in the set of values to be averaged.
cnt : (simple int) The quantity of last occurrences of the condition for which to average values.
Returns: (float) The average of `src` for the last `x` occurrences where `cond` is true.
avgWhenInLast(src, cond, cnt)
Gathers values of the source when a condition is true and averages them over the total number of occurrences during a defined number of bars back.
Parameters:
src : (series int/float) The source of the values to be averaged.
cond : (series bool) The condition determining when a value will be included in the set of values to be averaged.
cnt : (simple int) The quantity of bars back to evaluate.
Returns: (float) The average of `src` in last `cnt` bars, but only when `cond` is true.
avgSince(src, cond)
Averages values of the source since a condition was true.
Parameters:
src : (series int/float) The source of the values to be averaged.
cond : (series bool) The condition determining when the average is reset.
Returns: (float) The average of `src` since `cond` was true.
avgForTimeWhen(src, ms, cond, minBars)
Averages values of `src` when `cond` is true, over a moving window of length `ms` milliseconds.
Parameters:
src : (series int/float) The source of the values to be averaged.
ms : (simple int) The time duration in milliseconds defining the size of the moving window.
cond : (series bool) The condition determining which values are included. Optional.
minBars : (simple int) The minimum number of values to keep in the moving window. Optional.
Returns: (float) The average of `src` when `cond` is true in the moving window.
totalForTimeWhen(src, ms, cond, minBars)
Sums values of `src` when `cond` is true, over a moving window of length `ms` milliseconds.
Parameters:
src : (series int/float) The source of the values to be summed.
ms : (simple int) The time duration in milliseconds defining the size of the moving window.
cond : (series bool) The condition determining which values are included. Optional.
minBars : (simple int) The minimum number of values to keep in the moving window. Optional.
Returns: (float) The sum of `src` when `cond` is true in the moving window.

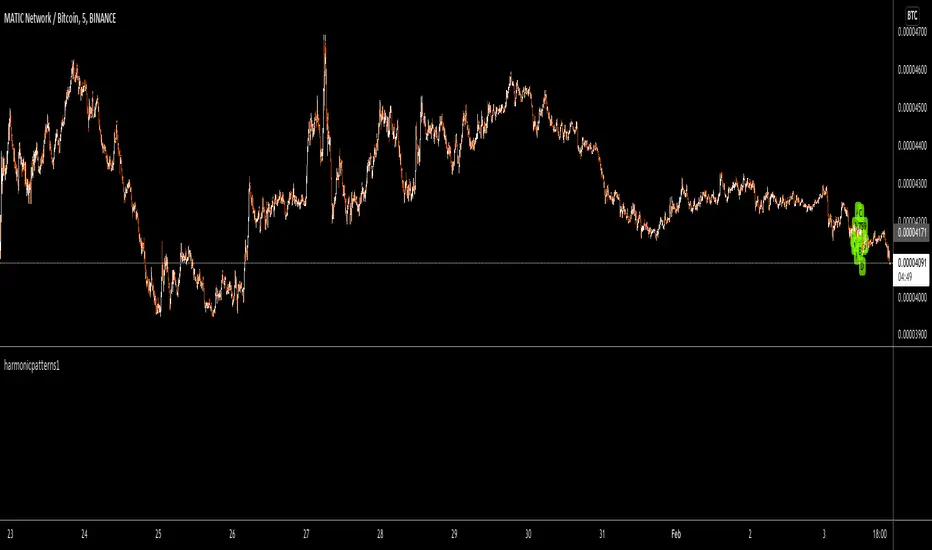
harmonicpatternsarraysLibrary "harmonicpatternsarrays"
Library provides an alternative method to scan harmonic patterns and contains utility functions using arrays.
These are mostly customized for personal use. Hence, will not add documentation for arrays. All credit to @HeWhoMustNotBeNamed
getLabel()
delete()
delete()
delete()
delete()
delete()
pop()
pop()
pop()
pop()
pop()
shift()
shift()
shift()
shift()
shift()
unshift()
unshift()
unshift()
unshift()
unshift()
unshift()
unshift()
unshift()
unshift()
unshift()
clear()
clear()
clear()
clear()
clear()
push()
push()
push()
push()
push()
push()
push()
push()
push()
push()
get_trend_series()
getrange()
getSupportedPatterns()
scan_xab()
scan_abc_axc()
scan_bcd()
scan_xad_xcd()
get_prz_range()
isHarmonicPattern()

jsonLibrary "json"
Convert JSON strings to tradingview
▦ FEATURES ▦
█ Json to array █ Get json key names █ Get json key values █ Size of json
get_json_keys_names(raw_json) Returns string array with all key names
Parameters:
raw_json : (string) Raw JSON string
Returns: (string array) Array with all key names
get_values_by_id_name(raw_json, key_name) Returns string array with values of the input key name
Parameters:
raw_json : (string) Raw JSON string
key_name : (string) Name of the key to be fetched
Returns: (string array) Array with values of the input key name
size_of_json_string(raw_json) Returns size of raw JSON string
Parameters:
raw_json : (string) Raw JSON string
Returns: Size of n_of_values, size of n_of_keys_names

JohnEhlersFourierTransformLibrary "JohnEhlersFourierTransform"
Fourier Transform for Traders By John Ehlers, slightly modified to allow to inspect other than the 8-50 frequency spectrum.
reference:
www.mesasoftware.com
high_pass_filter(source) Detrended version of the data by High Pass Filtering with a 40 Period cutoff
Parameters:
source : float, data source.
Returns: float.
transformed_dft(source, start_frequency, end_frequency) DFT by John Elhers.
Parameters:
source : float, data source.
start_frequency : int, lower bound of the frequency window, must be a positive number >= 0, window must be less than or 30.
end_frequency : int, upper bound of the frequency window, must be a positive number >= 0, window must be less than or 30.
Returns: tuple with float, float array.
db_to_rgb(db, transparency) converts the frequency decibels to rgb.
Parameters:
db : float, decibels value.
transparency : float, transparency value.
Returns: color.

harmonicpatterns1Library "harmonicpatterns1"
harmonicpatterns: methods required for calculation of harmonic patterns. Correction for library (missing export in line 303)
isGartleyPattern(xabRatio, abcRatio, bcdRatio, xadRatio, err_min, err_max) isGartleyPattern: Checks for harmonic pattern Gartley
Parameters:
xabRatio : AB/XA
abcRatio : BC/AB
bcdRatio : CD/BC
xadRatio : AD/XA
err_min : Minumum error threshold
err_max : Maximum error threshold
Returns: True if the pattern is Gartley. False otherwise.
isBatPattern(xabRatio, abcRatio, bcdRatio, xadRatio, err_min, err_max) isBatPattern: Checks for harmonic pattern Bat
Parameters:
xabRatio : AB/XA
abcRatio : BC/AB
bcdRatio : CD/BC
xadRatio : AD/XA
err_min : Minumum error threshold
err_max : Maximum error threshold
Returns: True if the pattern is Bat. False otherwise.
isButterflyPattern(xabRatio, abcRatio, bcdRatio, xadRatio, err_min, err_max) isButterflyPattern: Checks for harmonic pattern Butterfly
Parameters:
xabRatio : AB/XA
abcRatio : BC/AB
bcdRatio : CD/BC
xadRatio : AD/XA
err_min : Minumum error threshold
err_max : Maximum error threshold
Returns: True if the pattern is Butterfly. False otherwise.
isCrabPattern(xabRatio, abcRatio, bcdRatio, xadRatio, err_min, err_max) isCrabPattern: Checks for harmonic pattern Crab
Parameters:
xabRatio : AB/XA
abcRatio : BC/AB
bcdRatio : CD/BC
xadRatio : AD/XA
err_min : Minumum error threshold
err_max : Maximum error threshold
Returns: True if the pattern is Crab. False otherwise.
isDeepCrabPattern(xabRatio, abcRatio, bcdRatio, xadRatio, err_min, err_max) isDeepCrabPattern: Checks for harmonic pattern DeepCrab
Parameters:
xabRatio : AB/XA
abcRatio : BC/AB
bcdRatio : CD/BC
xadRatio : AD/XA
err_min : Minumum error threshold
err_max : Maximum error threshold
Returns: True if the pattern is DeepCrab. False otherwise.
isCypherPattern(xabRatio, axcRatio, xadRatio, err_min, err_max) isCypherPattern: Checks for harmonic pattern Cypher
Parameters:
xabRatio : AB/XA
axcRatio : XC/AX
xadRatio : AD/XA
err_min : Minumum error threshold
err_max : Maximum error threshold
Returns: True if the pattern is Cypher. False otherwise.
isSharkPattern(xabRatio, abcRatio, bcdRatio, xadRatio, err_min, err_max) isSharkPattern: Checks for harmonic pattern Shark
Parameters:
xabRatio : AB/XA
abcRatio : BC/AB
bcdRatio : CD/BC
xadRatio : AD/XA
err_min : Minumum error threshold
err_max : Maximum error threshold
Returns: True if the pattern is Shark. False otherwise.
isNenStarPattern(xabRatio, abcRatio, bcdRatio, xadRatio, err_min, err_max) isNenStarPattern: Checks for harmonic pattern Nenstar
Parameters:
xabRatio : AB/XA
abcRatio : BC/AB
bcdRatio : CD/BC
xadRatio : AD/XA
err_min : Minumum error threshold
err_max : Maximum error threshold
Returns: True if the pattern is Nenstar. False otherwise.
isAntiNenStarPattern(xabRatio, abcRatio, bcdRatio, xadRatio, err_min, err_max) isAntiNenStarPattern: Checks for harmonic pattern Anti NenStar
Parameters:
xabRatio : - AB/XA
abcRatio : - BC/AB
bcdRatio : - CD/BC
xadRatio : - AD/XA
err_min : - Minumum error threshold
err_max : - Maximum error threshold
Returns: True if the pattern is Anti NenStar. False otherwise.
isAntiSharkPattern(xabRatio, abcRatio, bcdRatio, xadRatio, err_min, err_max) isAntiSharkPattern: Checks for harmonic pattern Anti Shark
Parameters:
xabRatio : AB/XA
abcRatio : BC/AB
bcdRatio : CD/BC
xadRatio : AD/XA
err_min : Minumum error threshold
err_max : Maximum error threshold
Returns: True if the pattern is Anti Shark. False otherwise.
isAntiCypherPattern(xabRatio, abcRatio, bcdRatio, xadRatio, err_min, err_max) isAntiCypherPattern: Checks for harmonic pattern Anti Cypher
Parameters:
xabRatio : AB/XA
abcRatio : BC/AB
bcdRatio : CD/BC
xadRatio : AD/XA
err_min : Minumum error threshold
err_max : Maximum error threshold
Returns: True if the pattern is Anti Cypher. False otherwise.
isAntiCrabPattern(xabRatio, abcRatio, bcdRatio, xadRatio, err_min, err_max) isAntiCrabPattern: Checks for harmonic pattern Anti Crab
Parameters:
xabRatio : AB/XA
abcRatio : BC/AB
bcdRatio : CD/BC
xadRatio : AD/XA
err_min : Minumum error threshold
err_max : Maximum error threshold
Returns: True if the pattern is Anti Crab. False otherwise.
isAntiButterflyPattern(xabRatio, abcRatio, bcdRatio, xadRatio, err_min, err_max) isAntiButterflyPattern: Checks for harmonic pattern Anti Butterfly
Parameters:
xabRatio : AB/XA
abcRatio : BC/AB
bcdRatio : CD/BC
xadRatio : AD/XA
err_min : Minumum error threshold
err_max : Maximum error threshold
Returns: True if the pattern is Anti Butterfly. False otherwise.
isAntiBatPattern(xabRatio, abcRatio, bcdRatio, xadRatio, err_min, err_max) isAntiBatPattern: Checks for harmonic pattern Anti Bat
Parameters:
xabRatio : AB/XA
abcRatio : BC/AB
bcdRatio : CD/BC
xadRatio : AD/XA
err_min : Minumum error threshold
err_max : Maximum error threshold
Returns: True if the pattern is Anti Bat. False otherwise.
isAntiGartleyPattern(xabRatio, abcRatio, bcdRatio, xadRatio, err_min, err_max) isAntiGartleyPattern: Checks for harmonic pattern Anti Gartley
Parameters:
xabRatio : AB/XA
abcRatio : BC/AB
bcdRatio : CD/BC
xadRatio : AD/XA
err_min : Minumum error threshold
err_max : Maximum error threshold
Returns: True if the pattern is Anti Gartley. False otherwise.
isNavarro200Pattern(xabRatio, abcRatio, bcdRatio, xadRatio, err_min, err_max) isNavarro200Pattern: Checks for harmonic pattern Navarro200
Parameters:
xabRatio : AB/XA
abcRatio : BC/AB
bcdRatio : CD/BC
xadRatio : AD/XA
err_min : Minumum error threshold
err_max : Maximum error threshold
Returns: True if the pattern is Navarro200. False otherwise.
isHarmonicPattern(x, a, c, c, d, flags, errorPercent) isHarmonicPattern: Checks for harmonic patterns
Parameters:
x : X coordinate value
a : A coordinate value
c : B coordinate value
c : C coordinate value
d : D coordinate value
flags : flags to check patterns. Send empty array to enable all
errorPercent : Error threshold
Returns: Array of boolean values which says whether valid pattern exist and array of corresponding pattern names
FunctionCosineSimilarityLibrary "FunctionCosineSimilarity"
Cosine Similarity method.
function(sample_a, sample_b) Measure the similarity of 2 vectors.
Parameters:
sample_a : float array, values.
sample_b : float array, values.
Returns: float.
diss(cosim) Dissimilarity helper function.
Parameters:
cosim : float, cosine similarity value (0 > 1)
Returns: float

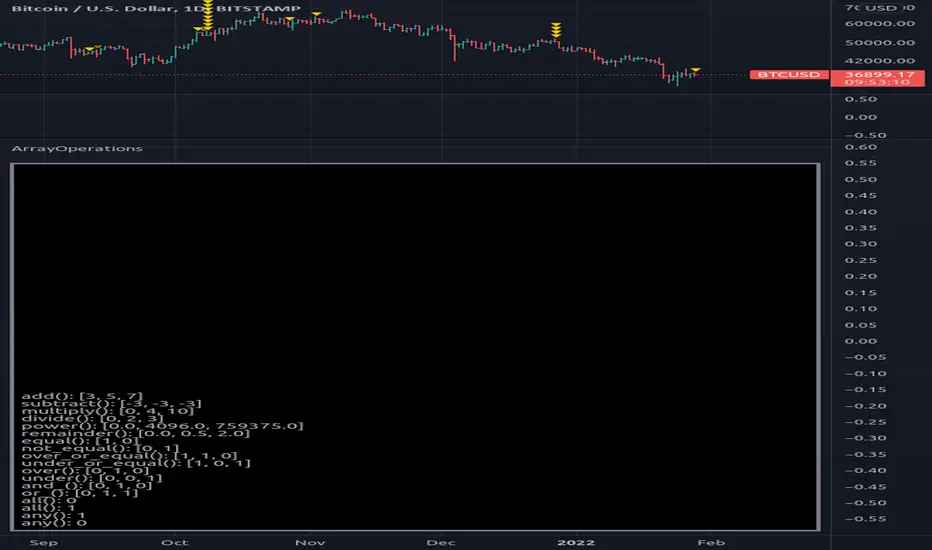
ArrayOperationsLibrary "ArrayOperations"
Array element wise basic operations.
add(sample_a, sample_b) Adds sample_b to sample_a and returns a new array.
Parameters:
sample_a : values to be added to.
sample_b : values to add.
Returns: array with added results.
- sample_a provides type format for output.
- arrays do not need to be symmetric.
- sample_a must have same or more elements than sample_b
subtract(sample_a, sample_b) Subtracts sample_b from sample_a and returns a new array.
sample_a : values to be subtracted from.
sample_b : values to subtract.
Returns: array with subtracted results.
- sample_a provides type format for output.
- arrays do not need to be symmetric.
- sample_a must have same or more elements than sample_b
multiply(sample_a, sample_b) multiply sample_a by sample_b and returns a new array.
sample_a : values to multiply.
sample_b : values to multiply with.
Returns: array with multiplied results.
- sample_a provides type format for output.
- arrays do not need to be symmetric.
- sample_a must have same or more elements than sample_b
divide(sample_a, sample_b) Divide sample_a by sample_b and returns a new array.
sample_a : values to divide.
sample_b : values to divide with.
Returns: array with divided results.
- sample_a provides type format for output.
- arrays do not need to be symmetric.
- sample_a must have same or more elements than sample_b
power(sample_a, sample_b) power sample_a by sample_b and returns a new array.
sample_a : values to power.
sample_b : values to power with.
Returns: float array with power results.
- sample_a provides type format for output.
- arrays do not need to be symmetric.
- sample_a must have same or more elements than sample_b
remainder(sample_a, sample_b) Remainder sample_a by sample_b and returns a new array.
sample_a : values to remainder.
sample_b : values to remainder with.
Returns: array with remainder results.
- sample_a provides type format for output.
- arrays do not need to be symmetric.
- sample_a must have same or more elements than sample_b
equal(sample_a, sample_b) Check element wise sample_a equals sample_b and returns a new array.
sample_a : values to check.
sample_b : values to check.
Returns: int array with results.
- sample_a provides type format for output.
- arrays do not need to be symmetric.
- sample_a must have same or more elements than sample_b
not_equal(sample_a, sample_b) Check element wise sample_a not equals sample_b and returns a new array.
sample_a : values to check.
sample_b : values to check.
Returns: int array with results.
- sample_a provides type format for output.
- arrays do not need to be symmetric.
- sample_a must have same or more elements than sample_b
over_or_equal(sample_a, sample_b) Check element wise sample_a over or equals sample_b and returns a new array.
sample_a : values to check.
sample_b : values to check.
Returns: int array with results.
- sample_a provides type format for output.
- arrays do not need to be symmetric.
- sample_a must have same or more elements than sample_b
under_or_equal(sample_a, sample_b) Check element wise sample_a under or equals sample_b and returns a new array.
sample_a : values to check.
sample_b : values to check.
Returns: int array with results.
- sample_a provides type format for output.
- arrays do not need to be symmetric.
- sample_a must have same or more elements than sample_b
over(sample_a, sample_b) Check element wise sample_a over sample_b and returns a new array.
sample_a : values to check.
sample_b : values to check.
Returns: int array with results.
- sample_a provides type format for output.
- arrays do not need to be symmetric.
- sample_a must have same or more elements than sample_b
under(sample_a, sample_b) Check element wise sample_a under sample_b and returns a new array.
sample_a : values to check.
sample_b : values to check.
Returns: int array with results.
- sample_a provides type format for output.
- arrays do not need to be symmetric.
- sample_a must have same or more elements than sample_b
and_(sample_a, sample_b) Check element wise sample_a and sample_b and returns a new array.
sample_a : values to check.
sample_b : values to check.
Returns: int array with results.
- sample_a provides type format for output.
- arrays do not need to be symmetric.
- sample_a must have same or more elements than sample_b
or_(sample_a, sample_b) Check element wise sample_a or sample_b and returns a new array.
sample_a : values to check.
sample_b : values to check.
Returns: int array with results.
- sample_a provides type format for output.
- arrays do not need to be symmetric.
- sample_a must have same or more elements than sample_b
all(sample) Check element wise if all numeric samples are true (!= 0).
sample : values to check.
Returns: int.
any(sample) Check element wise if any numeric samples are true (!= 0).
sample : values to check.
Returns: int.
WIPNNetworkLibrary "WIPNNetwork"
this is a work in progress (WIP) and prone to have some errors, so use at your own risk...
let me know if you find any issues..
Method for a generalized Neural Network.
network(x) Generalized Neural Network Method.
Parameters:
x : TODO: add parameter x description here
Returns: TODO: add what function returns

FunctionPatternDecompositionLibrary "FunctionPatternDecomposition"
Methods for decomposing price into common grid/matrix patterns.
series_to_array(source, length) Helper for converting series to array.
Parameters:
source : float, data series.
length : int, size.
Returns: float array.
smooth_data_2d(data, rate) Smooth data sample into 2d points.
Parameters:
data : float array, source data.
rate : float, default=0.25, the rate of smoothness to apply.
Returns: tuple with 2 float arrays.
thin_points(data_x, data_y, rate) Thin the number of points.
Parameters:
data_x : float array, points x value.
data_y : float array, points y value.
rate : float, default=2.0, minimum threshold rate of sample stdev to accept points.
Returns: tuple with 2 float arrays.
extract_point_direction(data_x, data_y) Extract the direction each point faces.
Parameters:
data_x : float array, points x value.
data_y : float array, points y value.
Returns: float array.
find_corners(data_x, data_y, rate) ...
Parameters:
data_x : float array, points x value.
data_y : float array, points y value.
rate : float, minimum threshold rate of data y stdev.
Returns: tuple with 2 float arrays.
grid_coordinates(data_x, data_y, m_size) transforms points data to a constrained sized matrix format.
Parameters:
data_x : float array, points x value.
data_y : float array, points y value.
m_size : int, default=10, size of the matrix.
Returns: flat 2d pseudo matrix.

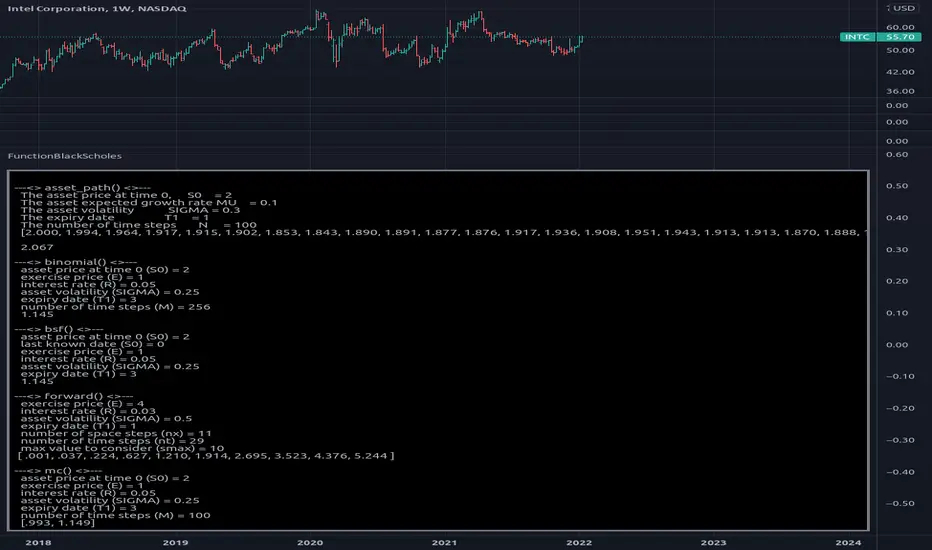
FunctionBlackScholesLibrary "FunctionBlackScholes"
Some methods for the Black Scholes Options Model, which demonstrates several approaches to the valuation of a European call.
// reference:
// people.math.sc.edu
// people.math.sc.edu
asset_path(s0, mu, sigma, t1, n) Simulates the behavior of an asset price over time.
Parameters:
s0 : float, asset price at time 0.
mu : float, growth rate.
sigma : float, volatility.
t1 : float, time to expiry date.
n : int, time steps to expiry date.
Returns: option values at each equal timed step (0 -> t1)
binomial(s0, e, r, sigma, t1, m) Uses the binomial method for a European call.
Parameters:
s0 : float, asset price at time 0.
e : float, exercise price.
r : float, interest rate.
sigma : float, volatility.
t1 : float, time to expiry date.
m : int, time steps to expiry date.
Returns: option value at time 0.
bsf(s0, t0, e, r, sigma, t1) Evaluates the Black-Scholes formula for a European call.
Parameters:
s0 : float, asset price at time 0.
t0 : float, time at which the price is known.
e : float, exercise price.
r : float, interest rate.
sigma : float, volatility.
t1 : float, time to expiry date.
Returns: option value at time 0.
forward(e, r, sigma, t1, nx, nt, smax) Forward difference method to value a European call option.
Parameters:
e : float, exercise price.
r : float, interest rate.
sigma : float, volatility.
t1 : float, time to expiry date.
nx : int, number of space steps in interval (0, L).
nt : int, number of time steps.
smax : float, maximum value of S to consider.
Returns: option values for the european call, float array of size ((nx-1) * (nt+1)).
mc(s0, e, r, sigma, t1, m) Uses Monte Carlo valuation on a European call.
Parameters:
s0 : float, asset price at time 0.
e : float, exercise price.
r : float, interest rate.
sigma : float, volatility.
t1 : float, time to expiry date.
m : int, time steps to expiry date.
Returns: confidence interval for the estimated range of valuation.
ArrayExtLibrary "ArrayExt"
Array extensions
get(a, idx) Get element from the array at index, or na if index not found
Parameters:
a : The array
idx : The array index to get
Returns: The array item if exists or na
get(a, idx) Get element from the array at index, or na if index not found
Parameters:
a : The array
idx : The array index to get
Returns: The array item if exists or na
get(a, idx) Get element from the array at index, or na if index not found
Parameters:
a : The array
idx : The array index to get
Returns: The array item if exists or na
get(a, idx) Get element from the array at index, or na if index not found
Parameters:
a : The array
idx : The array index to get
Returns: The array item if exists or na
get(a, idx) Get element from the array at index, or na if index not found
Parameters:
a : The array
idx : The array index to get
Returns: The array item if exists or na
get(a, idx) Get element from the array at index, or na if index not found
Parameters:
a : The array
idx : The array index to get
Returns: The array item if exists or na
set(a, idx, val) Set array item at index, if array has no index at the specified index, the array is filled with na
Parameters:
a : The array
idx : The array index to set
val : The value to be set
set(a, idx, val) Set array item at index, if array has no index at the specified index, the array is filled with na
Parameters:
a : The array
idx : The array index to set
val : The value to be set
set(a, idx, val) Set array item at index, if array has no index at the specified index, the array is filled with na
Parameters:
a : The array
idx : The array index to set
val : The value to be set
set(a, idx, val) Set array item at index, if array has no index at the specified index, the array is filled with na
Parameters:
a : The array
idx : The array index to set
val : The value to be set
set(a, idx, val) Set array item at index, if array has no index at the specified index, the array is filled with na
Parameters:
a : The array
idx : The array index to set
val : The value to be set
set(a, idx, val) Set array item at index, if array has no index at the specified index, the array is filled with na
Parameters:
a : The array
idx : The array index to set
val : The value to be set

FunctionMinkowskiDistanceLibrary "FunctionMinkowskiDistance"
Method for Minkowski Distance,
The Minkowski distance or Minkowski metric is a metric in a normed vector space
which can be considered as a generalization of both the Euclidean distance and
the Manhattan distance.
It is named after the German mathematician Hermann Minkowski.
reference: en.wikipedia.org
double(point_ax, point_ay, point_bx, point_by, p_value) Minkowsky Distance for single points.
Parameters:
point_ax : float, x value of point a.
point_ay : float, y value of point a.
point_bx : float, x value of point b.
point_by : float, y value of point b.
p_value : float, p value, default=1.0(1: manhatan, 2: euclidean), does not support chebychev.
Returns: float
ndim(point_x, point_y, p_value) Minkowsky Distance for N dimensions.
Parameters:
point_x : float array, point x dimension attributes.
point_y : float array, point y dimension attributes.
p_value : float, p value, default=1.0(1: manhatan, 2: euclidean), does not support chebychev.
Returns: float

globalCurrently in PineScript you cannot modify global variables in functions because of scope limitations.
One way to work around that is to use arrays.
This Library simplifies the use of arrays as global variables to make your code look cleaner.
If you're coming from other programming languages, I'm sure you will come across this issue in your PineScript journey at some point.
------------------------------------
The code below will throw an error that says: Cannot modify global variable 'price' in function.
var price = 0.0
function() =>
price := 5.5
------------------------------------
To work around that you can do:
var price = array.new_float(1, 0.0)
function() =>
array.set(price, 0, 5.5)
But that code does not spark joy.
------------------------------------
So I bring to you the global library:
import marspumpkin/global/1
var price = global.init(0.0)
function() =>
global.set(price, 5.5)
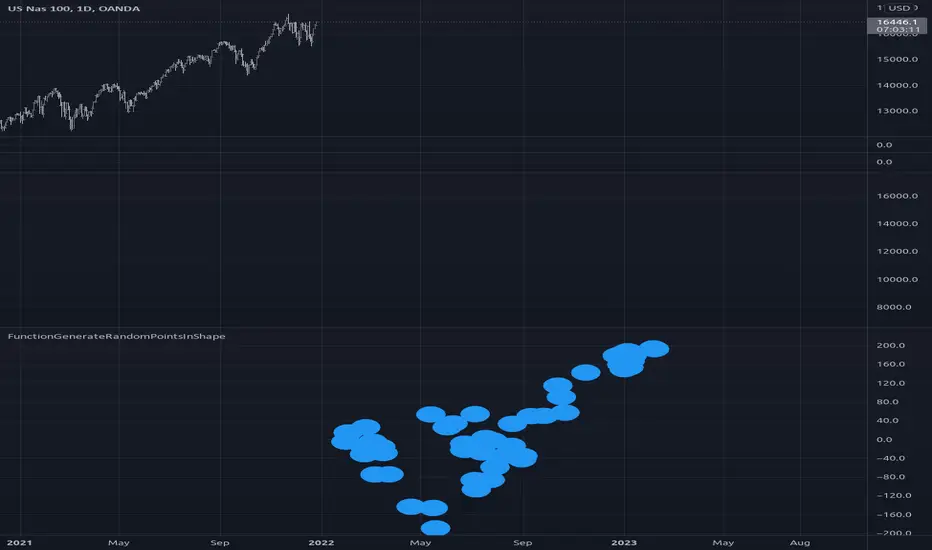
FunctionGenerateRandomPointsInShapeLibrary "FunctionGenerateRandomPointsInShape"
Generate random vector points in geometric shape (parallelogram, triangle)
random_parallelogram(vector_a, vector_b) Generate random vector point in a parallelogram shape.
Parameters:
vector_a : float array, vector of (x, y) shape.
vector_b : float array, vector of (x, y) shape.
Returns: float array, vector of (x, y) shape.
random_triangle(vector_a, vector_b) Generate random vector point in a triangle shape.
Parameters:
vector_a : float array, vector of (x, y) shape.
vector_b : float array, vector of (x, y) shape.
Returns: float array, vector of (x, y) shape.
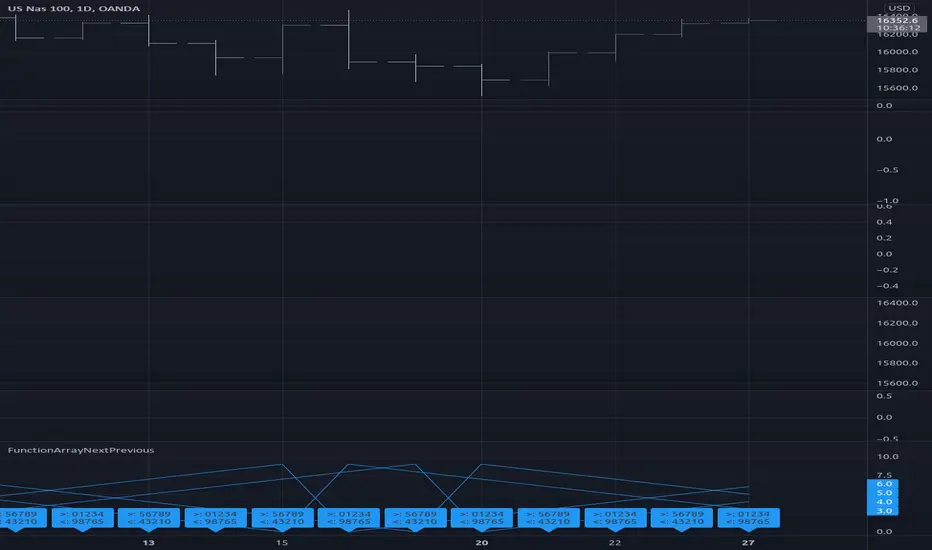
FunctionArrayNextPreviousLibrary "FunctionArrayNextPrevious"
Methods to iterate through a array by a fixed anchor point.
array_next(array, start_index) retrieves the next value of the internal pointer index.
Parameters:
array : (any array type), array to iterate.
start_index : int, anchor index to start indexing.
array_previous(array, start_index) retrieves the previous value of the internal pointer index.
Parameters:
array : (any array type), array to iterate.
start_index : int, anchor index to start indexing.
note: regrettably is not possible to have global reference index without juggling it in the parameters and tracking it externally to switch between next/previous
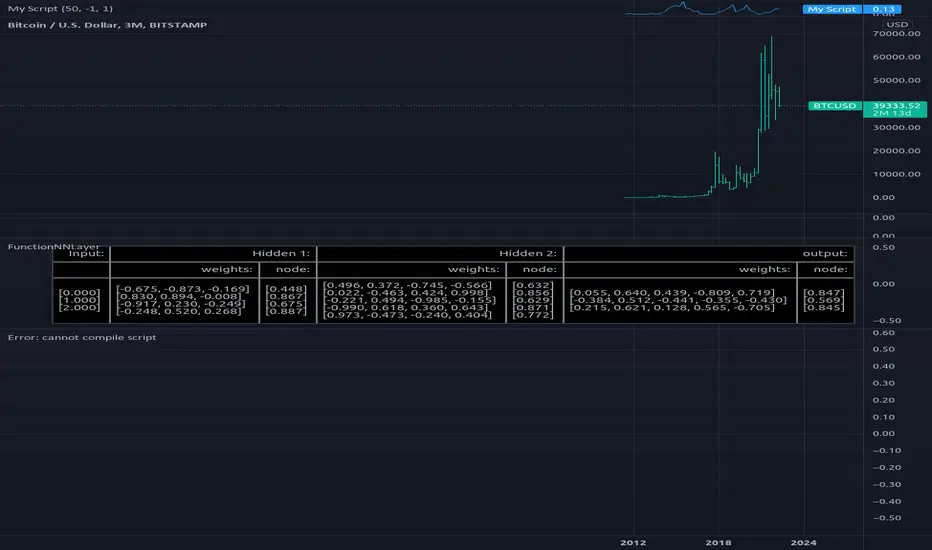
FunctionNNLayerLibrary "FunctionNNLayer"
Generalized Neural Network Layer method.
function(inputs, weights, n_nodes, activation_function, bias, alpha, scale) Generalized Layer.
Parameters:
inputs : float array, input values.
weights : float array, weight values.
n_nodes : int, number of nodes in layer.
activation_function : string, default='sigmoid', name of the activation function used.
bias : float, default=1.0, bias to pass into activation function.
alpha : float, default=na, if required to pass into activation function.
scale : float, default=na, if required to pass into activation function.
Returns: float
FunctionNNPerceptronLibrary "FunctionNNPerceptron"
Perceptron Function for Neural networks.
function(inputs, weights, bias, activation_function, alpha, scale) generalized perceptron node for Neural Networks.
Parameters:
inputs : float array, the inputs of the perceptron.
weights : float array, the weights for inputs.
bias : float, default=1.0, the default bias of the perceptron.
activation_function : string, default='sigmoid', activation function applied to the output.
alpha : float, default=na, if required for activation.
scale : float, default=na, if required for activation.
@outputs float

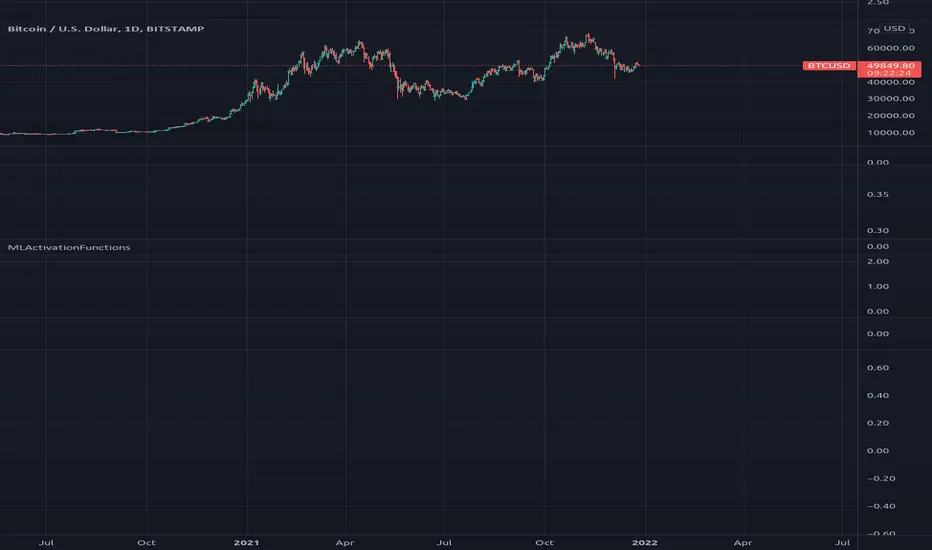
MLActivationFunctionsLibrary "MLActivationFunctions"
Activation functions for Neural networks.
binary_step(value) Basic threshold output classifier to activate/deactivate neuron.
Parameters:
value : float, value to process.
Returns: float
linear(value) Input is the same as output.
Parameters:
value : float, value to process.
Returns: float
sigmoid(value) Sigmoid or logistic function.
Parameters:
value : float, value to process.
Returns: float
sigmoid_derivative(value) Derivative of sigmoid function.
Parameters:
value : float, value to process.
Returns: float
tanh(value) Hyperbolic tangent function.
Parameters:
value : float, value to process.
Returns: float
tanh_derivative(value) Hyperbolic tangent function derivative.
Parameters:
value : float, value to process.
Returns: float
relu(value) Rectified linear unit (RELU) function.
Parameters:
value : float, value to process.
Returns: float
relu_derivative(value) RELU function derivative.
Parameters:
value : float, value to process.
Returns: float
leaky_relu(value) Leaky RELU function.
Parameters:
value : float, value to process.
Returns: float
leaky_relu_derivative(value) Leaky RELU function derivative.
Parameters:
value : float, value to process.
Returns: float
relu6(value) RELU-6 function.
Parameters:
value : float, value to process.
Returns: float
softmax(value) Softmax function.
Parameters:
value : float array, values to process.
Returns: float
softplus(value) Softplus function.
Parameters:
value : float, value to process.
Returns: float
softsign(value) Softsign function.
Parameters:
value : float, value to process.
Returns: float
elu(value, alpha) Exponential Linear Unit (ELU) function.
Parameters:
value : float, value to process.
alpha : float, default=1.0, predefined constant, controls the value to which an ELU saturates for negative net inputs. .
Returns: float
selu(value, alpha, scale) Scaled Exponential Linear Unit (SELU) function.
Parameters:
value : float, value to process.
alpha : float, default=1.67326324, predefined constant, controls the value to which an SELU saturates for negative net inputs. .
scale : float, default=1.05070098, predefined constant.
Returns: float
exponential(value) Pointer to math.exp() function.
Parameters:
value : float, value to process.
Returns: float
function(name, value, alpha, scale) Activation function.
Parameters:
name : string, name of activation function.
value : float, value to process.
alpha : float, default=na, if required.
scale : float, default=na, if required.
Returns: float
derivative(name, value, alpha, scale) Derivative Activation function.
Parameters:
name : string, name of activation function.
value : float, value to process.
alpha : float, default=na, if required.
scale : float, default=na, if required.
Returns: float
MLLossFunctionsLibrary "MLLossFunctions"
Methods for Loss functions.
mse(expects, predicts) Mean Squared Error (MSE) " MSE = 1/N * sum ((y - y')^2) ".
Parameters:
expects : float array, expected values.
predicts : float array, prediction values.
Returns: float
binary_cross_entropy(expects, predicts) Binary Cross-Entropy Loss (log).
Parameters:
expects : float array, expected values.
predicts : float array, prediction values.
Returns: float