Volume HighlighterHighlight Candles or Volume Bars when volume breaks through the Moving Average, without volume obscuring your chart or candles! Also set an alert when volume breaks through its moving average! 1) Create an alert, 2) Select "Volume Highlighter" from the Alert Condition dropdown box, 3) select "Volume Bars" from the second dropdown, and 4) select "Volume MA Breakthrough" from the third dropdown.
Normal:
Choice of Highlighting Volume Bars and/or Candles on the chart:
Enjoy.
~jdhadwin
Sma

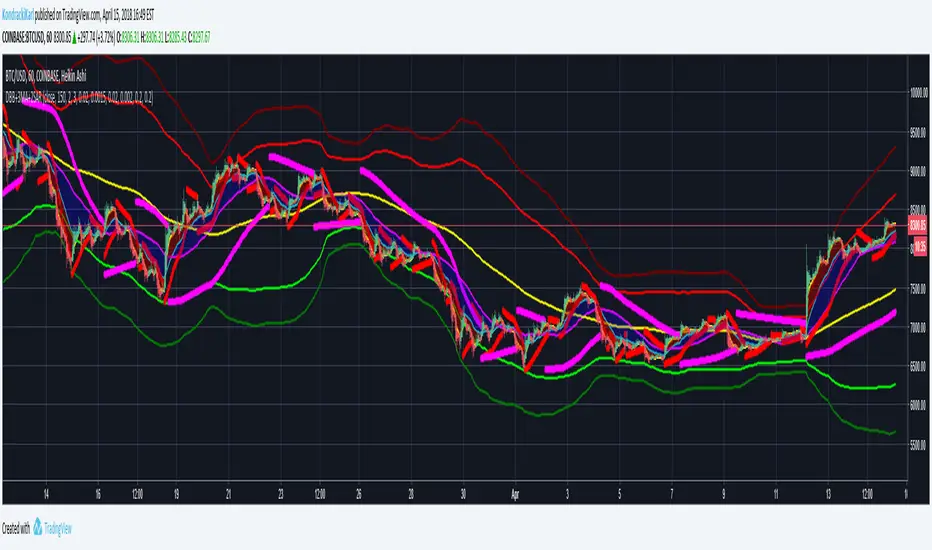
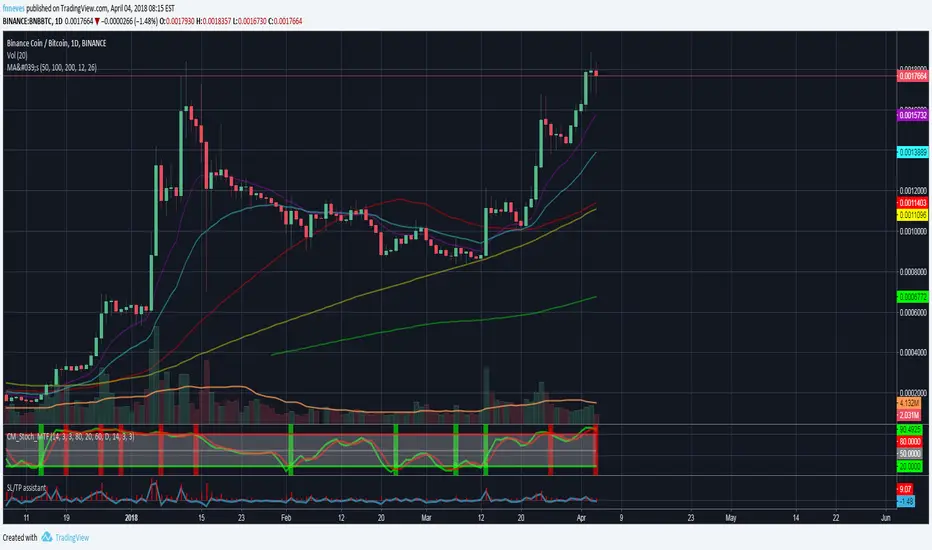
Double Bands, 3MA and 2SARMoving Averages (5,20,50), Double BollHello
Made an indicator set that includes
Moving Averages 5EMA, 20EMA, 50SMA, 200SMA
Fill between 5-20 MA and 20-50MA
Double Bollinger Bands
Parabolic SAR x2
Multiple indicators for the cost of 1
Dual Timeframe SMA Ribbon Crossover Backtest// Backtesting Dual SMA Ribbon Crossover Strategy
// see f.bpcdn.co
// including time limiting
Turned this study into a backtest.
Moving Averages (10, 55, 100 EMAs, 200 SMA close)10, 55, 100 EMAs, 200 SMA close. Increasing line stroke, standard colors.

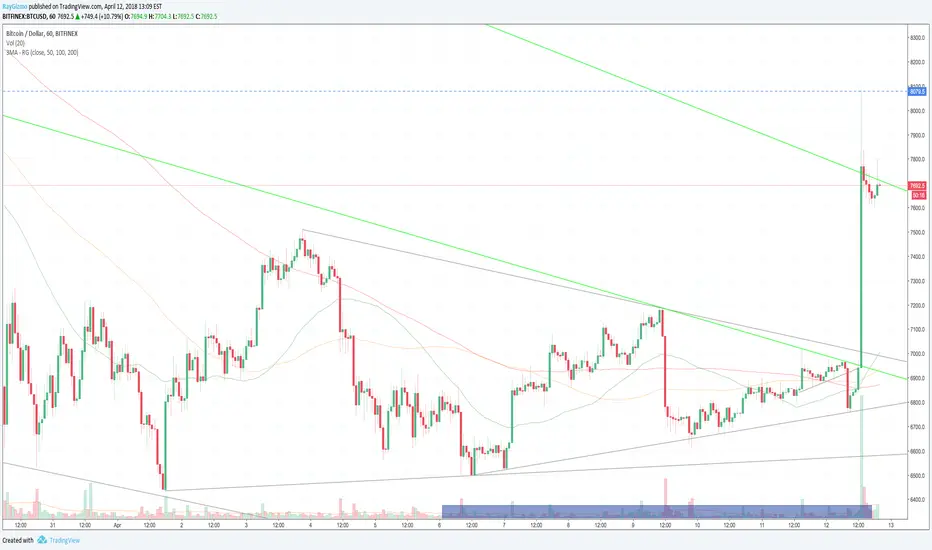
Poloniex 30 EMA & 50 SMA StrategyWorking great on higher timeframes! Best is to check performance for certain timeframe and then trade on the signals, so far 4H-24H range works best. 9H had best performance on MAIDBTC, but seems lower Timeframes doing well too on BTCUSD. Just check under performance and try it out! :)

5MAShowing Multiple Moving Averages (5 MAs) in one 1 indicator. Very useful if you're still using free version of Trading View

5 Moving AveragesShowing Multiple Moving Averages (5 MAs) in one 1 indicator. Very useful if you're still using free version of Trading View

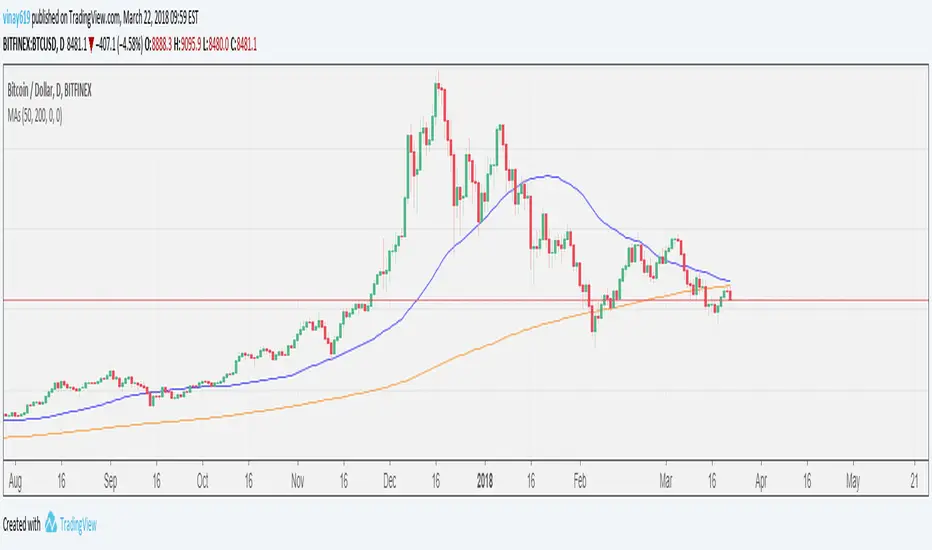
Triple Moving Averages - 50ema w/ 100sma & 200sma1st moving average is a Exponential Moving Average - designed to show short-term and medium-term trend quickly
2nd moving average is a Simple Moving Average - designed to show medium-term trend and less susceptible to fakeouts
3rd moving average is a long Simple Moving Average - designed to show the long-term trend and overall trend of the instrument


ALL in One - MA'sSimple indicator with 3 SMA's and 2 EMA's.
Very useful if you like using several indicators but don't have a subscription!
Red, Yellow, Red -> SMA's
Purple, Blue -> EMA's
Feel free to customize the colors/widths!
[MV] %B with SMA + Volume Based Colored Bars
Entry Signal when %B Crosses with SMA and this is more meaningful if it supports colored bars.
Black Bar when prices go down and volume is bigger than 150% of its average, that indicates us price action is supported by a strong bearish volume
Blue Bar when prices go up and volume bigger than 150% of its average, that indicates us price action is supported by a strong bullish volume
VBC author @KIVANCfr3762

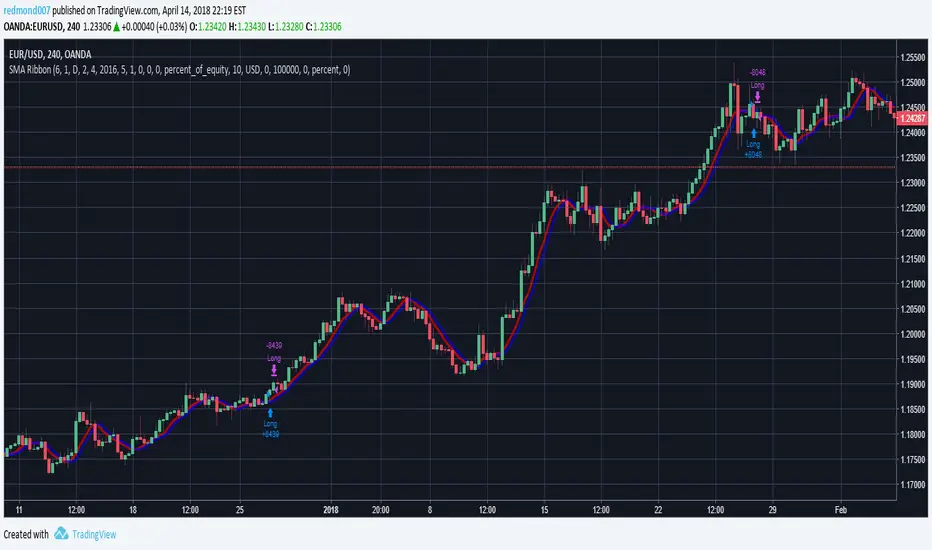
Dual Timeframe SMA Ribbon CrossoverCopyright by RJ 3/2018
Should be used with lower timeframe and higher timeframe charts
First set your chart to the lower timeframe you'd like to analyze
see f.bpcdn.co
For this method, low timeframe/high suitable timeframe pairs are:
5min with 30min parent
15min with 1hr parent
30min with 4hr parent
4hr with daily parent
daily with weekly parent
weekly with monthly parent
On lower timeframe chart - Plot of 2 smas length 6, 1 Offset
If smas cross - and bar crosses the sma convergence, and full body of bar crosses SMAs - then this is a buy or sell opportunity
For confirmation - on the higher timeframe chart, check if bar is above or below the smas for that day

Moving Averages (gotta plot them all!)The length of the lookback period and the type of moving average can be changed in the inputs tab of the indicator.
The type of moving average can be selected from:
Simple Moving Averages
Exponential Moving Averages
Symmetrically Weighted Moving Average
Weighted Moving Averages
Volume-weighted Moving Averages
Moving average used in RSI
Arnaud Legoux Moving Averages
The source of prices to use in the calculation can be selected from:
close
open
high
low
(high + low + close + open)/4
(high + low)/2
(high + low + close)/3
Line-weight and colours can be edited in the style tab of the indicator.
The default is to plot the SMAs using a length of 20, 50, 100 and 200.
A simpler version of this script is available here:

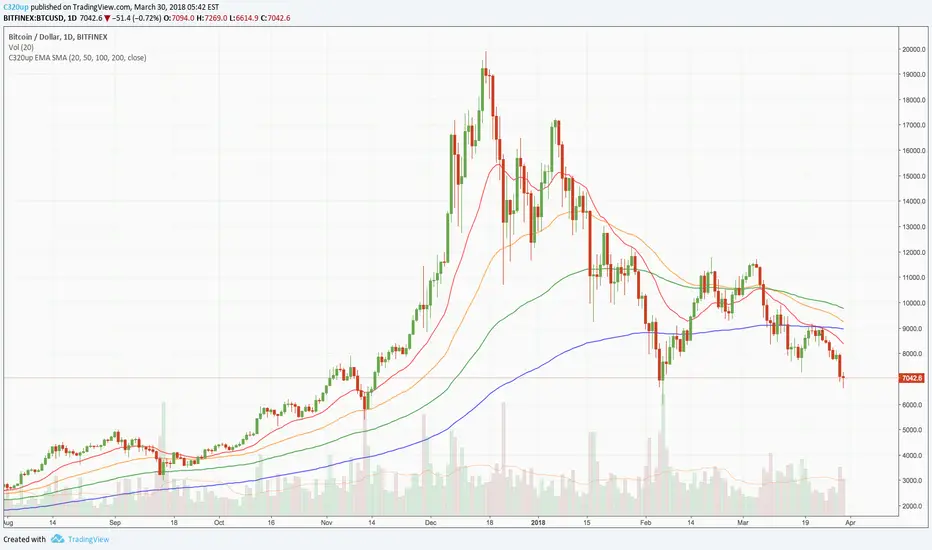
C320up Moving Average Exponential or Simple with 4 LinesC320up EMA SMA
Eight indicators in one.
You can set four of your favourite EMA’s or SMA’s or both on the screen at once, or set just one.
Easily switch between EMA or SMA and display as many or little as you want.
Default settings are 20, 50, 100, and 200 EMA’s.
You can switch them on or off individually and change the colours to suit your preferences.
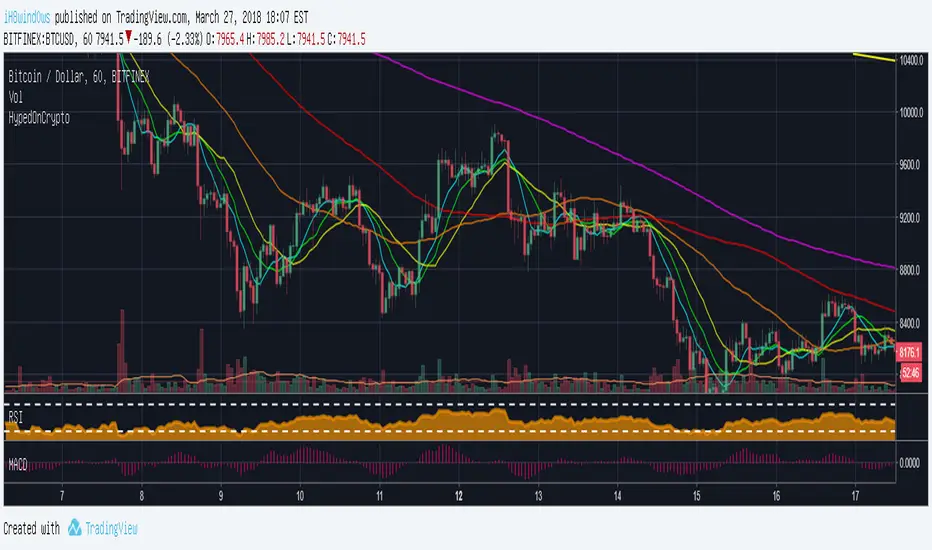
Six Simple Moving Averages by HypedOnCrypto For those who use the free version and want to use more than 3 moving averages.
I wish you all a good Trade.
Triple Moving AverageTriple moving average with customizable MA lengths, MA types (SMA (default), EMA, WMA).
Show 3 MA disables the default plots.
Show 6 plots 3 SMA (default) and 3 EMA. The EMA plots are light colors to be subtle and non-cluttering. Disabled by default. These plots act independent of other options.
Toggle 3/2 will display 3 MAs (default) or 2 MAs (unchecked).
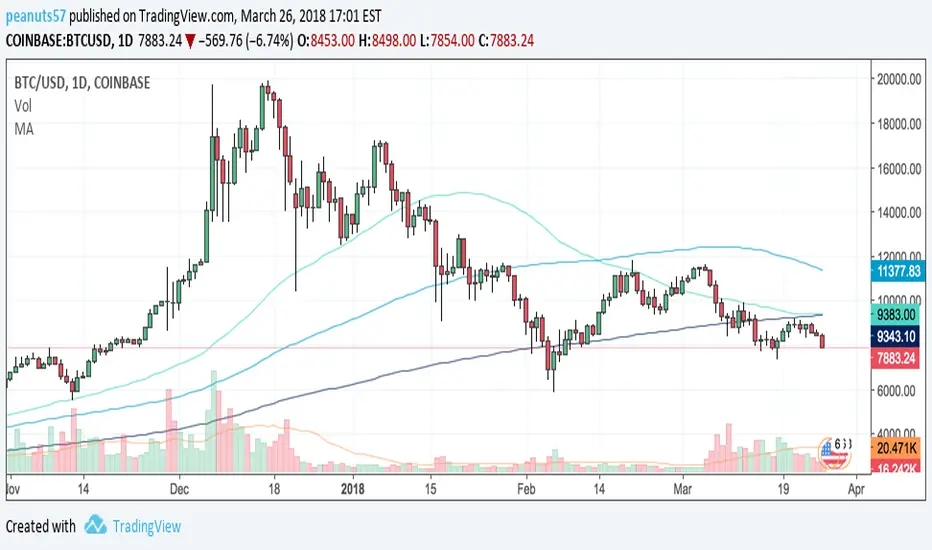
Moving Averages (SMA and EMA)Plot the simple moving averages (SMA) and/or exponential moving averages (EMA).
The length of the lookback period and the type of moving average can be changed in the inputs tab of the indicator.
Line-weight and colours can be edited in the style tab of the indicator.
The default is to plot the SMAs using a length of 20, 50, 100 and 200.

Kozlod - 3MA strategy with SL/PT (7 MA types)Classic 3 MA strategy.
Long - Short MA crossover Medium MA and cross is above Long MA
Short - Short MA crossunder Medium MA and cross is below Long MA
You can choose one of these MA types in params:
Simple Moving Average ( SMA )
Exponential Moving Average ( EMA )
Weighted Moving Average ( WMA )
Hull Moving Average ( HMA )
Volume-weighted Moving Average ( VWMA )
Smoothed Moving Average ( SMMA )
Double Exponential Moving Average ( DEMA )
You can select SL/PT % levels.

Four Moving Averagesa moving average script that will plot 4 moving averages (with a single indicator), and you can toggle between EMA and SMA
Colours are chosen from ColorBrewer by Cyhnthia github.com

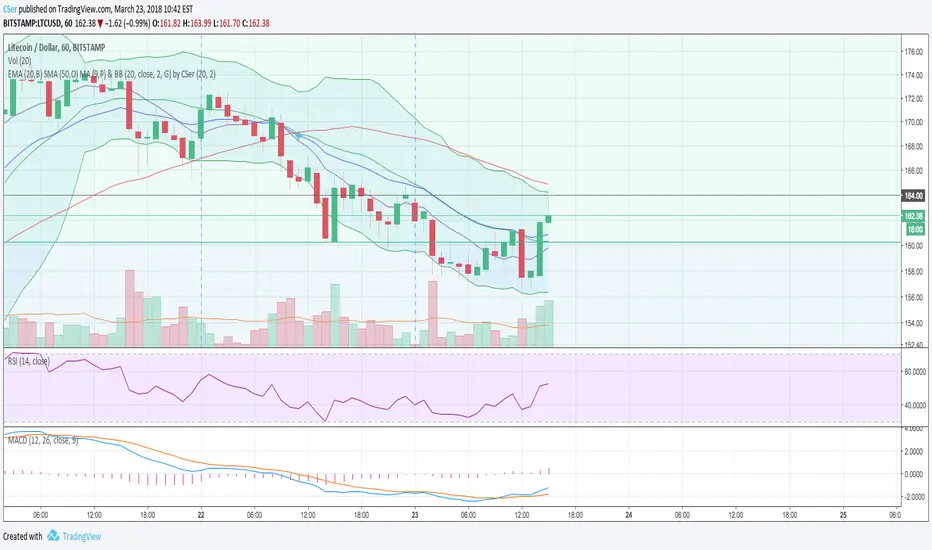
Moving Averages & Bollinger Bands by CSerCombination of Bollinger Bands (20, close, 2) and EMA (20), SMA (50) and the default MA (9) with the addition of crosses for EMA and SMA for quick decisions. Let me know your thoughts, corrections and/or additions.
Multiple Moving Averages - UnclutteringFeatures
- 4 MAs in one indicator
- User changeable period for each MA
- SMA/EMA user selectable option for each MA
- Source is set to close and cannot be changed.