Bitazu MA 10,20Displays 10, 20 MAs on a single indicator.
Useful for Crypto trading and reduced the number of indicators needed to view multiple MAs
When shorter MA crosses over the longer it's a good sign of Bullish/Bearish reversal.
This sentiment is more true at longer timeframes, such as daily candles, as the trend has more momentum.
Sma

Multiple customizable MA own timeresolution own MA-typeMultiple (8) customizable MA
Features:
Set MA-Type/Smoothing: "RMA", "SMA", "EMA", "WMA", "VWMA"
Set Timeframe/Resolution: "60", "240", "1D", "1W", "1M", "Chart"
To use the native chart time resolution select "Chart" as TimeFrame

Moving Averages & Bollinger Bands3 Moving Averages and Bollinger Bands in 1 Indicator
SMA or EMA
Exponential Bollinger Bands available
Turn bands on or off
Customize period length and standard deviations
Momentum Oscillators [CP]This is collection of 3 Momentum Oscillators:
*RSI
*Stochastic
*SRSI
You can filter each one with the following options:
*SMA
*EMA
*Hull MA
*Linear Regression
*Laguerre
*SuperSmoother
*SuperSmoother

ProfitTrailer Example TradingView Signals [v2019-01-31]ProfitTrailer Example TradingView Signal
This script provides an example of a TradingView Signal for use with ProfitTrailer's
new SIGNALS functionality and it's new TradingView integration capability.
This signals script implements a simple Moving Average Cross strategy
that works on any chart timeframe.
It allows you to pick the Price source i.e. Open, Close (default), etc.
You are able to choose between EMA (default) or SMA moving average
calculations.
You can define the fast and slow period lengths for use within the
moving average calculations.
If you get some value out of this indicator please consider making
a small donation to my favourite charity the Save the Childrens Fund.
Every donation will make a difference to the lives of children.
All donations over $2 are tax deductable. You can donate here:
savethechildrenfundraising.org.au
Copyright (c) 2019, Grant Cause aka CryptoCoyns

Alberto - Strategy 1A multi-timeframe strategy developed as a custom service.
Note
This strategy has been published only for customer verification and acceptance. Sorry, I cannot grant access to anyone else.

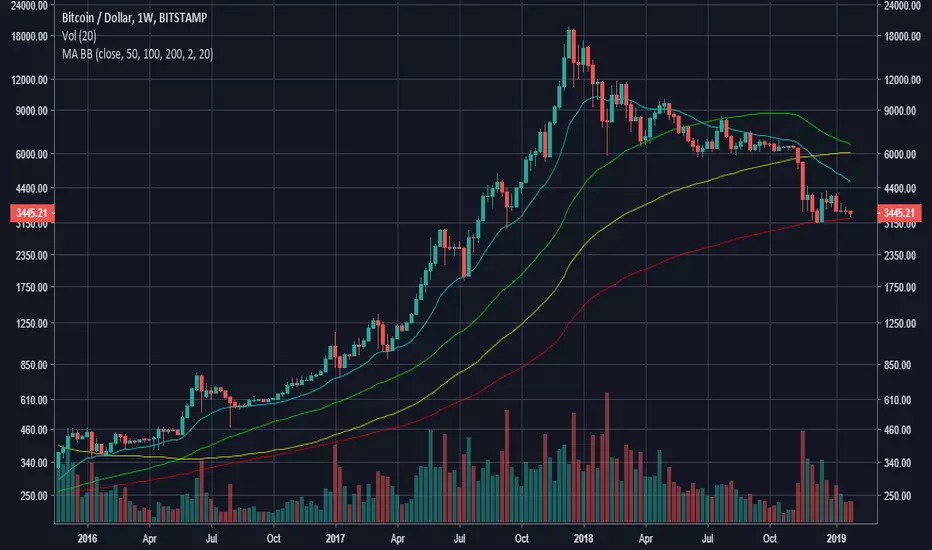
Bitstamp BTC Horizontal 200 Week SMAsmall change to my horizontal 200 week SMA script.
Plots the latest 200 week SMA value from Bitstamp BTCUSD on the chart. I use it for the Bitmex chart, as Bitmex doesn't have enough history for a 200 week moving average.

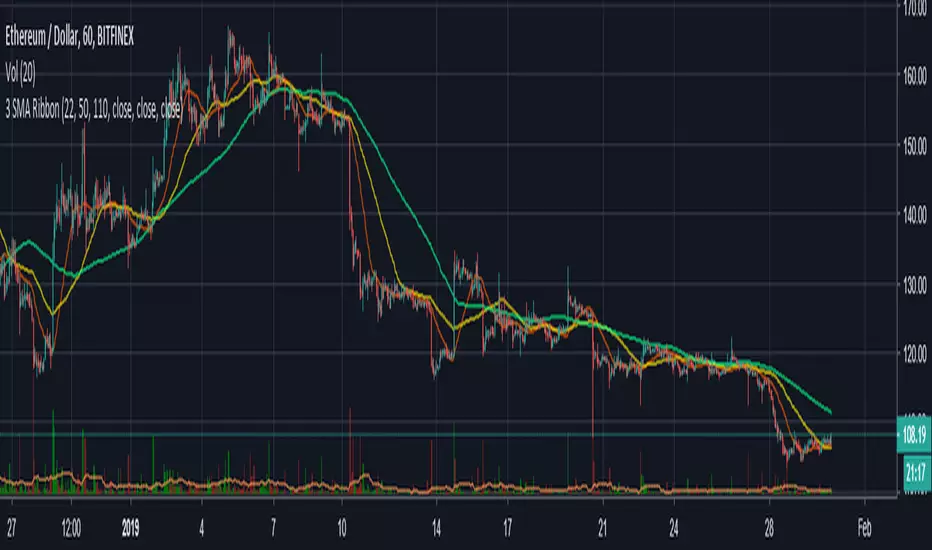
dmw_3SMACross3 SMA set to 5 10 20 used to find the crossing points for pattern reversals or breakouts.

Multiple EMA/SMACreate and customize up to 6 EMAs and 6 SMAs. Useful for both long-term and short-term trading. Comes configured with the moving averages I use for trading.


50/100/200 Moving Averages (Pine Script For Copy)by fresca
SCRIPT LANGUAGE
Copy script below and adjust based on your preferences.
-function (change function from "sma" to "ema", "wma" and more)
-length (25 Day, 150 Day or add more averages to the three in this script.)
-color, (red, yellow, etc. or use color hex codes i.e. #FEDA15, #FFAD8F, etc.)
-transparency (set to desired level 1-100)
Or add more options.
RESOURCES
Color hex codes site: www.canva.com
Trading View Pine Script Editor Reference Guide: www.tradingview.com

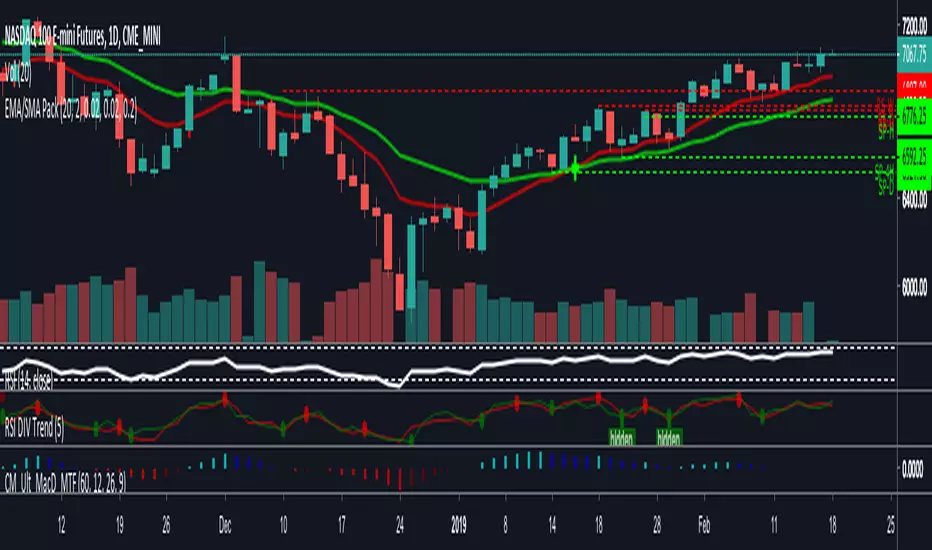
MACD/EMA Long StrategyThis incredibly simple strategy uses a combination of the 20 EMA and bullish/bearish MACD crosses as a low risk method of getting in and out of markets.
Depending on whether the market is above or below the 200 SMA, the script determines if the market is in bullish or bearish territory. Above the 200 SMA, the script will ignore the 20 EMA as a buy condition and buy solely on the confirmation of a bullish MACD cross upon the close of a candle. In this bullish market, the script will only enable the sell condition if both the MACD is bearish AND a close below the 20 EMA occurs. This is to reduce the chances of the script selling prematurely in the event of a bearish MACD cross, if the market is still in overall bullish territory.
When the market is below the 200 SMA, the confirmation occurs in the opposite direction. The buy condition will only be met if both the MACD is bullish AND a close above the 20 EMA occurs. However, the sell condition ignores the 20 EMA and will sell solely on the confirmation of a bearish MACD cross upon the close of the candle.
This strategy can be used in both bullish and bearish markets. This conservative strategy will slightly underperform in a bull market, with the sell condition occasionally being met and then potentially buying back higher. However, it will successfully get you out of a turning market and automatically switch into a more 'risk-off' mentality during a bear market. This strategy is not recommended for sideways markets, as trading around the 20 EMA coupled with a relatively flat MACD profile can cause the strategy to buy the peaks and sell troughs easily.

Horizontal 200 Week SMAfor horizontal level traders that don't want to disregard the 200 week SMA.
Plots a horizontal line for the latest 200 week SMA value in lieu of a wavy line.
Open the indicator's settings and check the "Price Line" box for max visibility

MA Crossover TypeDraws the up and down crossovers of a specified MA Type.
# Inputs
- MA Type: "sma", "ema", "swma", "vwma", "wma"
- Length >=1
- Source
- Offset >= 0
- Show cross Up?
- Show cross Down?
# Open Source
The code is open source @ github.com and uses the commonpine library github.com

MA TypeAdd your MA Type.
# Inputs
- MA Type: "sma", "ema", "swma", "vwma", "wma"
- Length >=1
- Source
- Offset >= 0

Afastamento da Média (by Fabio Figueiredo)This indicator was created by Fábio Figueiredo (VLAD)
The idea is to show the distance in percentage that the asset is of the SMA of the price, so it is possible to know if the price is very stretched or not
I also added the SMA of "distance of SMA" as extra information.
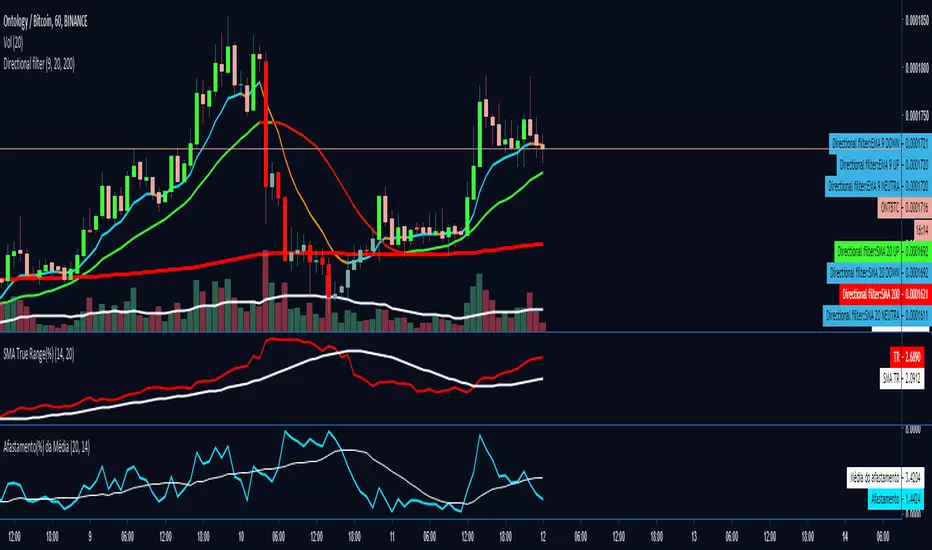
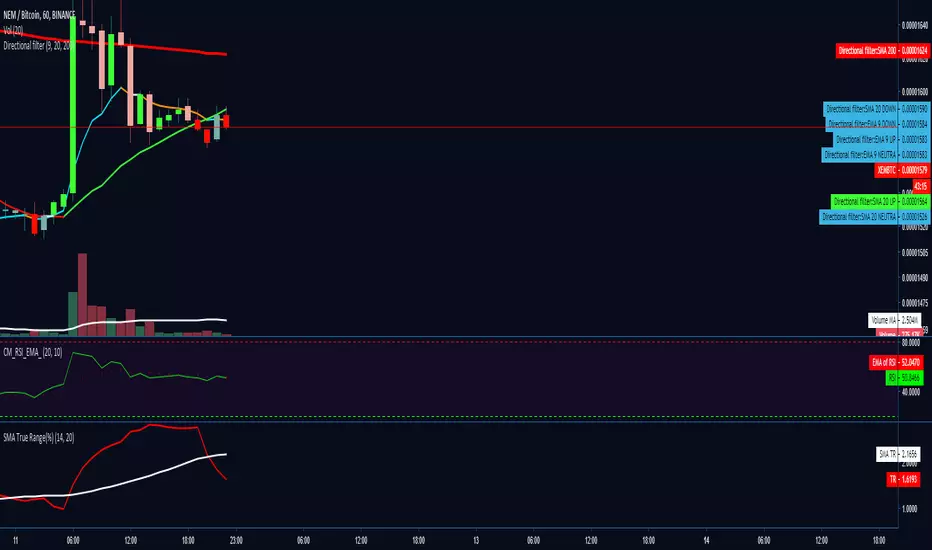
SMA True Range(%)In this Indicator, we have the "True Range" in percentage and the "SMA True Range" in percentage.
we have a good difference from "SMA True Range" to "True Range".
I believe that the "SMA True Range" better shows the volatility, making your stop and target better placed.
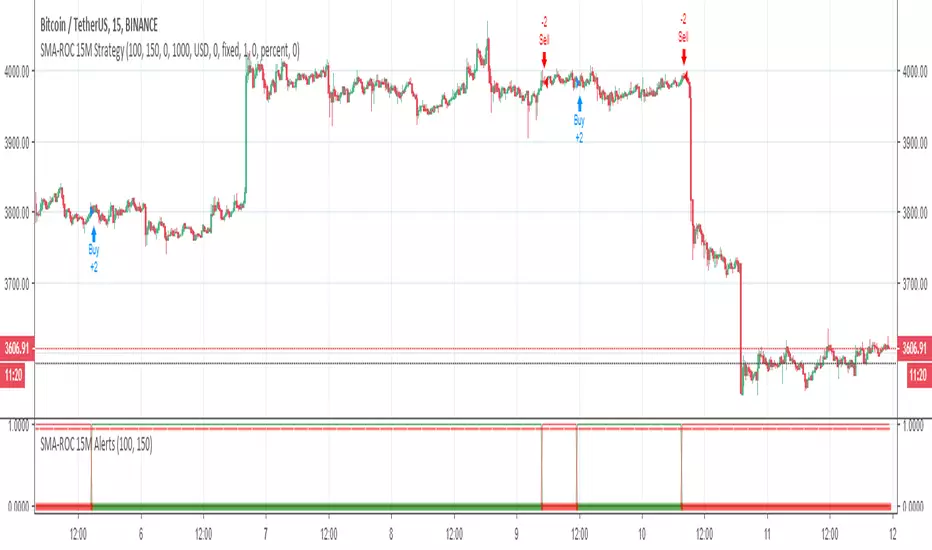
SMA-ROC 15M Strategy// Strategy based on Simple Moving Average (SMA) and Rate of Change (ROC)
// Greatest effect on 15M time frame
// Created and based on Binance chart
// Working with comission
// No repaints
multiple SMA EMA BB full mod + timeframeyou can add as much SMA EMA BB as you want by editting the source code
just remove the // from the indicator code

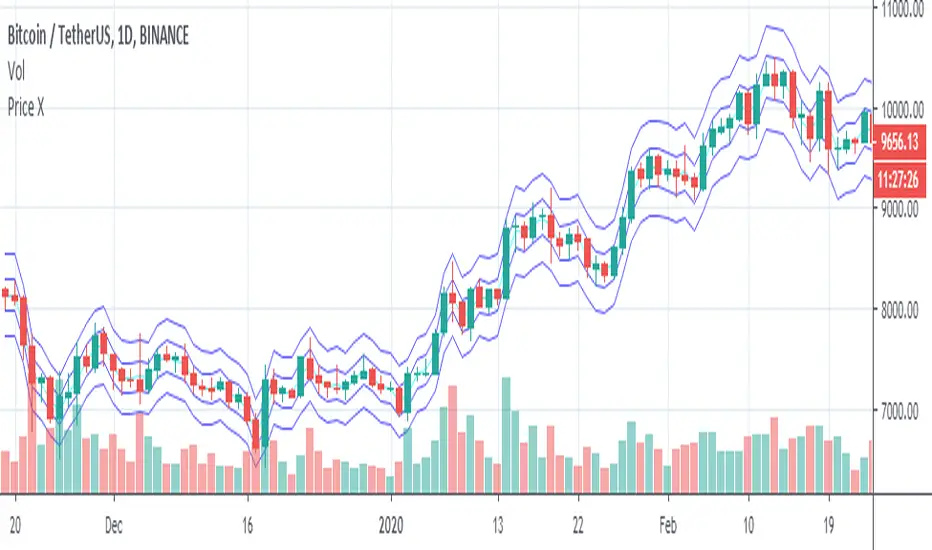
Priceit plots
ema - you can choose length
it plots a custom price say x
it plots price x*factors >
1.0005* price
1.001* price
0.9995* price
0.999* price
1.002* price
1.004* price
1.006* price
1.008* price
1.010* price
1.012* price
you can edit these , the scrip is open source
it plots ohlc4 and ohlc4* factors
1.0005* ohlc4
1.001* ohlc4
0.9995* ohlc4
0.999* ohlc4
you can edit these , the scrip is open source