Hashem OBV+EMA/MAThe On Balance Volume indicator (OBV) is used to measure buying and selling pressure.
It is a cumulative indicator meaning that on days where price went up, that day's volume is added to the cumulative OBV total. If price went down, then that day's volume is subtracted from the OBV total.
The OBV value is then plotted as a line for easy interpretation. OBV is primarily used to confirm or identify overall price Trends or to anticipate price movements after Divergences .
In addition to OBV, EMA and SMA are included. the EMA is used for Support and Resistances for the OBV. and the SMA is used by its Slope (can be S/R as well).
Sma

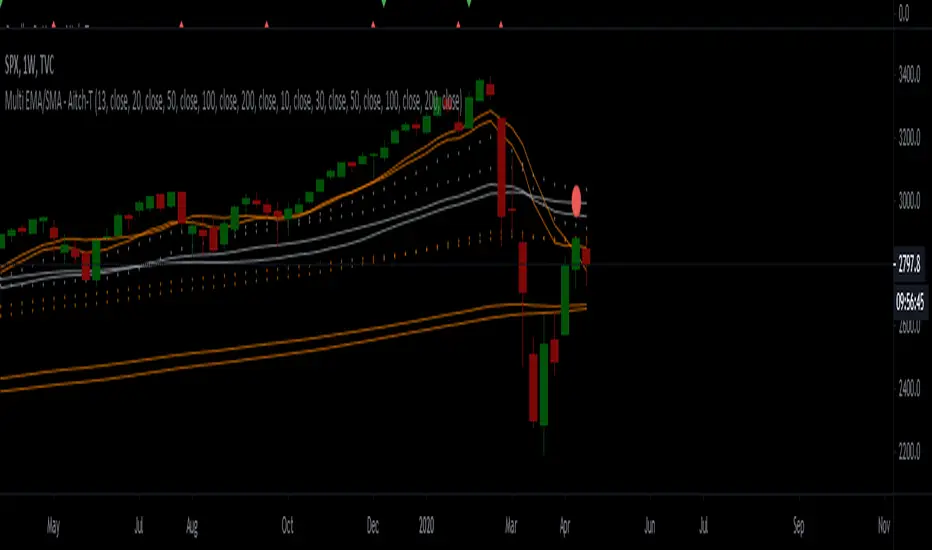
Rhaps SMAEMA Combo v1.1There's many versions of this sort of thing around the Tradingview library, but i guess we all like things to our own specifications.
So this is my take on the SMA and EMA version combined.
Bunch of SMA's & EMA's, with labels, and G&D Cross Labels and Alerts.
These values can of course be changed to any you may prefer.
Rhapsodyy's Combo SMAEMA's v1.1
SMA's with Painted Labels : 10/30/50/80/200
EMA's with Painted Labels : 21/50/89/200/377
50SMA / 200SMA Golden & Death Crosses on Current Timeframe & Alerts
Daily 50SMA / 200SMA Golden & Death Crosses overlayed onto Current Timeframe & Alerts
50EMA / 200EMA Golden & Death Crosses on Current Timeframe & Alerts
Daily 50EMA / 200EMA Golden & Death Crosses overlayed onto Current Timeframe & Alerts

FibMAThis study visually demonstrates Fibonacci moving averages.
The darker the color, the stronger the signal is for either buying or selling.
Buys/Sells only take place when each moving average is above/below the its adjactent fibonacci sequence, i.e 5<8<13<21<34<55<89<144 for buying..
Alerts are provided as BUY ASSET and SELL ASSET.
Multiple moving averages are also provided.

Moving Average(MA) CollectionA simple collection of Simple Moving Averages and Exponential Moving Averages. 4 moving averages enabled by default from a total of 10.
Turn MAs on/off and edit the line style/colour via MA Collection settings.
Default Moving Averages and Default Line Styles
21 EMA (Thin, Purple)
50 SMA (Medium, Yellow)
100 EMA (Medium, Dove Gray)
200 SMA (Thick, Radical Red)
Other Optional Moving Averages and Default Line Styles
5 SMA (Thin, Gray)
8 EMA (Thin, Strkemaster)
13 EMA (Thin, Stiletto)
40 EMA (Medium, Rio Grande)
100 SMA (Medium, Silver)
314 EMA (Thick, Olive)

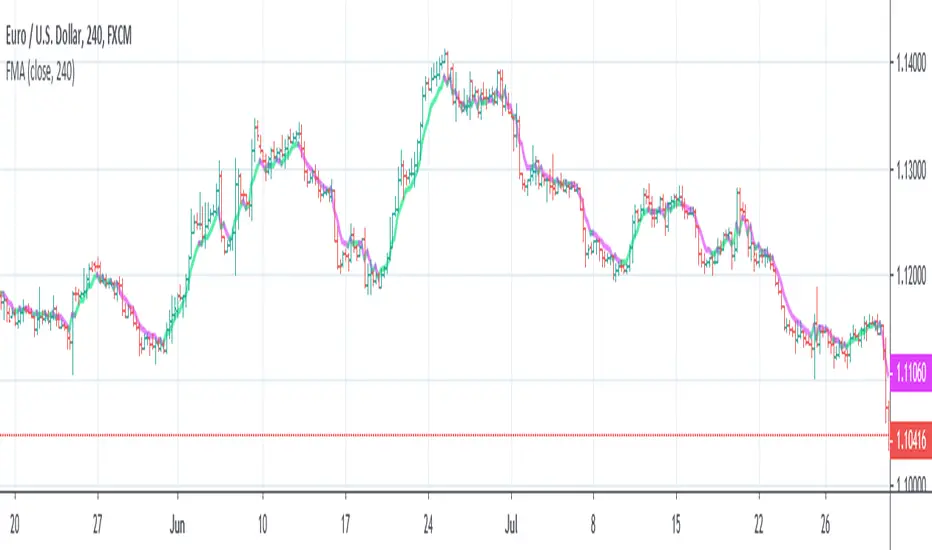
FMA - Fibonacci Moving Average [NXT2017]HI BIG PLAYERS,
I present you a new moving average indicator that relates the values to the lenght of Fibonacci sequence.
Kind regards
NXT2017
MasterMAThis study demonstrates 15 different common moving averages.
SMA, Double SMA, Triple SMA
EMA, Double EMA, Triple EMA
WMA, Double WMA, Triple WMA
VWMA, Double VWMA, Triple VWMA
Hull, Double Hull, Triple Hull
Buy/Sell alerts are given for crossover/under conditions.
Triangles at the bottom, pointing up are buy signals. Triangles at the top, pointing down, are sell signals

Reliability[UO]This is an SMA based indicator. It gives a sense of long term behavior of the asset to make a reliable trade setup
How reliable is your asset to trade without gambling? Is there a reliable trend?
Is this price dip an opportunity to buy?
Is this price spike an opportunity to sell? Or would you avoid buying now and rather wait a bit for prices to fall down to a more reasonable level?
You can recognize all of those points on this indicator. The best to do is to look at the prices and patterns on the indicator to learn about those points.

RSI with Moving Averages[UO]This RSI indicator is one of my favorite indicators. This powerful indicator is implemented by Phi-Deltalytics. I modified the drawing so that it is easier (at least for me) to see the signals and trends (it would not matter if you're doing algorithmic trading).
Trends and signals. For detailed instructions and tutorial see Phi-Deltalytics page

All in One OverlayAll in One Overlay
SMA 1-3 / EMA 1-3 / H-L 1-3 / VWAP
VWAP is Volume-Weighted Average Price
SMA 1-3 is 1,2,or 3 Simple Moving Average Line(s).
EMA 1-3 is 1,2,or 3 Exponential Moving Average Line(s).
H-L 1-3 is the Highest high and Lowest low of x bars from the current bar.
Function is where you choose SMA 1, SMA 2, SMA 3, or EMA1, EMA 2, EMA 3, or H-L 1, H-L 2, H-L 3 to show up on your chart.
Input 1-3 is the number of bars the Function uses to generate its value, Input 1 determines SMA 1 or EMA 1 or H-L 1, Input 2 determines SMA 2 or EMA 2 or H-L 2, and Input 3 determines SMA 3 or EMA 3 or H-L 3.

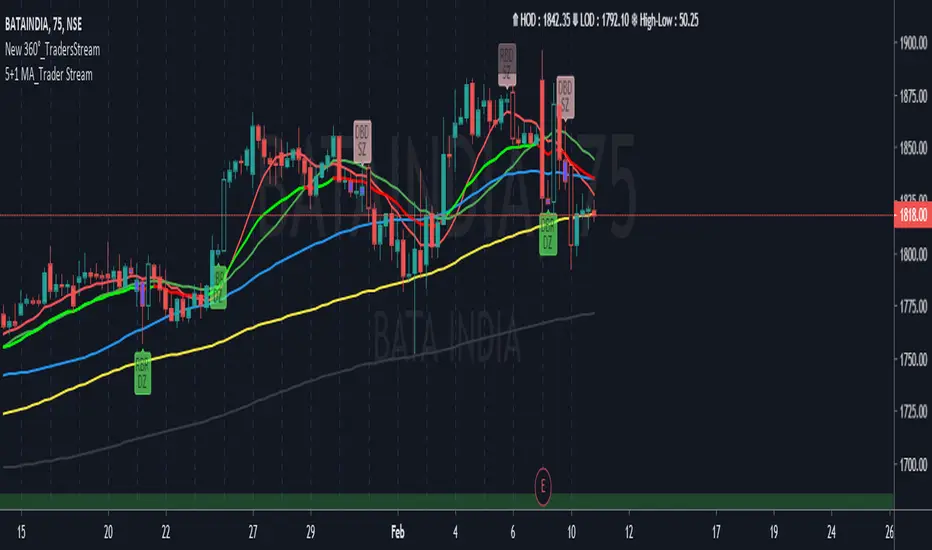
Moving Averages Traders StreamHello Guys this is a new set of Multiple Moving Averages with Bullish and Bearish coloured. Our Tool Includes SMA, EMA, RMA, VMA and VWMA. So if any comments than please.......
Scripting Tutorial A - TManyMA - StopsThis script is for a triple moving average strategy where the user can select from different types of moving averages, price sources, lookback periods and resolutions.
Features:
- 3 Moving Averages with variable MA types, periods, price sources, resolutions and the ability to disable each individually.
- Crossovers are plotted on the chart with detailed information regarding the crossover (Ex: 50 SMA crossed over 200 SMA )
- Forecasting available for all three MAs. MA values are forecasted 5 values out and plotted as if a continuation to the MA.
- Forecast bias also applies to all forecasting. Bias means we can forecast based on an anticipated bullish, bearish or neutral direction in the market.
- To understand bias, please read the source code, or if you can't read the code just send me a message on here or Twitter. Twitter should be linked to my profile.
- Ribbons added and on by default. Optional setting to disable the ribbons. 5 ribbons between MA1 and MA2 and another 5 between MA2 and MA3.
- Ribbons are alpha-color coded based on their relation to their default MAs.
- Ribbons are only visible between MAs if the MAs being compared share the same Type, Resolution, and Source because there is no way to consolidate those three in a simple manner.
- Ribbon values are calculated based on calculated MA Periods between the MAs.
- Converted the existing study into a strategy.
- Strategy only enters long positions with a market order when MA crossovers occur.
- Strategy exits positions when crossunders occur.
- Trades 100% of the equity with one order/position by default.
- Ability to disable trading certain crosses with input checks.
- Ability to exit trades with a take profit or stop loss.
- User input to allow quick changes to the take profit or stop loss percentages.
This script is meant as an educational script with well-formatted styling, and references for specific functions.
*** PLEASE NOTE - THIS STRATEGY IS MEANT FOR LEARNING PURPOSES. DEPENDING ON IT'S CONFIGURATION IT MAY OR MAY NOT BE USEFUL FOR ACTUAL TRADING. THE STRATEGY IS NOT FINANCIAL ADVICE ***

Chingas MTF SMASuper simple Multi Time Frame Simple Moving Average.
This is hard coded to auto select the 200 SMA from multiple timeframes such as the 30m, 1H, 4H, Daily and Weekly.
I am hopeful in another version to be able to get the 12H available in a drop down but at the present moment, it is not an option.
This script will give the convenience of seeing where a Moving Average on another timeframe sits, no matter what timeframe you are currently displaying.

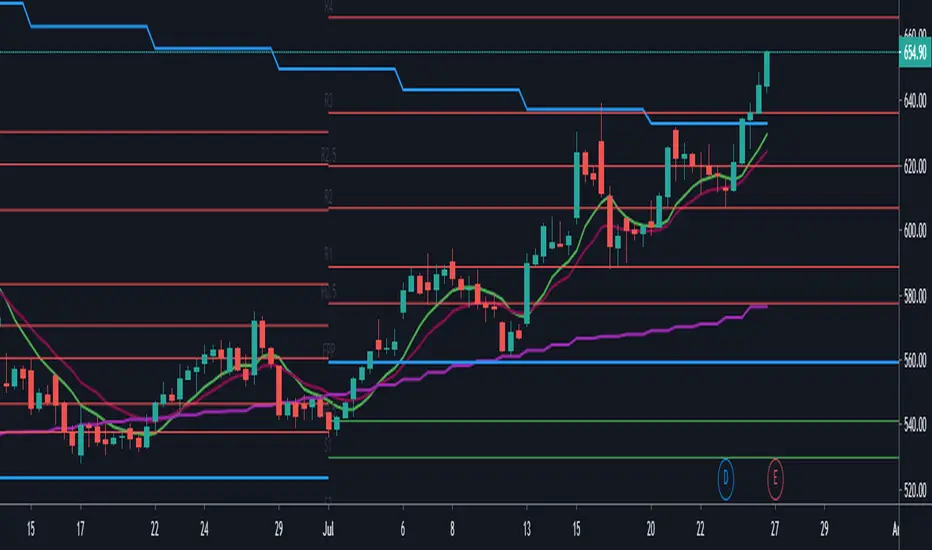
Golden Ratio Fibonacci Multipliers Top Detector [UO]Fibonacci levels that show the critical top and bottom levels. There is no way to miss the top and bottom. And a top detector.
Also the most important SMA lines (SMA 50, 200), EMA21. Those are the most frequently used lines by traders.
This indicator is based on the work of www.tradingview.com
His work set me thinking. Could I also see the bottom using Fibonacci numbers? Yes, of course.
My favorite timeframes with this indicator are 6H, 1D, 3D.
Intensively used for BTC and BNB. And useful for any other coin.

[C] SMA multi TimeFrame with Ext. Fib PPThis script adds multi time frame Simple moving Average on a single time frame. It enables you to judge the moving average of a larger period on a small time frame. The added bonus of Fibonacci levels with additional support and resistance points works well with most NSE equity items on a intraday 5 min time frame.
CompoundMACDCompoundMACD is a study that modifies the basic MACD to use four moving averages.
The fast line of the MACD (red line) is calculated from a fast (alpha) and slow (beta) double EMA.
The slow line of the MACD (blue line) is calculated from a fast (alpha) and slow (beta) smooth moving average (SMA).
The delta (green line) is calculated from the fast and slow lines of the MACD.
Buy signals occur when the candlestick is below momentum and the fast and slow lines crossover each other while under the delta. These are marked by triangles at the bottom pointing up. A BUY ASSET alert is also provided.
Sell signals occur when the candlestick is above momentum and the fast and slow lines crossunder each other while above the delta. These are marked by triangles at the top pointing down. A SELL ASSET alert is also provided.
User configurable setting:
Momentum
MACD fast line: Fast (Alpha) DEMA, Slow (Beta) DEMA
MACD slow line: Fast (Alpha) SMA, Slow (Beta) SMA
MACD Smoothing

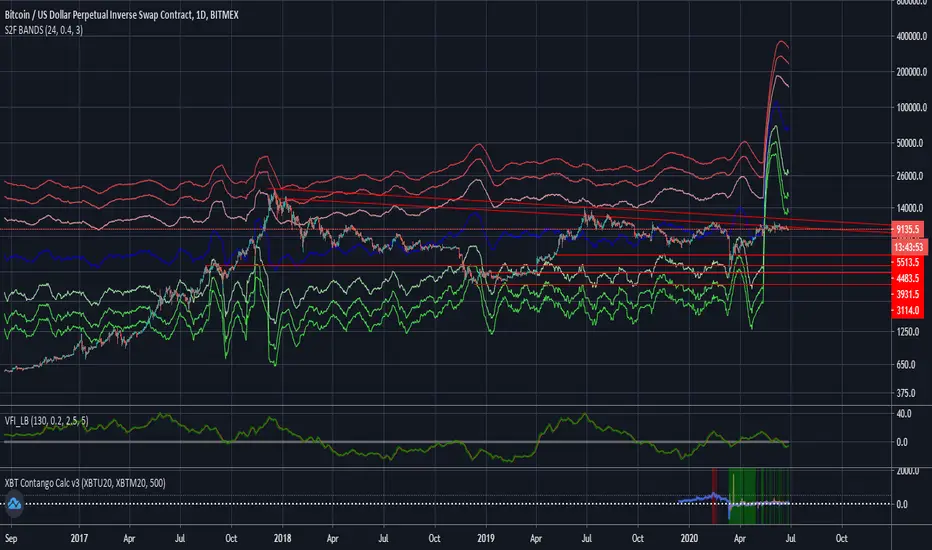
Stock to Flow Model with Standard Deviation BandsThis Study takes the Stock to Flow Model for Bitcoin as presented by 100trillionUSD and smoothes it using an SMA. Then it calculates the close's standard deviation from it and displays the 2-Sigma Bands.
The stock to flow model seems to be one of the best predictions of Bitcoins price.
The standard deviation bands are supposed to show situations in which Bitcoin is significantly over- or under-bought.
[Vold] Multiple Moving AveragesThis script contains 15 highly customizable moving averages, the following options are currently available:
1. Activate Moving Average: Activate or deactivate moving average.
2. Use Resolution: Activate or deactivate resolution configuration.
3. Resolution: The resolution of the moving average (default: 4H).
3. Length: The length of periods of the moving average (default: 9).
4. Source: The source of the moving average (default: price close).
5. Type: The type of the moving average (Simple, Exponential, Weighted, Hull), (default: Simple).
6. Offset: The offset of the moving average (default: 0).

Neru_TrendEvaluator_v1Neru_TrendEvaluator_v1
_____________________
This trend-finder tool is showing you at the bottom of the chart (adjustable), what the current supertrend for the chosen interval is.
Used indicators are the Ichimoku Cloud (adjustable settings) and three SMAs (also adjustable).
Both have standard settings and are useful for Stocks, Forex and Cryptocurrencies.
_____________________________________________
Warm regards,
Neru

MA Crossover [Alerts]This is a Moving Average Crossover study .
The study comes with all alerts (Long, Short, Take Profit, and Stop Loss).
A few visuals like Exit Loss and Profit/Loss Boxes have been added as well.
The following Moving Averages are supported:
SMA
EMA
DEMA
TEMA
WMA
VWMA
SMMA
HullMA
LSMA
ALMA
SSMA
TMA
ZLEMA
If you’d like to automate this script you can do that by using AutoView, ProfitView, ProfitTrailer, CryptoHopper etc.
Feel free to leave a comment and share it with your friends. Enjoy!

Rolling Moving Average, SMA/EMA, for IPO stocksThe script replicates the standard EMA/SMA used by tradingview, but also adds an estimate for the first X periods, where X is the length of the moving average. This allows for an estimate of support resistance in IPO stocks, when fewer date is available

Scripting Tutorial 9 - TManyMA Strategy - Long Market Order OnlyThis script is for a triple moving average strategy where the user can select from different types of moving averages, price sources, lookback periods and resolutions.
Features:
- 3 Moving Averages with variable MA types, periods, price sources, resolutions and the ability to disable each individually
- Crossovers are plotted on the chart with detailed information regarding the crossover (Ex: 50 SMA crossed over 200 SMA )
- Forecasting available for all three MAs. MA values are forecasted 5 values out and plotted as if a continuation to the MA.
- Forecast bias also applies to all forecasting. Bias means we can forecast based on an anticipated bullish, bearish or neutral direction in the market.
- To understand bias, please read the source code, or if you can't read the code just send me a message on here or Twitter. Twitter should be linked to my profile.
- Ribbons added and on by default. Optional setting to disable the ribbons. 5 ribbons between MA1 and MA2 and another 5 between MA2 and MA3.
- Ribbons are alpha-color coded based on their relation to their default MAs.
- Ribbons are only visible between MAs if the MAs being compared share the same Type, Resolution, and Source because there is no way to consolidate those three in a simple manner.
- Ribbon values are calculated based on calculated MA Periods between the MAs.
- Converted the existing study into a strategy
- Strategy only enters long positions with a market order when MA crossovers occur
- Strategy exits positions when crossunders occur
- Trades 100% of the equity with one order/position by default
- Ability to disable trading certain crosses with input checks
This script is meant as an educational script with well-formatted styling, and references for specific functions.
*** PLEASE NOTE - THIS STRATEGY IS MEANT FOR LEARNING PURPOSES. DEPENDING ON IT'S CONFIGURATION IT MAY OR MAY NOT BE USEFUL FOR ACTUAL TRADING. THE STRATEGY IS NOT FINANCIAL ADVICE ***

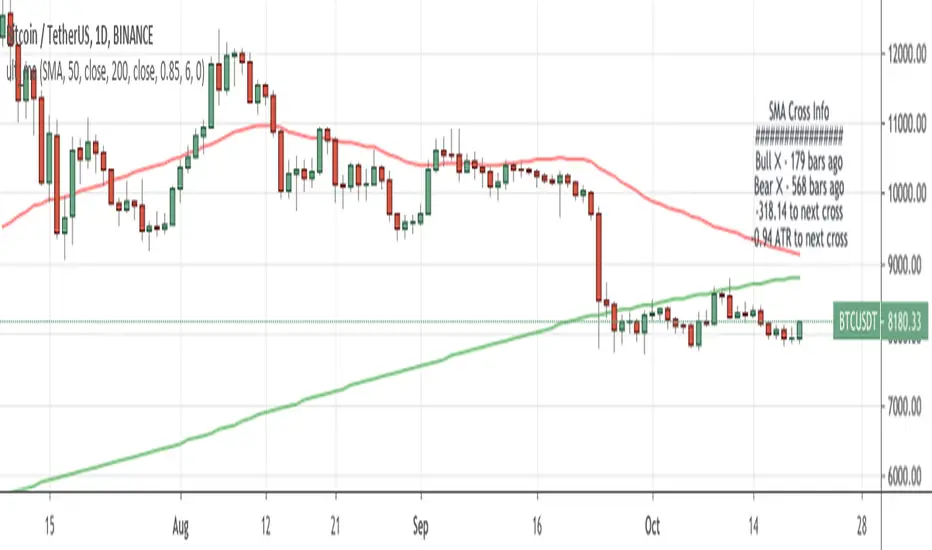
Ultimate MA Cross IndicatorContinue to experiment with new labels functionality in TradingView. Created ma cross script with 9 different types of MA wit additional information box. In that box, I included the bars passed from the previous bull/bear cross.
Also you cand find there live distance between moving averages in price and ATRs , so you track how close are you from the next close.
Do you think this concept is useful? What information do you want to see in this kind of boxes?
These ma types are included in this indicator:
Simple Moving Average ( SMA )
Exponential Moving Average ( EMA )
Weighted Moving Average ( WMA )
Arnaud Legoux Moving Average ( ALMA )
Hull Moving Average ( HMA )
Volume-weighted Moving Average ( VWMA )
Least Square Moving Average ( LSMA )
Smoothed Moving Average ( SMMA )
Double Exponential Moving Average ( DEMA )
Multi-EMA | 5 EMAs in 1 ScriptAdd up to 5 EMAs to your charts with this script.
Fully Customizable.
----------------------------------------
Wanna try my other scripts?
Histogram with Divergence Finder:
Willams %R with 13 EMA and Divergence Finder:
More scripts here:
www.tradingview.com