Moving Average CrossoverIt was planned as an addition to Moving Average Smoothness Benchmark and Profitable Moving Average Crossover , but can be used standalone.
Supports 62 types of well-known moving averages and allows full-featured customization.
Supported types of averages and filters:
AEMA , Adaptive Exponential MA (by Vitali Apirine)
AHMA , Ahrens MA (by Richard D. Ahrens)
ALMA , Arnaud Legoux MA (by Arnaud Legoux and Dimitris Kouzis-Loukas)
ALF , Adaptive Laguerre Filter (by John F. Ehlers)
AMA , Adaptive MA (by Vitali Apirine)
ARSI , Adaptive RSI
BAMA , Bryant Adaptive MA (by Michael R. Bryant)
BF2 , Butterworth Filter with 2 poles
BF3 , Butterworth Filter with 3 poles
DEMA , Double Exponential MA (by Patrick G. Mulloy)
DWMA , Double Weighted (Linear) MA
EDCF , Ehlers Distance Coefficient Filter (by John F. Ehlers)
EDSMA , Ehlers Deviation-Scaled MA (by John F. Ehlers)
EHMA , Exponential Hull MA
EMA , Exponential MA
EVWMA , Elastic Volume Weighted MA (by Christian P. Fries)
FRAMA , Fractal Adaptive MA (by John F. Ehlers)
GF1 , Gaussian Filter with 1 pole
GF2 , Gaussian Filter with 2 poles
GF3 , Gaussian Filter with 3 poles
GF4 , Gaussian Filter with 4 poles
HFSMA , Hampel Filter on Simple Moving Average
HFEMA , Hampel Filter on Exponential Moving Average
HMA , Hull MA (by Alan Hull)
HWMA , Henderson Weighted MA (by Robert Henderson)
IDWMA , Inverse Distance Weighted MA
IIRF , Infinite Impulse Response Filter (by John F. Ehlers)
JAMA , Jurik Adaptive MA (by Mark Jurik)
JMA , Jurik MA (by Mark Jurik, )
KAMA , Kaufman Adaptive MA (by Perry J. Kaufman)
LF , Laguerre Filter (by John F. Ehlers)
LMA , Leo MA (by ProRealCode' user Leo)
LSMA , Least Squares MA (Moving Linear Regression)
MAMA (by John F. Ehlers)
FAMA , Following Adaptive MA (by John F. Ehlers)
MD , McGinley Dynamic (by John R. McGinley)
MHLMA , Middle-High-Low MA (by Vitali Apirine)
MNMA , McNicholl MA (by Dennis McNicholl)
NSMA , Moving Average 3.0 on SMA (by Manfred G. Dürschner)
NEMA , Moving Average 3.0 on EMA (by Manfred G. Dürschner)
NWMA , Moving Average 3.0 on WMA (by Manfred G. Dürschner)
NVWMA , Moving Average 3.0 on VWMA (by Manfred G. Dürschner)
PEMA , Pentuple Exponential MA (by Bruno Pio)
PWMA , Parabolic Weighted MA
QMA , Quick MA (by John McCormick)
QEMA , Quadruple Exponential MA (by Bruno Pio)
REMA , Regularized Exponential MA (by Chris Satchwell)
RMA , Running MA (by J. Welles Wilder)
RMF , Recursive Median Filter (by John F. Ehlers )
RMTA , Recursive Moving Trend Average (by Dennis Meyers)
SHMMA , Sharp Modified MA (by Joe Sharp)
SMA , Simple MA
SSF2 , Super Smoother Filter with 2 poles (by John F. Ehlers)
SSF3 , Super Smoother Filter with 3 poles (by John F. Ehlers)
SWMA , Sine Weighted MA
TEMA , Triple Exponential MA (by Patrick G. Mulloy)
TMA , Triangular MA (generalized by John F. Ehlers)
T3 , (by Tim Tillson)
VIDYA , Variable Index Dynamic Average (by Tushar S. Chande)
VWMA , Volume Weighted MA (by Buff P. Dormeier)
WMA , Weighted (Linear) MA
ZLEMA , Zero Lag Exponential MA (by John F. Ehlers and Ric Way)
Sma
[AU] Hybrid RSI MTF// hybrid rsi MTF v03
multiple timeframe option for multiple components
rsi ema/sma cross dot enabled by default
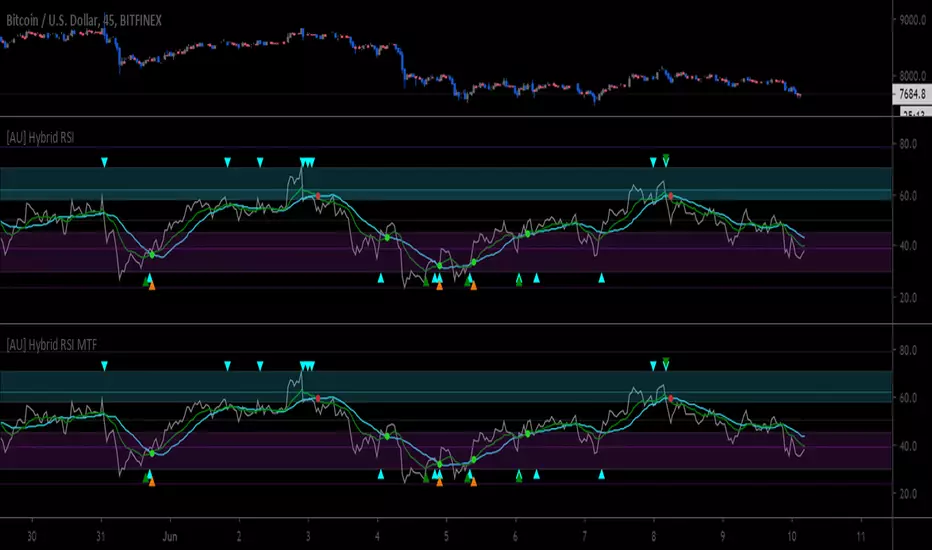
rsi sma/ema cuCustom RSI with SMA 9, EMA 45 and Bull/Bear Control Zones from Krown and Constance Brown.

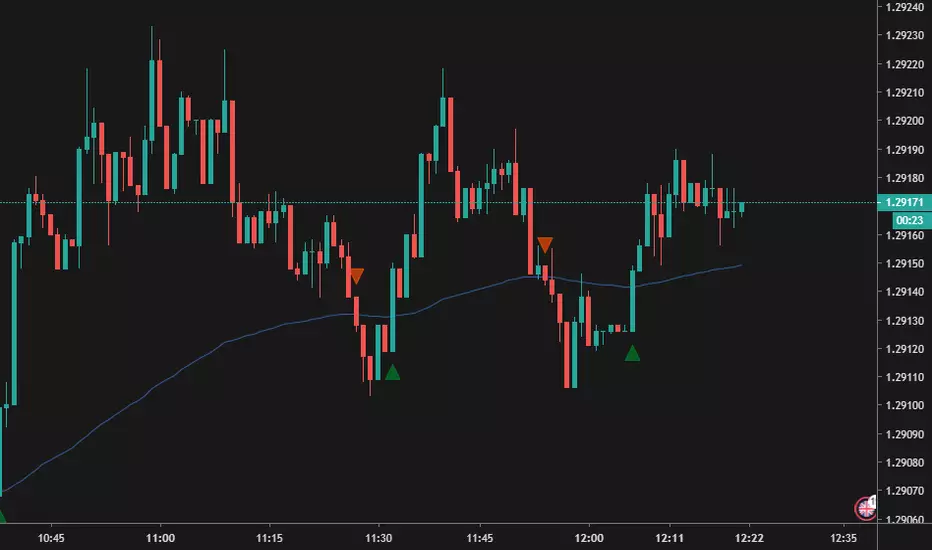
Directional filter VERSION 2The idea is to make it more visible if the moment is to seek buying or selling, based on moving averages, being SMA 21 and EMA 9.
best BUYBAR has the EMA9 and SMA21 rising and closing above them. "relevance A"
best SELLBAR has the EMA9 and SMA21 dropping and closing below them. "relevance A"
Conditions for all colors of the candlesticks:
BuyBar A = price closes above EMA9 and SMA21 with EMA9 and SMA21 rising.
BuyBar B = price closes above SMA21 with SMA21 rising OR price closes above EMA9 and SMA21.
BuyBar C = price closes above EMA9 with EMA9 rising and SMA21 falling.
BuyBar Neutral = close> open.
SellBar A = price closes below EMA9 and SMA21 with EMA9 and SMA21 falling.
SellBar B = price closes below SMA21 with SMA21 falling OR price closes below EMA9 and SMA21.
SellBar C = price closes below EMA9 with EMA9 falling and SMA21 rising.
SellBar Neutral = close abertura.
SellBar A = preço fecha abaixo de EMA9 e SMA21 com EMA9 e SMA21 caindo.
SellBar B = preço fecha abaixo de SMA21 com SMA21 caindo OU preço fecha abaixo de EMA9 e SMA21.
SellBar C = preço fecha abaixo de EMA9 com EMA9 caindo e SMA21 subindo.
SellBar Neutral = fechamento < abertura.
As medias moveis também alteram de acordo com a direção em que estão:
EMA 9 subindo = azul
EMA 9 caindo = laranja
SMA 21 subindo = verde
SMA21 caindo = vermelho
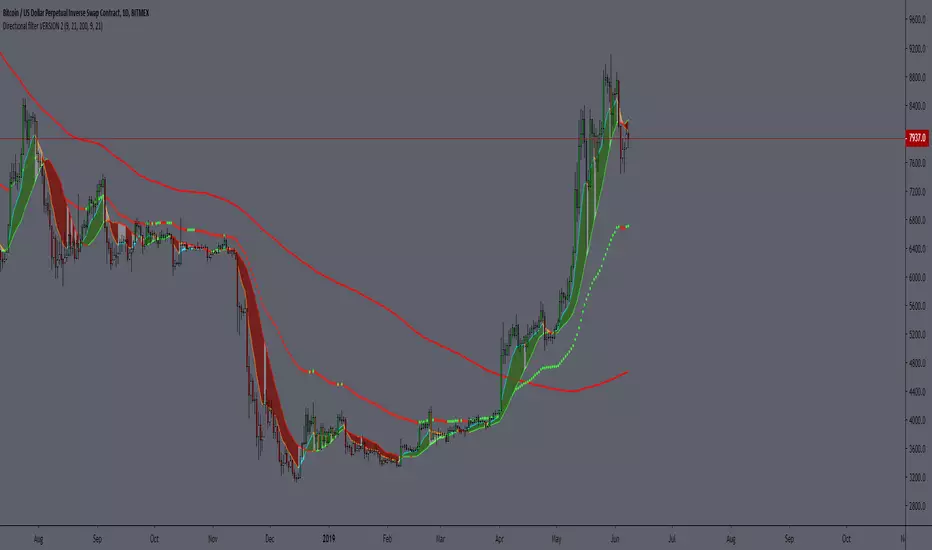

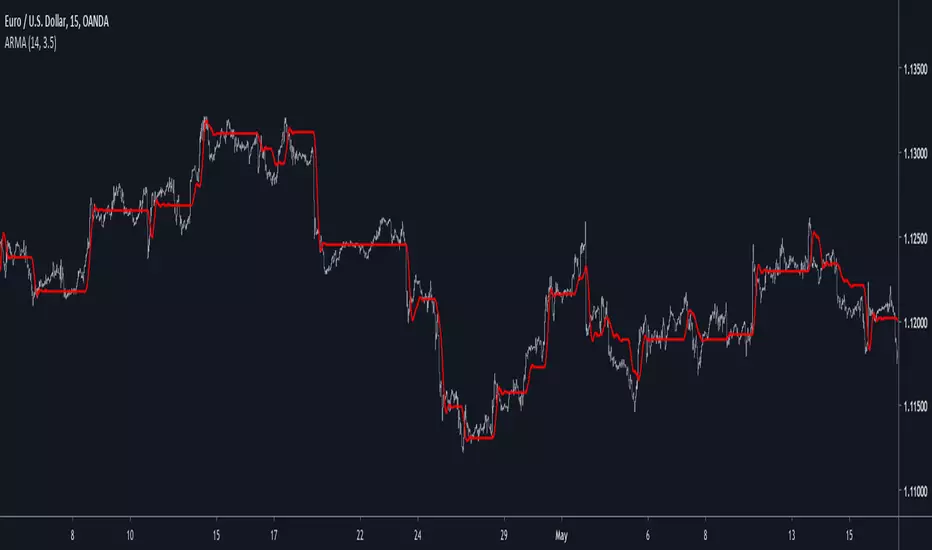
Autonomous Recursive Moving AverageIntroduction
People often ask me what is my best indicators, i can't really respond to this question with a straight answer but i would say you to check this indicator. The Autonomous Recursive Moving Average (ARMA) is an adaptive moving average that try to minimize the sum of squares thanks to a ternary operator, this choice can seem surprising since most of the adaptive moving averages adapt to a smoothing variable thanks to exponential averaging, but there are lot of downsides to this method, i really wanted to have a flat filter during flat markets and this is what i achieved.
The Indicator
length control the amount of smoothing during trending periods, gamma is the trend sensitivity threshold, higher values of gamma will make an overall flat filter, adjust gamma to skip ranging markets.
gamma = 2, we can adjust to 3 while preserving smoothing reactivity with trading periods.
gamma = 3
low length and higher gamma create more boxy result, the filter add overshoots directly in the output, its unfortunate.
The Zero-Lag option can reduce the lag as well as getting additional flat results without changing gamma.
Conclusion
The indicator need work, but i can't leave without publishing it, the overshoots are a big problems, changing sma for another stable filter can help. I hope you find an use to it, i really like this indicator.
Thanks for reading
MA Trend-Indicator + SidewaysAn indicator that shows upwards/downwards trends + sideways movements (=gray fields)
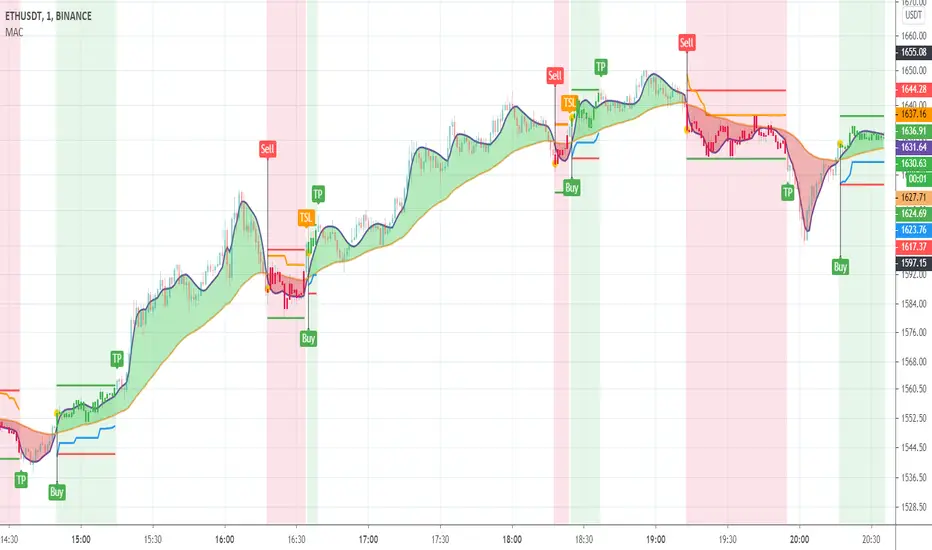
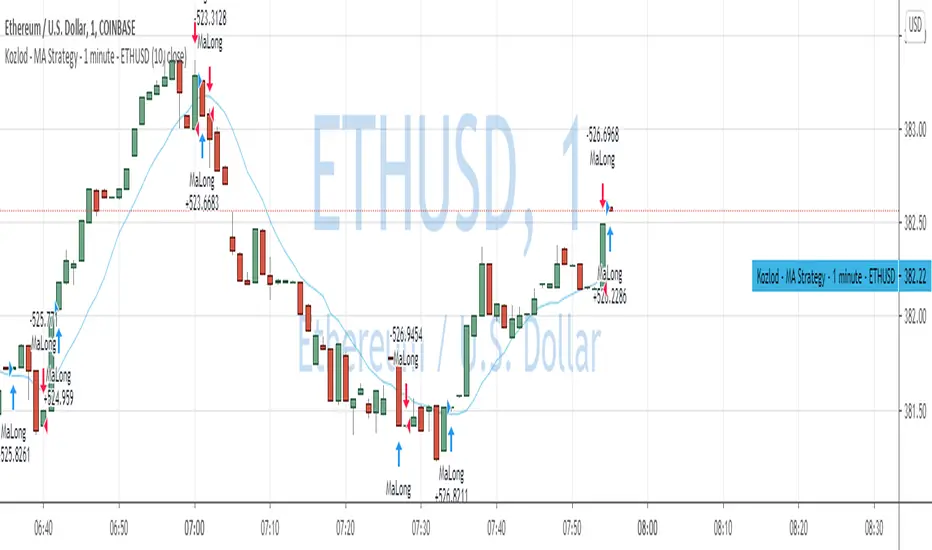
QuantNomad - MA Strategy - 1 minute - ETHUSDInteresting performance for simple MA strategy on 1m ETHUSD. I used only close price and 15 SMA in it.
Performance is 55% over 10 days with a drawdown of only 3.5%.
Percent profitable is only 30% with almost 2k trades.
For sure this won't work as a standalone strategy, with 2k trades commission and slippage will destroy all your PNL but it can be a pretty good base for a more complicated strategy with good filters.
And remember:
Past performance does not guarantee future results.
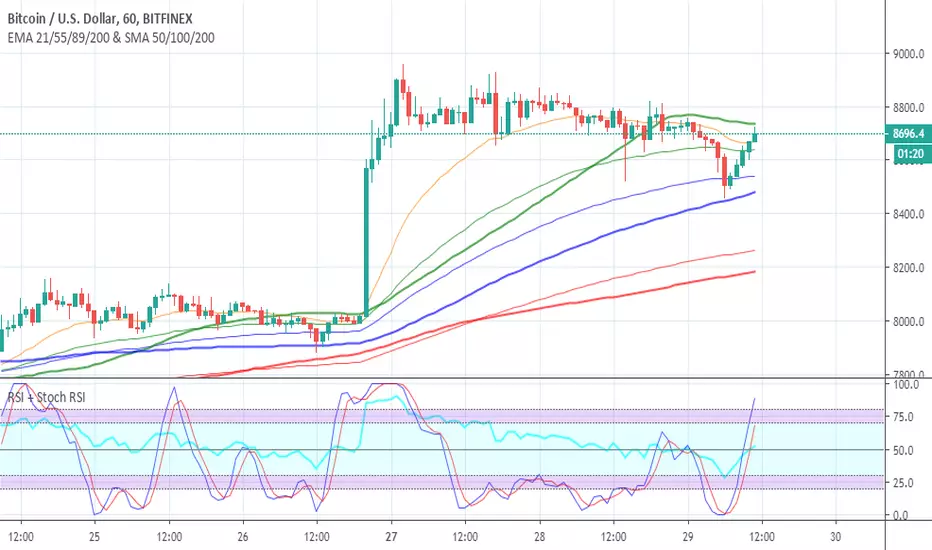
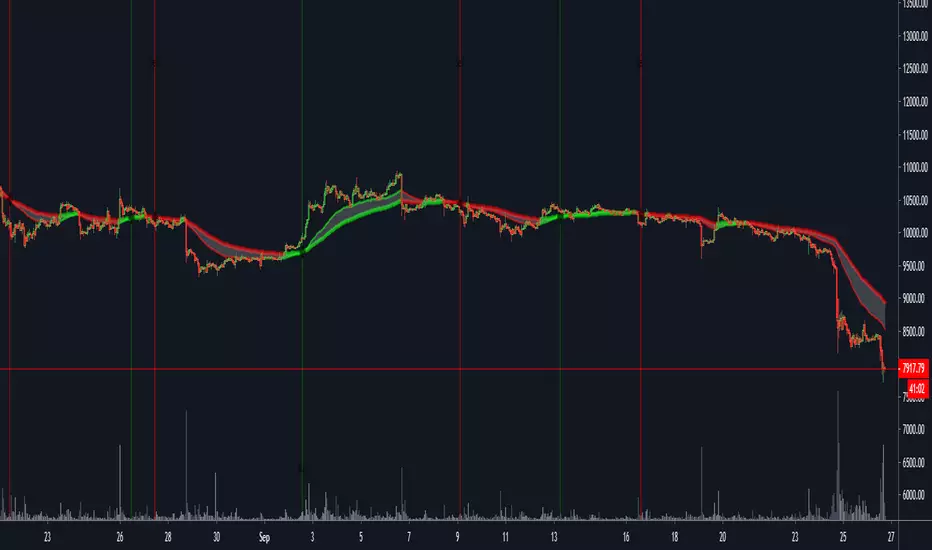
EMA 21/55/89/200 & SMA 50/100/200Free to use indicator combining all important time periods for two of the most valuable trading tools: EMAs and SMAs . As you can see on the chart and previous time periods, BTC often bounces off these, giving you an insight into possible future price movement. Add to your favourite scripts now at the bottom of this page and stay ahead of the game.
Switching off all except the most important periods in the indicator settings (21 & 55 EMA + 100 & 200 MA) can help keep a nice clean trading chart, if that is your preference.
SIMPLE MOVING AVERAGE
Smooths out the price across each period to reveal short, medium and long term trends and potential areas of support or resistance.
50, 100 and 200 are three of the most commonly used/respected moving averages.
The 200MA in particular provides very strong support/resistance on longer time frames.
EXPONENTIAL MOVING AVERAGE
A slightly more sophisticated version of the moving average, the EMA gives more weight to recent price action (i.e. a recent big move up/down will be reflection sooner... "the trend is your friend").
21, 55, 89 and 200 are four of the most commonly used/respected exponential moving averages.
The 21 and 55 EMA are undoubtedly the most powerful, and somewhat a self-fulfilling prophecy since so many people follow them.
Just so you know...
Green = 55/50, blue = 89/100, red = 200/200
EMAs are shown with thinner lines (as they change direction faster, think light and quick)
SMAs are shown with thicker lines (as they change direction slower, think heavier and more respected)
My free Combined RSI and Stochastic RSI Indicator , is also shown on the chart above and will save you valuable space on your trading screen, since you are strictly limited to the number of indicators you can use at one time. Give it a try and you'll wonder why you ever had separate indicators for RSI and Stoch RSI clogging up both your screen and indicator allowance.
These tools are for educational purposes only and not a recommendation to buy or sell. Always do your own research before trading.
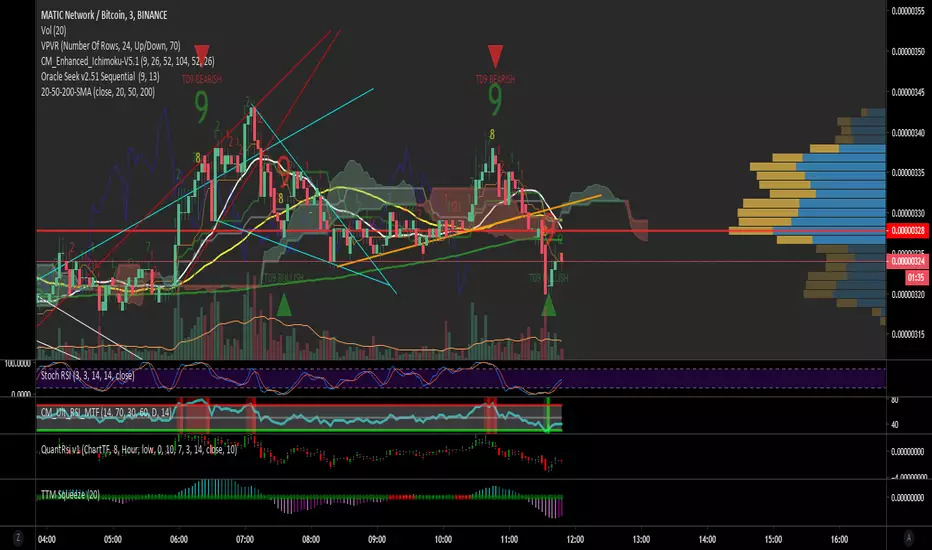
ORACLE 20-50-200-SMA V1.520-50-200 day SMA
V1.5 This particular setup has been optimized for dark backgrounds/dark mode users
White : 20 SMA
Yellow: 50 SMA
Green :200 SMA
As the 20 SMA is in white , it will be difficult to see with white background users , to get around this open the settings tab for the indicator once added to your chart , go to style then amend colors to any color you desire.
These are by far some of the best simple moving averages to use
The sequential script which is a 1-9 count can be added from this link
CAP Kronks Bias Killer 10Candles and background changes colour when 60 SMA is above or below close price


AVERAGE MULTI_SMAIndicator returns an average of 5 SMAs. an interesting point that I have noticed that the price has several times reacted on it.
Note 1: Do not just use this as a criterion for buying and selling, use as one more aid.
Note 2: It is possible to leave in the chart all the averages, if you feel it necessary.
------------------------------------//--------------------------------------------------
Indicador retorna uma média de 5 SMAs. um ponto interessante que tenho notado que o preço tem diversas vezes reagido nele.
Observação 1: Não use apenas isso como critério para compra e venda, use como mais um auxilio.
Observação 2: É possivel deixar no grafico todas as médias, caso você ache necessário.

TH_MA Directional ChangeSimple script
Plot flag on chart when HMA (default), EMA or SMA is changing direction.

Moving Average Cross Alert, Multi-Timeframe OptionSee when two moving averages cross. With the option to choose between four moving average calculations:
SMA = simple moving average
EMA = exponential moving average (default)
WMA = weighted moving average
Linear = linear regression
The moving averages can be plotted from different time-frames, like e.g. the weekly or 4 hour time-frame using HL2 , HLC3 or OHLC4 as price source for the calculation. In addition there is a background color alert and arrows when the moving averages cross each other when the price also rises or falls. And the moving averages are colored depending on their trend direction (if they are trending up or down).
Custom EMA Cross SignalThis indicator notifies when the ma is crossed.
To use this script fully you will need a key from Taleeto.
It is good for following a trend
Pullback SP-Strategy#9This is my interpretation of Steven Primo's pull back strategy indicator # 9. Seems to work on any time frame or combination high and low. I prefer to use it with the regular fractals and a 20 or 50 SMA and 5 period RSI. I would prefer to have it only paint up arrows when bars close above the SMA and vise versa with down arrows. If someone can help me correct that please contact me.
Thanks, 1776er.

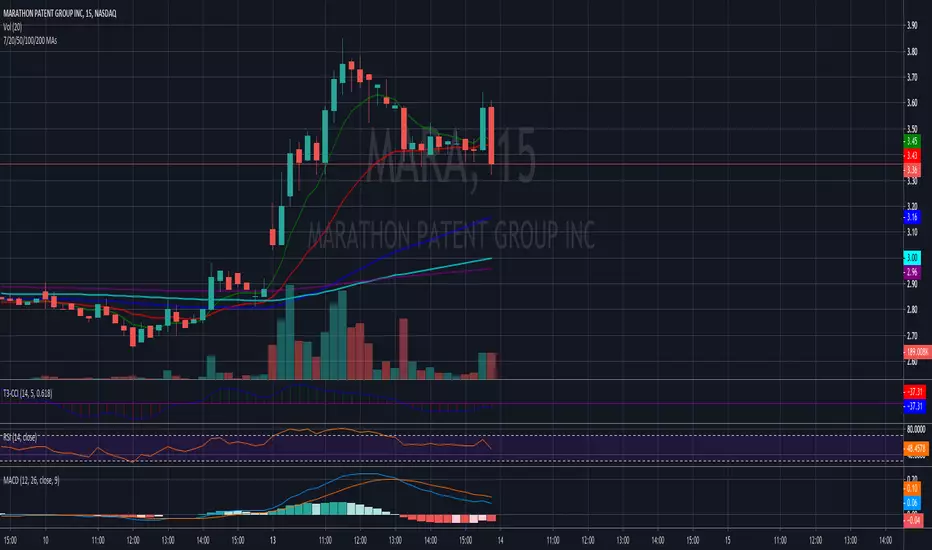
7/20 EMAs 50/100/200 SMAs as One Script.This is one of the scripts I use daily as a full time daytrader. It works well for me to predict MA resistance and support levels and has been very reliable.
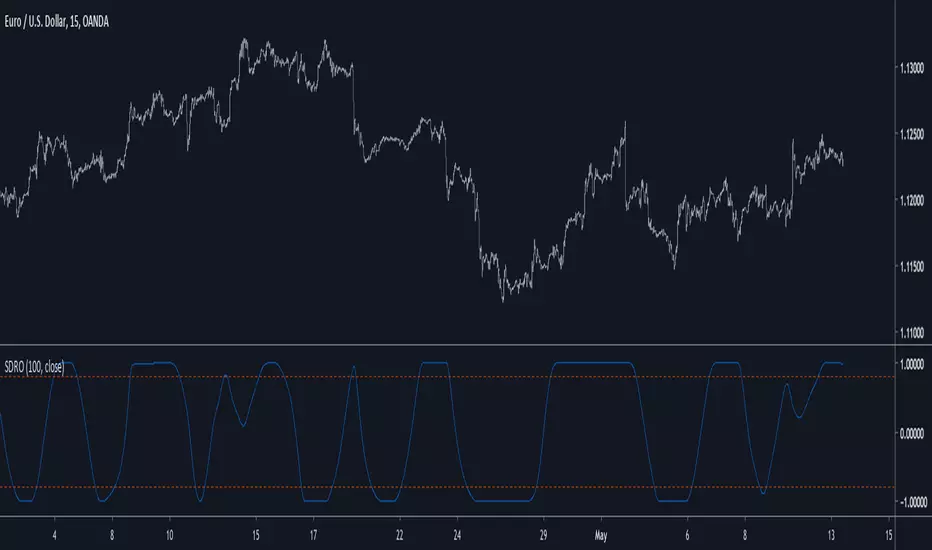
Smoothed Delta's Ratio OscillatorIntroduction
Scaled and smoothed oscillators can provide easy to read/use information regarding price, therefore i will introduce a new oscillator who create smooth results and use a fast and practical scaling method. In order to allow for even more smoothness the option to smooth the input with a lsma has been added.
Scaling Using Changes
In this indicator scaling in a range of (1,-1) is achieved through the following calculations :
a = sma(abs(change(src,length)),length)
b = change(sma(src,length),length)
c = b/a
where src is our input. The two elements a and b are quite similar, a smooth the absolute change of the input over length period while b calculate the change of the smoothed input over length period, this make a > b and able us to perform scaling in a range of (1,-1).
The Indicator Parameters
Length control the differencing/smoothing period of the indicator, greater values create smoother and less volatile results, this mean that the oscillator will tend to be equal to 1 or -1 in a longer period of time if length is high. The smooth option allow for even smoother results by enabling the input to be smoothed by a lsma of length period.
Conclusions
I presented a smooth oscillator using a new rescaling technique. Parameters can be separated to provide different results, i believe the code is simple enough for everyone to modify it in order to provide interesting creations.
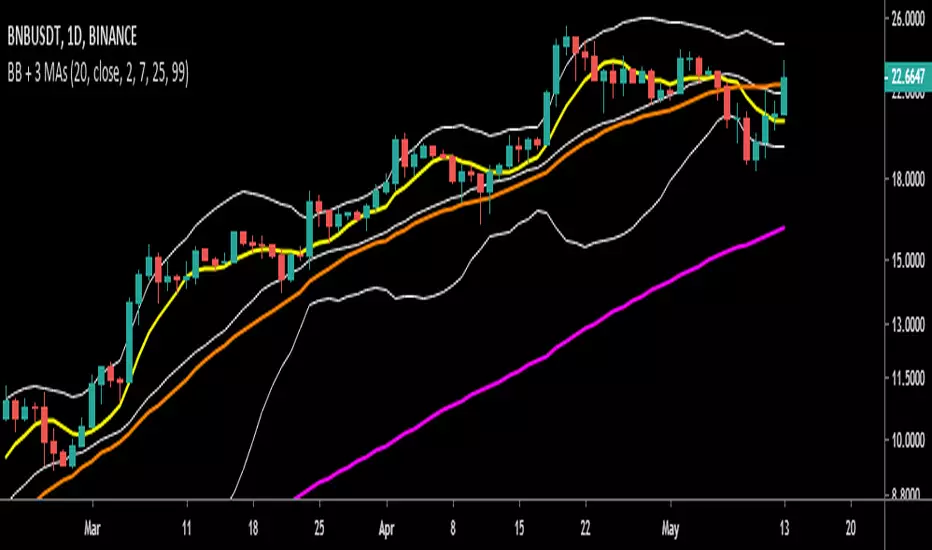
Bollinger Bands and 3 Moving Average lines in one IndicatorThe Bollinger Bands (BB) and 3 Moving Average (MA) lines in ONE indicator.
Default values were employed from Binance settings, which are:
- The BB: MA 20 and multiply by 2.
- The 3 MAs: 7, 25 and 99 periods.
The values can be modified to meet one's strategy.

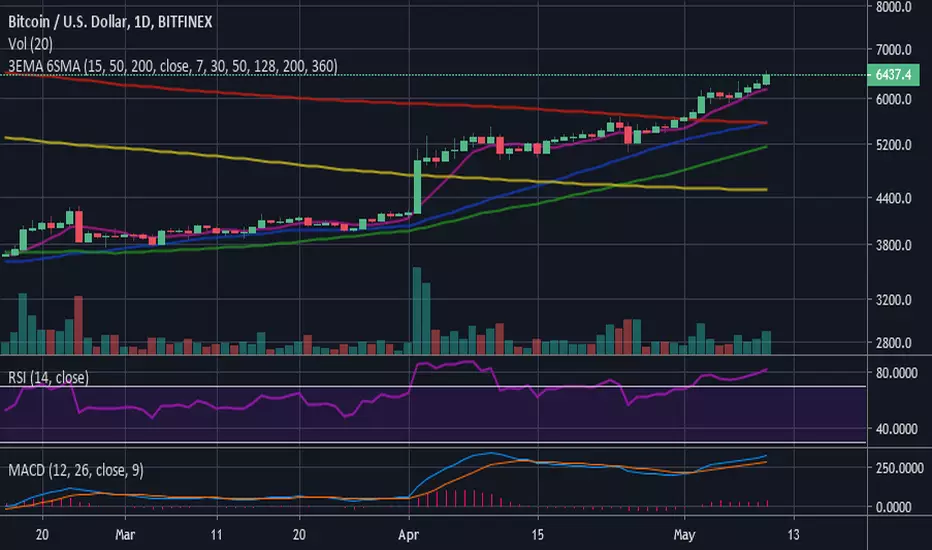
3 EMA (15-50-200) - 6 SMA (7-30-50-128-200-360)3 Moving Average Exponential - 6 Simple Moving Average . Crypto EMA - MA . 7 is a fast support or resistance, 15 confirmation support or resistance. 30 Important support and resistance . 50 institutional support or resistance. 200 institutional general trend, support and resistance , 360 general trend, support and resistance . The use of EMA or MA is according to your liking/trading plan