Premarket High/LowThe script draws the high and low of the premarket session and based on these levels the ATR is added and also displayed on the chart as lines.
You can change:
- The Session Timeframe
- The ATR Multiple
- If the Aftermarket Session should be included
ATR

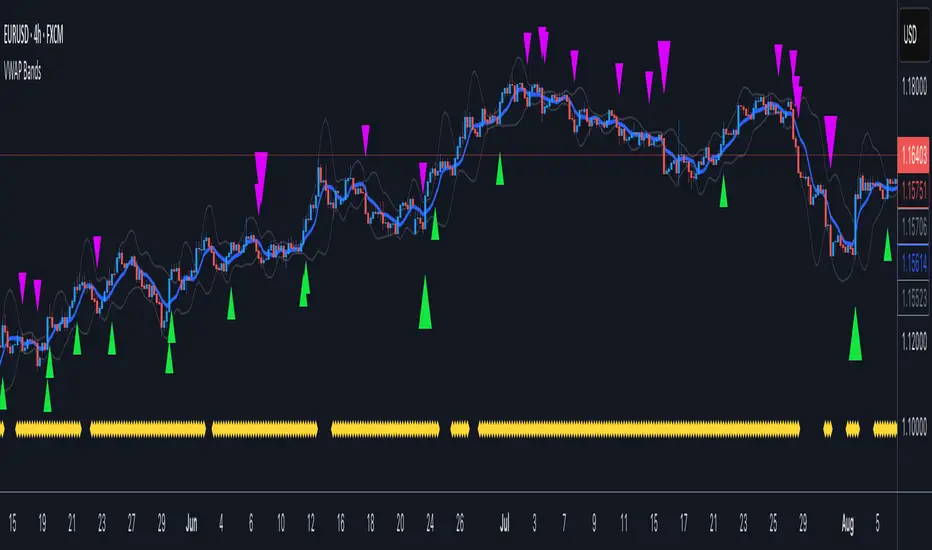
VWAP BandsOrginal VWAP script is from neolao, so big thanks to him.
Took the VWAP, added the Bollinger and Keltner channel squeeze. Also there is a criteria of Bands width.
Great tool to predict fast large moves within short periods of time.
Tried to keep the charts as clean as possible and easy to read.
If there are any questions Ill be happy to help or answer them.
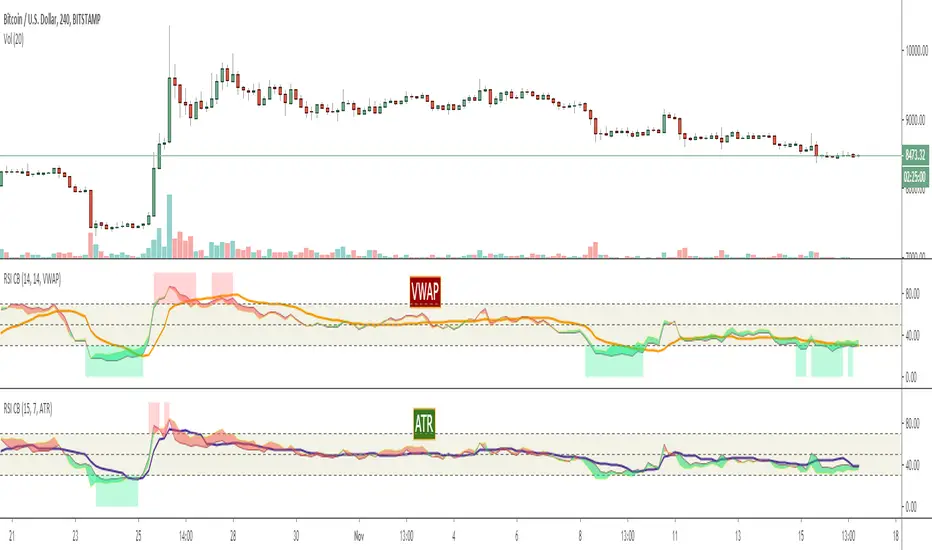
Relative Strength Index With Signals [ChuckBanger]Every developer should have there own Relative Strength Index indicator. This is my version. Relative Strength Index or RSI is the most used indicator. It is an momentum based oscillator which is used to measure the velocity as well as the change of direction of price action. Essentially RSI provides a visual mean to monitor both the current, as well as historical, strength and weakness of the market you trade. RSI is calculated as folowing: RSI = 100 – 100/ (1 + RS) where RS = Average Gain of n days UP / Average Loss of n days DOWN.
In this study RSI is weighted with ether VWAP (volume-weighted average price) or ATR (Average True Range) . The user can select that through the menu. RSI can have a reading from 0 to 100. The values of 70 or above indicate that an instrument is becoming overbought or overvalued and may be primed for a trend reversal or corrective pullback in price. The values of 30 or below indicates an oversold or undervalued condition.
The other significant signals are divergences with price and middle line crossovers. This version also has a signal line witch can be used as a signal when RSI crossover
UT Bot StrategyUT Bot indicator was inially developer by @Yo_adriiiiaan
Idea of original code belongs @HPotter
I just took code of Yo_adriiiiaan, cleaned it, deleted all useless pieces of code, transformet to v4 and created a strategy from it.
Also I added an input that allows you to swich to signals from Heiking Ashi. I saw that author uses HA for the indicator and on HA it look much nices then on real candles.
Do not add this strategy to HA candles, use usual candles and this checkbox.
Original script:

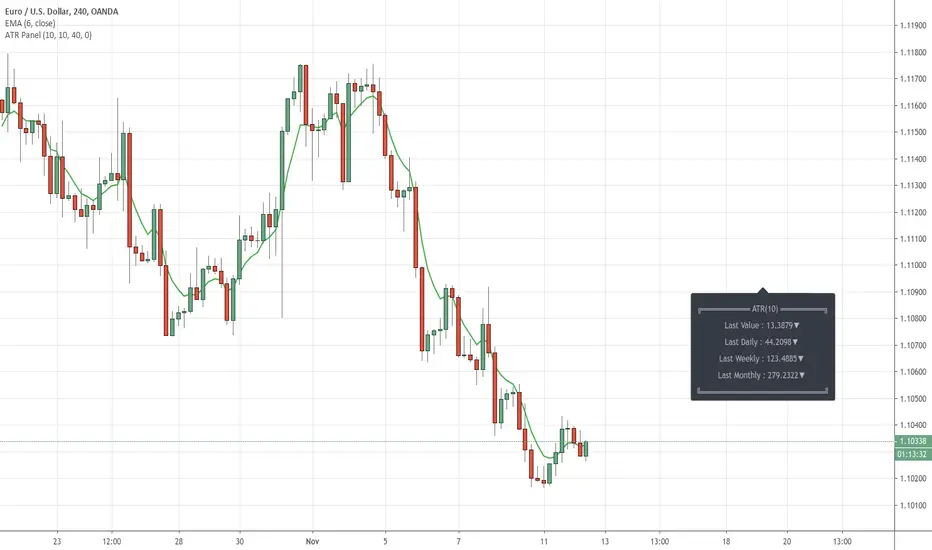
ATR Info Panel by JustUncleLDescription:
Display Last completed ATR values in a text information panel on the chart. These values are handy for calculating Stop Loss.
This script includes input offsets to optionally position the Panel, these can be Positive or Negative offsets.
References:
Thanks go to RicardoSantos for showing us the way to create a Panel with his Function - InfoPanel
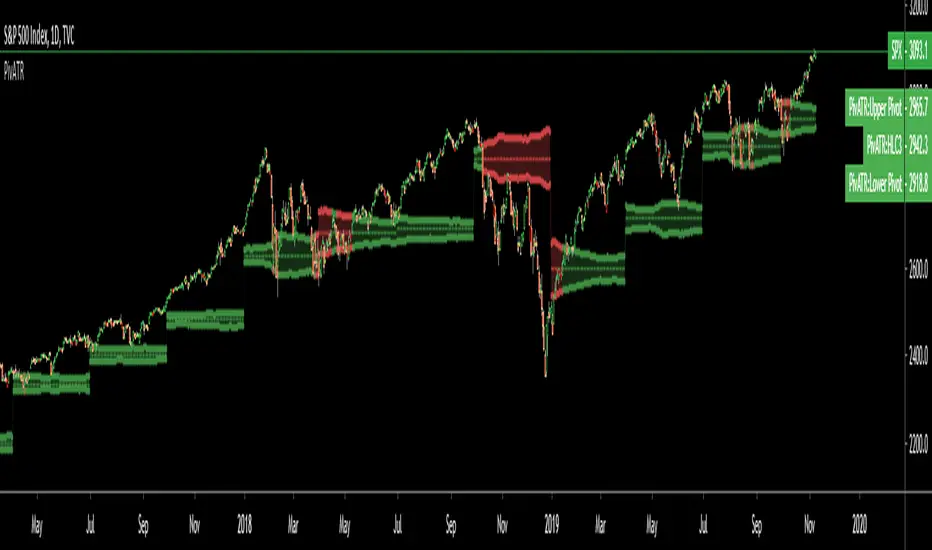
Adaptive Pivot (HLC3)SUMMARY:
Standard Pivot (HLC3) with ATR leeway added to make it adaptive to market volatility.
DESCRIPTION:
Adaptive Pivot is an indicator utilizing the simplicity of HLC3 Pivots as a turning point (and sometimes a trend indicator) while addressing it's fixed and inflexible nature.
Because the indicator is just a single line in the chart, the price may go near it but never touch it. Or it can go pass through it and never retest it again. In an attempt to lessen these from occurring, we can combine pivots with average true range (ATR). This is the specific formula I applied in this indicator:
>Upper Pivot = HLC3 + ATR
>Lower Pivot = HLC3 - ATR
This creates a kind of a range or cloud around the Pivot, making it possibly a more accurate indicator for market turning points.
ADJUSTABLE PARAMETERS:
The usual ATR parameters are included in this indicator:
>ATR_Length = input(14, title="ATR Length", minval=1)
>ATR_Smoothing = input(title="ATR Smoothing", defval="RMA", options="RMA", "SMA", "EMA", "WMA")
Added to the usual ones is this:
>ATR_Multiplier = input(1, title="ATR Multiplier", minval=0.1)
which modifies the extent of the ATR (similar to Chandelier Exit) as it is added/subtracted from the pivot values.
Pivot’s timeframe is also adjustable:
>Pivot_Timeframe = input("3M", title='Pivot Resolution')
Note: I did not lock the type to input.resolution to allow for more possible timeframes.
OTHER PARAMETERS
Indicator color will change to green when the open is above the HLC3 Pivot and change to red when the reverse is true.
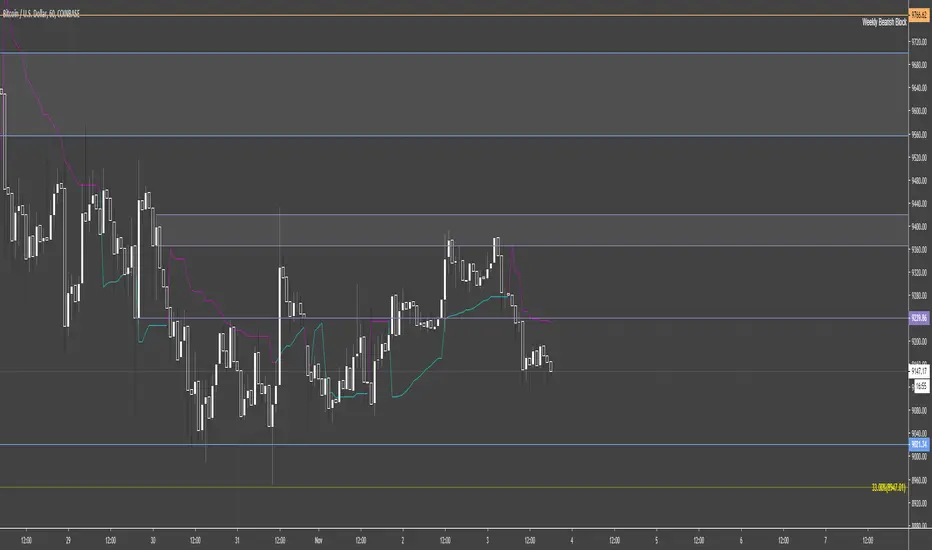
Baseline-C [ID: AC-P]The "AC-P" version of jiehonglim's NNFX Baseline script is my personal customized version of the NNFX Baseline concept as part of the NNFX Algorithm stack/structure for 1D Trend Trading for Forex. Everget's JMA implementation is used for the baseline smoothing method, with optional ATR bands at 1.0x and 1.5x from the baseline.
NNFX = No Nonsense Forex
Baseline = Component of the NNFX Algorithm that consists of a single moving average
Baseline ---> Meant to be used in conjunction with ATR/C1/C2/Vol Indicator/Exit Indicator as per NNFX Algorithm setup/structure. C1 is 1st Confirmation Indicator, C2 is 2nd Confirmation Indicator.
JMA (Jurik Moving Average) is used for the baseline and slow baseline.
A slow baseline option is included, but disabled by default.
The faint orange/purple lines are 1.0x/1.5x ATR from the Baseline, and are what I use as potential TP/SL targets or to evaluate when to stay out of a trade (chop/missed entry/exit/other/ATR breach), depending on the trade setup (in conjunction with C1/C2/Vol Indicator/Exit Indicator)
This script is heavily based upon jiehonglim's NNFX Baseline script for signaling, barcoloring, and ATR.
SSL Channel option included but disabled by default (Erwinbeckers SSL component)
POC (Point of Control) from Volume Profile is included/enabled by default for both the current timeframe and 12HR timeframe
03.freeman's InfoPanel Divergence Indicator was used a reference to replace the current/previous ATR information infopanel/info draw from jiehonglim's script. I'm not sure whether I like the previous way ATR info was displayed vs how I have it currently, but it's something that is completely optional:
Specifically: I am tuning this baseline/indicator for 1D trading as part of the NNFX system, for Forex.
DO NOT USE THIS INDICATOR WITHOUT PROPER TUNING/ADJUSTMENT for your timeframe and asset class.
Note about lack of alerts:
Alerts for baseline crosses (and other crosses) have been purposefully omitted for this version upon initial publication. While getting alerts for baseline crosses under certain conditions/filtered conditions that eliminate low-importance signals and crossover whipsaw would be great, it's something I'm still looking into.
SPECIFICALLY: There are entry, exit, take profit, and continuation signal components in relation to the Baseline to the rest of the NNFX Algorithm stack (ATR/C1/C2/Vol Indicator/Exit Indicator), including but limited to the "1 candle rule" and the "7 candle rule" as per NNFX.
Implementing alerts that are significant that also factor in these rules while reducing alert spam/false signals would be ideal, but it's also the HTF/Daily chart - visually, entry/exit/continuation signal alignment is easy to spot when trading 1D - alerts may be redundant/a pursuit in diminishing returns (for now).
//-------------------------------------------------------------------
// Acknowledgements/Reference:
// jiehonglim, NNFX Baseline Script - Moving Averages
//
// Fractured, Many Moving Averages
//
// everget, Jurik Moving Average/JMA
//
// 03.freeman, InfoPanel Divergence Indicator
//
// Ggqmna Volume stops
//
// Libertus RSI Divs
//
// ChrisMoody, CM_Price-Action-Bars-Price Patterns That Work
//
// Erwinbeckers SSL Channel
//

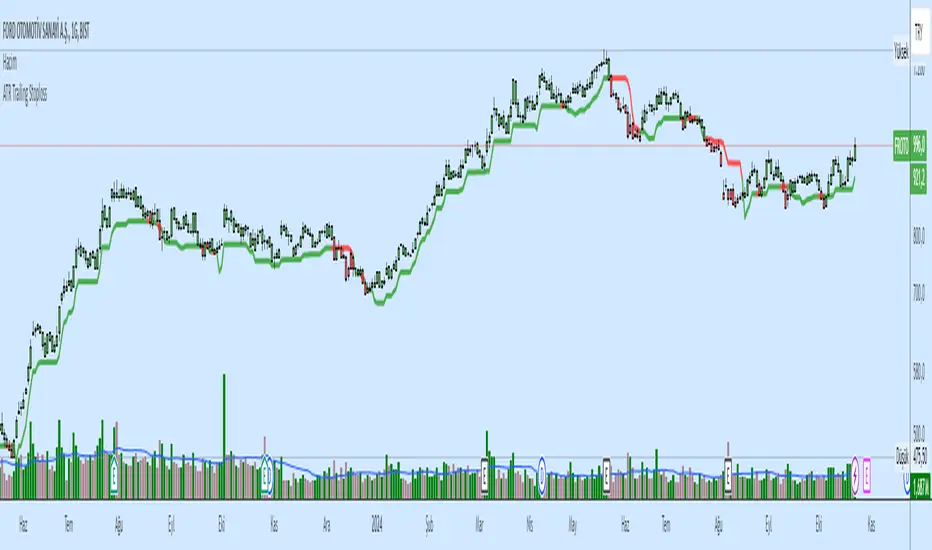
HeikinAshi_Atr_StrategyThis strategy combines HeikinAshi and ATR, have better performance on 5min XBTUSD pair after parameter optimization.
Different from the original HeikinAshi chart provided by Tradingview (which is Repainting ), this script does not use the HeikinAshi SECURITY function so there is no Repainting!
Try it by yourself !!

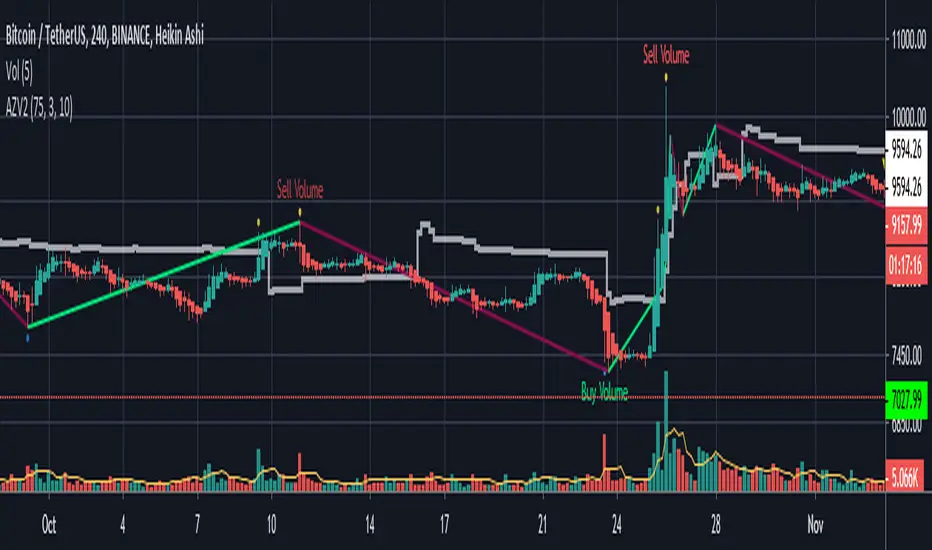
AZV Indicator
AVZ
Market is changing by 4 Factors which are (PVTTI - Price - Volume - Trades - Time
This indicator is a hybrid, with a combination of leading indicators and lagging trending indicators combined into one,and it's using mostly the 3 factors_ PVT which will help you getting good trades .
Volume :-
Leading indicators such as Volume Spikes , Average Volume Spikes (VolMA) ,and a special Spike calculation using RSI as a function with volume as a source .
Price:-
SemiLead indicators such as Aroon Indicator , RSI .
Time and Price Combination :-
Trend Recognition using Harmonic and Zigzag implementation from 'RicardoSantos' .
.
www.investopedia.com
Volatility Recognition : Using a special calculation to get the average called ( ZScore ) with Vwap implementation .
en.wikipedia.org
www.investopedia.com
How to use ?
This indicator is using number of bars of the last wave whatever if it's UP wave or Down wave .
Type number of bars on the specified area of the wave ( Bars Of Wave )
How many NO. Bar s to get accurate levels ?
1- If you are searching for a Support level , you have to count the number of bars of last UP wave from its low to it's high .
2- If you are searching for a Resistant level , you have to count the number of bars of last Down wave from its high to its low .
Buying Signal and Selling Signal ?
The indicator tries to identify levels that Buying Volume enter in the same way for Selling Volume .
ScalpSnakeA simple Scalping tool, based off of ATR multiples. Long above the line...Short below it. Adjust the length of signal calculation, and the Multiple of the Asset's ATR to loosen/tighten signals as desired...
Average True Range Multiplied (Volatility Stop)Plots crosses above and below the current price giving you the ability to quickly set your stop loss (or the 1st profit target) depending on a custom variable by which the average true range is multiplied with the option to specify the length as well as the type of the moving average (RMA, SMA, EMA or WMA) that are taking into account.
Optionally, you can disable showing of the crosses on the chart and just let the indicator display the calculated value by itself.

Range Force Impulse The "Range Force Impulse" indicator combines 4 useful indicators into one, freeing up chart real-estate and giving the trader insight into trend health, bull/bear commitment, range and volatility all at a glance.
The indicator consists of the following:
Direction - True Range and Average True Range columns shown above and below 0 depending on direction of the period's price
-- TR (gray) shows the current period's trading volatility
-- ATR (Impulse colors, see below) shows an EMA of TR over a specified length
-- Can be used to determine stops and targets (Example: Stop loss at prev close - ATR, Target at 2x ATR)
Index - Alexander Elder's EMA of (change(close) * volume), shows crosses above 0 (green) and below 0 (red), and intermediate signals
-- Shows bull vs. bear interest/commitment/dominance
-- Elder recommends EMA length of 2 for daily chart buy/sell signals, and 13 for weekly chart bull/bear dominance & trend direction signals
-- Intermediate signals are shown above 0 when falling (salmon), or below 0 when rising (pale yellow)
System - Range columns are colored using Alexander Elder's censorship system (green: do not short, red: do not long, blue: is up to you)
-- Shows overall trend health (Macd histogram and EMA up/down changes)


Relative Volume (RVOL) - ATR - R4RocketHello !!
This is a big upgrade on my earlier Indicator called "RVOL - R4Rocket". I could have updated the existing script, but there were two reasons for me to not do so.
1. I changed a lot of the previous code and added a lot of statistics like
a. Intraday Daily ATR Plot
b. Progressive (High - Low) Range as % of Daily ATR
c. % of RVOL Days in available chart data in any timeframe
d. In the new script RVOL Sectional has been removed as I did't find it very useful (Old script still has that feature)
e. And lastly and greatly, I modified the actual RVOL code (Huh ? Well I'll explain what I mean by this below)
2. Earlier I named my script just as RVOL. But then I though, well not everyone is going to search "Relative Volume" Indicator as "RVOL" Indicator, right? And Then during my second update I even tried to see whether I can change the script name but I couldn't figure it out. (Maybe it's not possible or maybe you know, "I DON'T HAVE ENOUGH BRAIN POWER" :P). So in order to make my script more accessible and easy to find for everubody so that it may add a little value to them in their trading, I'm changing the name of the script in this publication to "Relative Volume (RVOL) - ATR - R4Rocket". (Quite a big name, don't you think?)
Now as my reasons are out of the way, let me tell you about the indicator and the available options.
First let me explain what is RVOL basically. (Even after making 4 updates to my last script, I forgot to explain this......BIG BRAIN POWER :P)
It is calculated as (Cumulative sum of volume till time t from the start of the session) divided by the (Average of same period volume over a given number of days).
Lets say market starts at 09:30 am and right now the time is 10:00 am. So what RVOL does is it takes the sum of volume done from 9:30 am to 10:00 am for today and divides it by the same average volume that occurred between 9:30 to 10:00 in lets say X number of last days.
What this does is gives you the means to quantify how much everybody is interested today in the given stock w.r.t last X days. Generally higher the RVOL value - higher the public interest (due to some known or unknown reason like results / news / market condition etc) - and hence higher is the probability of stock movement on intraday basis. (Mostly everybody prefers to trade stocks intraday with RVOL > 2)
Now let's get back to the changes and the features.
1. It calculates Relative Volume
Adjusted in a way that the recent volume spike (e.g say due to quarterly result announcement or some other big news) don't skew the next day's
RVOL calculation. What this will do is, it will give you a good idea whether the stock is still in play the next day or a day after that.
LIGHTS !! CAMERA !! ANNNNNNDD ACTION !! (I love to watch movies, not very relevant here I know, but couldn't help it :P)
Now you can see in the image below the difference between old and new script RVOL calculations. This will help you to find out 2nd Day, 3rd Day plays.
To calculate RVOL first you have to choose your local exchange trading hours
E.g. NSE (India) trades from 09:15 to 15:30
NASDAQ (USA) trades from 09:30 to 16:00
LSE (UK) trades from 08:00 to 16:30 etc
Then you have to choose the RVOL period. This is the lookback period for cumulative volume average calculations.(I suggest using default value of 4 but it depends upon your preference and one more thing to note is that too high of a value will not even load the script due to some constraints that I don't know)
And last parameter is RVOL Trigger = What RVOL value YOU CONSIDER IMPORTANT. (I like 2 and if RVOL > RVOL Trigger then the columns will turn Green otherwise they will be Red. SIMPLE !!)
You can use any timeframe from 1 min to 1 Day. (Even custom timeframes like 2,4,6 will work fine)
1 min Chart
2 min Chart
2. It calculates Daily ATR in % terms of the day's open and plots it on intraday charts (and on daily charts too, if you want)
It's just what I just said - plain & simple.
You can see it in the image below. (Yellow dotted line and value in yellow color)
This will help you if you use profit targets or stop losses based on previous day's ATR values.
All you have to do is tick the Plot Daily ATR % box in inputs and choose the ATR Average.
3. The indicator calculates (High - Low) range as and when it extends throughout the day as the % of Daily ATR
This will help you quickly in finding which stocks are trading with extreme volatility.
Can be seen in the image below where the stocks trade @ almost 3 times or 300 % of the previous days ATR (Blue dotted line and value in blue color)
4. And lastly it gives you the statistic that will tell you how much is the average % of total days are RVOL days. (Did you get that ? It sounded great in my head but really don't know what I just said)
Let me tell you in terms of numbers. Lets say on daily timeframe Tradingview provides some 5000 bars worth of historical data. Out of that there were 16% days where RVOL was more than 2. Roughly speaking if you were to trade this stock every day then you would find on an average about 3 days per month with RVOL > 2.
(If you reduce the RVOL Trigger, then you will get more % RVOL days. In the second image if you reduce RVOL Trigger to 1.5 then you will have almost 27 % good trading days AS PER YOUR DESIRED & DEFINED PARAMETER OF RVOL TRIGGER = 1.5. Which translates to almost 6 days per month. You can play with it as you want and deem fit.)
RVOL Trigger = 2
RVOL Trigger = 1.5
“The goal of a successful trader is to make the best trades. Money is secondary.” – Alexander Elder
With best regards.
R4Rocket

ATR/EMA/Pivots/Crossover/LabelsScript for ATR, EMA , Pivots , EMA crossover, and Buy/Sell Labels for EMA Crossover
ATR Channel plotted from open of candle
3 channels with configurable length
+/- .5
+/- 1
+/- 2
EMAx5
Preset to 10, 20, 50, 100, 200. Lengths are configurable
Standard Pivots
Pivot with S1, S2, S3, R1, R2, R3
EMA crossover with Buy/Sell Labels
EMAs lengths are configurable for crossover
(Ability to change colors and turn on/off all of the above. Pic is only showing +/-1 ATR channel, EMAs, Pivot Point with S1/R1, and Crossover with Buy Sell Labels)
Find this useful? Accepting tips. Message me.
