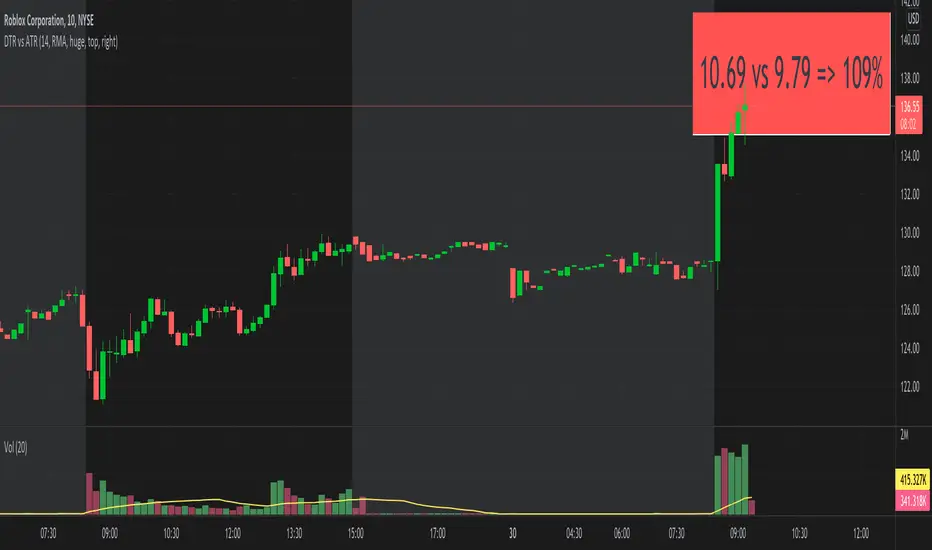
DTR vs ATRThis script shows DTR vs ATR (Today's True Range vs 14 days Avg True Range) along with percentage. The label automatically changes color based on percent value. <=70 is GREEN, >=90 is RED and between 70 & 90 is ORANGE.
The location of the script not stick to one place. There is no such a functionality to keep it static at one location (like top right corner). But I think that feature is coming soon. I may be wrong.
ATR
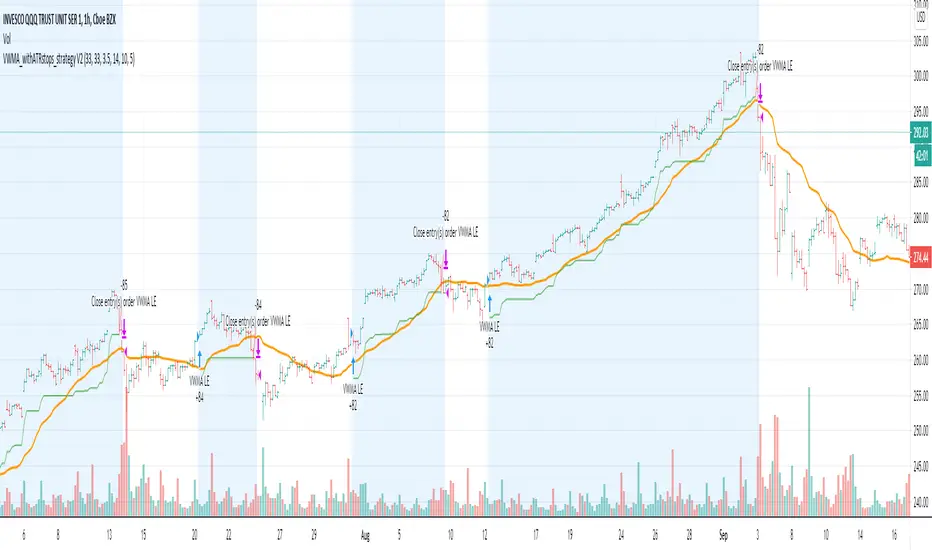
VWMA_withATRstops_strategyThis strategy follows the trend when price is above VWMA indicator. I have modified entry and exit rules to get most out of it.
Instead of entering LONG when price crosses above VWMA, I have used RSI(14) of VWMA . that way it skips the false signals. (some extent)
ENTRY
========
1. VWMA setting is 33
2. When RSIofVwma is above 30 enter Long ( and also checks if price already broke the ATR Stop above line )
Stop Loss and Exits
==================
1. Exit is when price breaks the ATR stop loss
2. ATR setting is set as same VWMA Length and multiplier is 3.5
3. STOP Loss that I mentioned in the settings is being used to calculate the how many units can be purchased based on risk of capital value.
Note: There is NO hard stop loss. having above ATR stop loss works as Trailing stop loss
Warning
=======
For the educational purposes only
Daily GAP StatsI did not write the script from scratch but rather started editing code of an existing one. The original code came from a script called GAP DETECTOR by @Asch-
First up: I am a trader, not a programmer and therefore my code most likely is inefficient. If someone with more expertise would like to help and optimize it - feel free to get in touch, I am always happy to learn some new tricks. :)
This script does 2 things:
- It shows daily gaps stats based on user inputs
- It shows color coded labels on gap days with additional information in tooltips ( important: make sure to read 'known issues/limitations' at the end )
User Inputs
==========
Although the input dialog is pretty straight forward, I do a quick rundown:
- Length: max lookback time
- Gap Direction: self explanatory
- Show All Gaps | Cont Only | Reversal Only | Off:
This refers to the way labels are displayed on gap days (again: make sure to read known issues/limitations!)
- Show All Gaps: does what it says
- Cont Only: only shows gaps where price continued in the gap direction. If you filter for gap ups and chose 'Cont only' you will only see labels on gap days where price closed above the open (and vice versa if you scan for gap downs).
- Reversal Only: you will only see labels for closes below the open on gap up days (and the opposite on gap down days)
- Off: self explanatory
- Gap Measure in ATR/PCT: self explanatory, ATR is calculated over a 10d period
- Gap Size (Abs Values): no negative values allowed here. If you filter for gap downs and enter 3 it means it will show gaps where the stock fell more than 3 ATR/PCT on the open.
- RVOL Factor: along with significant gaps should come significant volume. RVOL = volume of the gap day / 20d average volume
- Viewing Options: Placing the stats label in the window is a bit tricky (see knonw issues/limitations) and I was not sure which way I liked better. See for yourself what works best for you.
Known Isusses/Limitations:
=======================
- Positioning of the stats table:
As to my knowledge, Tradingview only allows label positioning relative to price and not relative to the chart window. I tried to always display the gap stats table in the upper right corner, using 52wk high as y-coordinate. This works ok most of the time, but is not pretty. If anybody has some fancy way to tag the label in a fixed position, please get in touch.
- Max number of labels per script:
TradingView has a limitation that allows a maxium of ~50 labels per script. If there are more labels, TradingView will automatically cut the oldest ones, without any notification. I have found this behaviour to be rather inconsistent - sometimes it'll dump labels even if there are a lot fewer than 50. Hopefully TradingView will drop this limitation at one point in the future.
Important: The inconsistent display of the gap day labels has NO INFLUENCE on the calculations in the gap stats table - the count and the calculations are complete and correct!

Chandelier Exit | SAR/Long Only (4CUP)As introduced by StockCharts.com, Chandelier Exit was developed by Charles Le Beau and featured in Alexander Elder's books, this sets a trailing stop-loss based on the Average True Range (ATR).
Chandelier Exit can be formulated as a stop-and-reverse (SAR) or as a traditional trailing stop-loss version shown by Stockcharts.com.
The main difference is that, in SAR version, the indicator is usually formulated in a higher of previous or spot indicator (HPS) for long and lower of previous and spot indicator (LPS) for short position.
This indicator is coded to show both the SAR version and the traditional one shown by Stockcharts.com (for long position) by simply clicking a tick in the Version box.
The ATR multiplier is relaxed to allow non-integer input, like 3.5, 4.25, ... for a greater flexibility to tailor your best-fit exit strategy.
If you find this indicator is useful to you, Star it, Follow, Donate, Like and Share.
Your support is a highly motivation for me.
Minimum Average True RangeI use ATR a lot when designing trading strategies, this way the strategy adjusts to the instrument in most cases instead of me plugging in special numbers.
However, ATR itself could get spiked by some violent moves. For this I have created MinATR which I am publishing here.
It is effectively ATR + minimum ATR over the last "Min Length" bars. (this is a parameter which I have defaulted to 50).
So use this the same way you use ATR, but it will also show the min ATR over the last "Min Length" periods.

ATR SL Buy/Sell w/ SMAsFirstly I'd like to state that this script's ATR buy/sell source is from the public script library here:
Additionally with the buy/sell signals from the original script, two more buy/sell conditions were added to give more entries/scaling in or out options. On top of that, two SMA lines were added, a 1 day moving average and a 5 day moving average.
This script is more so designed for scalping/scaling in and out of positions already made.
The SMAs add a level of confidence to the entry order, buy/sell triggers are not based on these SMAs.
For the confirmation on the entry, ideally you want a bullish cross on the SMAs, as well as the color of the SMA to correlate to the buy/sell color.

ATR_percentATR_percent is an indicator that i have created to find and be ready for volatility in stock or index. Works best in the 15 min time frame. Use case can be for Nifty and Banknifty.
Basically, whenever the ATR _percent line leaves the yellow line for upwards, market is falling. While if it is heading downwards, the market is rising.

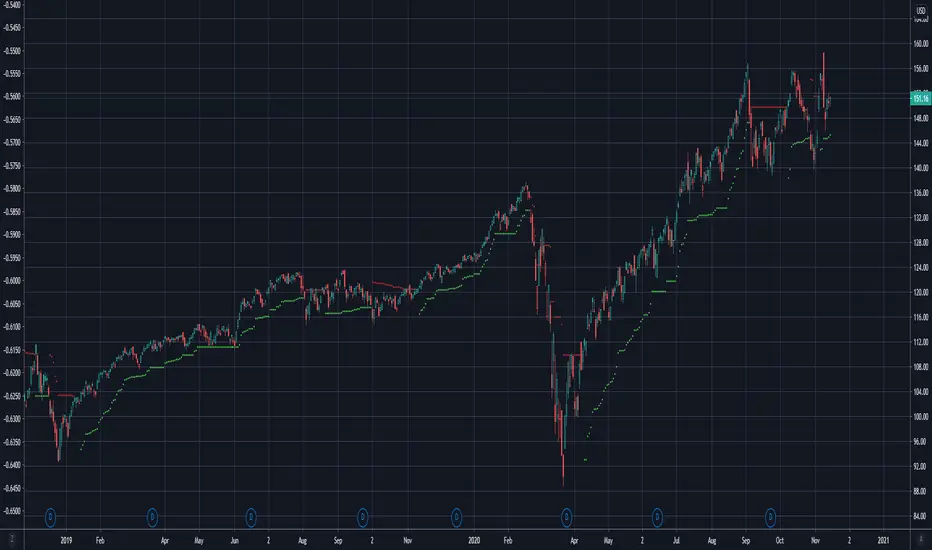
Wilder's Volatility Trailing Stop Strategy with various MA'sFor Educational Purposes. Results can differ on different markets and can fail at any time. Profit is not guaranteed.
This only works in a few markets and in certain situations. Changing the settings can give better or worse results for other markets. This strategy is based on Wilder's Volatility System. It is an ATR trailing stop that is used for long term trends. This strategy focuses on the trailing stop alone and goes long and short only when it goes above or below the trailing line. It is similar to Donchian channels except it does not include the certain period channel breakout, only the trailing signal. This is only the trailing stop and an attempt to show how well it works standalone as Wilder described.
In his book, Wilder recommends a multiplier of 2.8-3.1 and an ATR lookback of 7 periods along with a running moving average or otherwise known as Wilder's moving average. The calculation and programming part for the trailing stop varies everywhere. I opted to keep it as simple and accurate as I could think of and interpret from the book. The variations to these types of indicators are numerous unfortunately, but Wilder seems to be the original author of ATR and this ATR-based trailing stop. In his book he says to use the significant closing price or highest/lowest closing price for the calculation part but I also included the option of choosing the highest high and lowest low, and the option to choose various moving averages in case anyone wants to experiment.
Comparing this and Donchian channels, it seems that a 2.5 multiplier is somewhat similar to the middle band of DCs and a 3.0 multiplier is somewhat similar to a double length middle band of DCs. It's hard to say which is the better trailing stop for a long term strategy. It's hard to beat the simplicity of DCs but maybe some might find a need for more inputs in a trailing stop or maybe an ATR based one like Wilder's can work better depending on what setting or strategy it's used in.

Renko MTF - Traditional and ATRSomehow there aren't too many renko bars that have the traditional setting built-in so I put one up. This one has the option to choose between Traditional and ATR, the size number corresponds to the option that was chosen. And just in case if anyone wanted, I put up a multi-time frame option to choose the time frame the bars take place. D is for day, W is for week, flat numbers are in minutes, and leaving it blank looks at the current time frame the chart is in. The calculation comes from how Tradingview handles renko bars.
Renko bars don't paint a color unless the market moves a certain amount based on its settings. When the market moves up it turns green, if it moves down it turns red, simple color changes alone can say a lot. They're a good way to try to find trends somewhat objectively and seem to be a good way to eliminate time and can replace other time-based indicators that can whipsaw or lag. The bars have a tendency to repeat themselves so it's a good way to find trends. There aren't too many settings for the box size, most people either just choose 5, 10, 14, etc where as other indicators have many options that differ on different markets. The numbers can be chosen easily enough to pick a sweet spot with just a single input where other indicators such as MACD have multiple inputs to pick the right number that can make it difficult to choose from(although it won't be as precise as a MACD would sometimes but can be worth the objectiveness and consistency and same setting repeatability in different markets in my opinion). Some example strategies could be to use them as an alternative trailing stop, finding trends, a simple color change for entry and exit on top of other strategies, etc. It can do the job of many in an all in one price action type indicator(although not better all the time, it can come close enough). Despite all this, it does seem to depend on which time-frame it's being looked at, how TV does the calculation for it, and how one can use this with the lack of practical information on it out there.

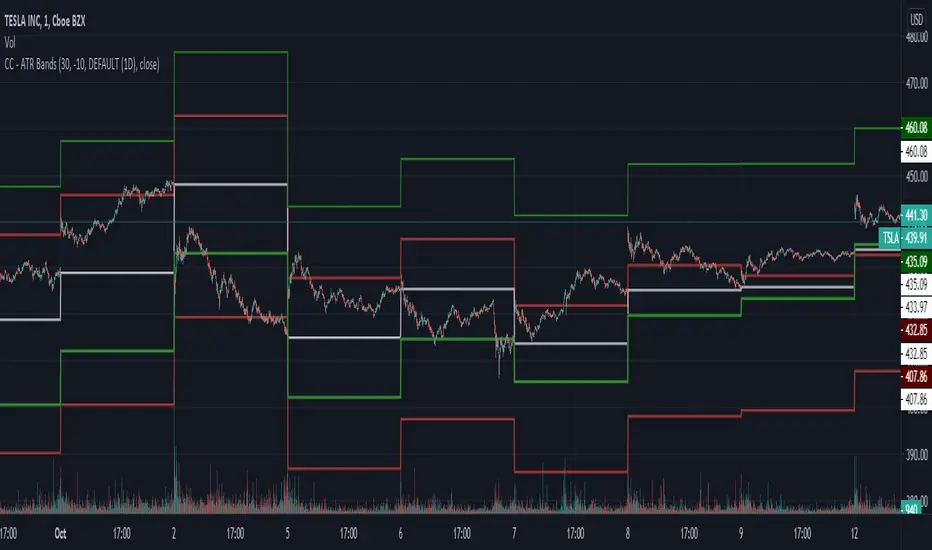
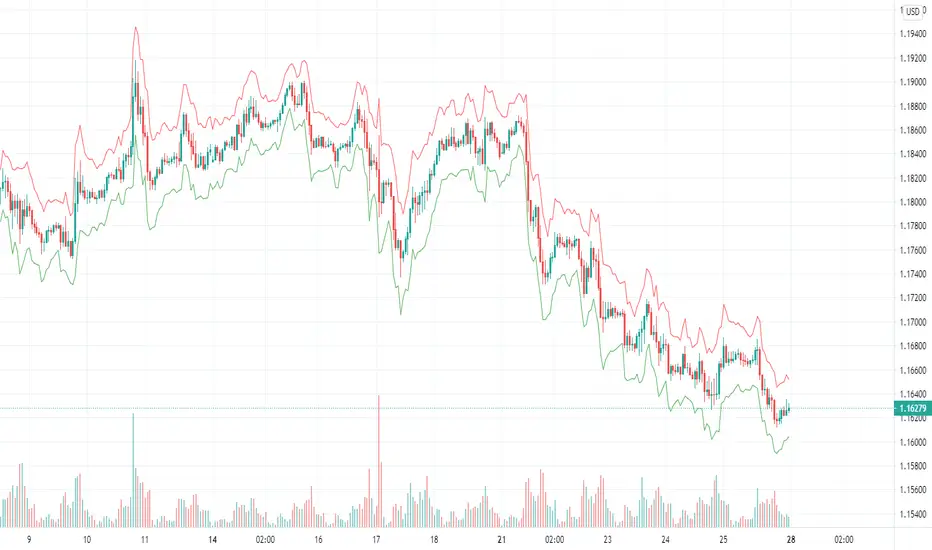
CC - ATR BandsPlots ATR bands around candles at any HTF resolution you desire, taken in through the inputs. The white line represents the open of the HTF, the red and green the expected boundaries. You can use the risk tolerance slider up/down to adjust how risky you want to be with the ATR bands.
I am not responsible for outcomes using this method, indicator or anything else. Please do your own due diligence.
Volatility Support & Resistance [LM]Hello guys,
I would like to introduce you volatility support and resistance horizontals. It draws line horizontal on high and low vhighly volatile candles. You can select lines on this timeframe and/or another one. It's done in the same spirit like my other indicators for horizontals
The colors are dynamic depending whether price is below or above the line:
for the current timeframe green is used for support and blue for resistance
for the other timeframe by default 4h orange is used for support and violet for resistance
There are various sections in setting:
general settings - here you can select ATR length, multiplier and show labels
show and hide section of the current timeframe
other timeframe
show and hide other timeframe horizontals
Any suggestions are welcome

ATR TRex [ipooya]To appreciate dear Mr.Khakestar efforts I have converted his mt4 ATR formula to pine script. All credits go to him.
you can view the ATR result of each candle in the past:
The first black number is the ATR of the M1 chart.
The second black number is the ATR of the M5chart.
The third black number is the ATR of the M15 chart.
The fourth black number is the ATR of the H1 chart.
The fifth black number is the ATR of the H4 chart.
The sixth black number is the ATR of the Daily chart.
The seventh black number is the ATR of the Weekly chart.
**and the second number of every line is live ATR ( current ATR candle)
What makes this ATR formula so different?
This formula invented by Mr.Khakestar and it shows the power of the price to move in each cycle of the chart. We can use it in RTM strategy and Price Action trading. To learn how to use it you need to learn TRex strategy (Presented by Mr.Khakestart for free in Persian).

quantized pin bar indicator with ATRAbstract
This script computes the strength of pin bars.
This script uses the corrent and the previous two bars to compute the strength of pin bars.
The strength of pin bars can be also comared with average true range, so we can evaluate those pin bars are strong or weak.
Introduction
Pin bar is a popular price action trading strategy.
It is based on quick price rejection.
Most of existing pin bar scripts only determine if a bar is a pin bar or not.
However, evaluating the strength of pin bars is important.
If price rejection is too weak, it is difficult to trigger trend reversal.
If a pin bar is too strong, we may enter the trade too late and cannot have good profit.
In this script, it provides a method to compute to strength of pin bars.
After the strength of pin bars are quantized, they can compare with average true range, price range and trend strength, which can help us to determine where are worthy for us to open trades.
Computation
Bullish hammer : current low is lower than ( previous high or current open ) and current close.
Bearish gravestone : current high is higher than ( previous low or current open ) and current close.
Bullish engulfing and harami : ( current low or previous low ) is lower than ( previous 2nd high or previous open ) and current close.
Bearish engulfing and harami : ( current high or previous high ) is higher than ( previous 2nd low or previous open ) and current close.
Parameters
Smoothing : the type of computing average.
Length of ATR : determines the number of true ranges for computing average true range.
ATR multiplier line : the threshould that a pin bar is strong enough. For example, if this value is 0.5, it means a pin bar with 0.5*atr or more is considered a strong pin bar.
one direction pinbar : set to 1 if you want the strength of bullish pin bars and bearish pin bars are cancelled. Set to 0 if you want to keep both strength of bullish pin bars and bearish pin bars; in this case, you may need to change the plot style to make both strength visible.
Trading Suggestions
Evaluate the strength of trend against pin bars. After all, a single reverse pin bar may be too weak to reverse the trend.
Timeframe : if atr is higher than 4*spread, the timeframe is high enough. However, if strong pin bars appear too frequent or price range is too small, going to higher fimeframe may be more safe.
Entry and exit : according to personal flavors.
Conclusion
The strength of pin bars can be quantized.
With this indicator, we can find more potential pin bars which human eyes and binary pattern detectors were leaked.
In my opinion, 0.5*atr is the most suitable streng of a pin bar for my trade entry but I still need to consider the direction of the trend.
You are welcome to share your settings and related trading strategy.
References
Most of related knowledge can be searched from the internet.
I cannot say the exact references because they may violate the rules of Tradingview.

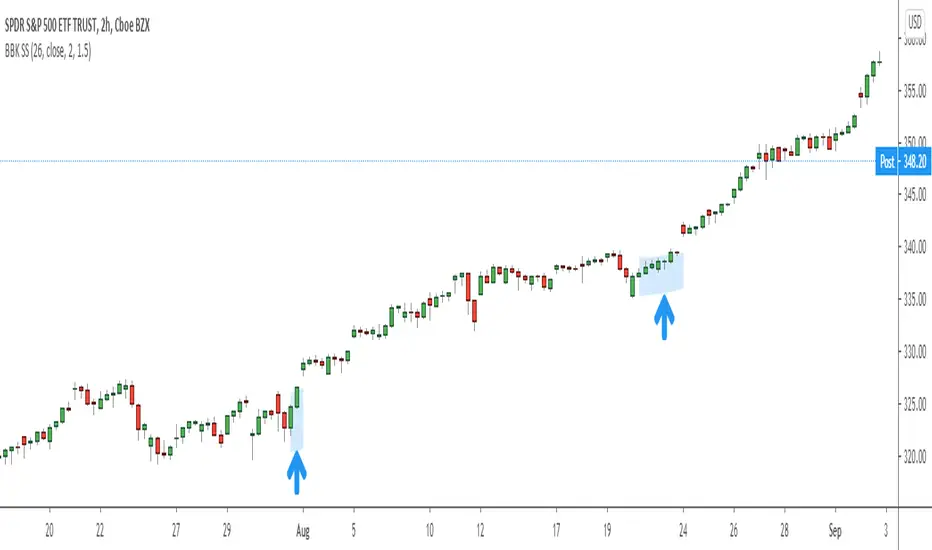
BB Keltner Squeeze Signal 1.0Made this to signal when the criteria is met for a "Bollinger Band + Keltner Channel Squeeze" signal. This is when one or both of the Bollinger Bands come inside the Keltner Channel. When this happens the bars are highlighted. The idea of this script is to clean up charts as much as possible.
Bollinger Bands are measures of standard deviation from a simple moving average. This is the distance that price travels as a whole over time. Keltner Channels are a measure of ATR from an exponential moving average. This is the average range of individual bars.
Both indicators measure volatility and when they contract indicate that price is consolidation. A very tight consolidation can often be a prelude to an expansion of volatility and price movement. It can be a signal for a potential breakout or confirmation one will be successful.
The actual Bollinger Bands and Keltner Channels are turned off by default but can be turned on in the script settings. I also use 26 as the default length but it can be changed.
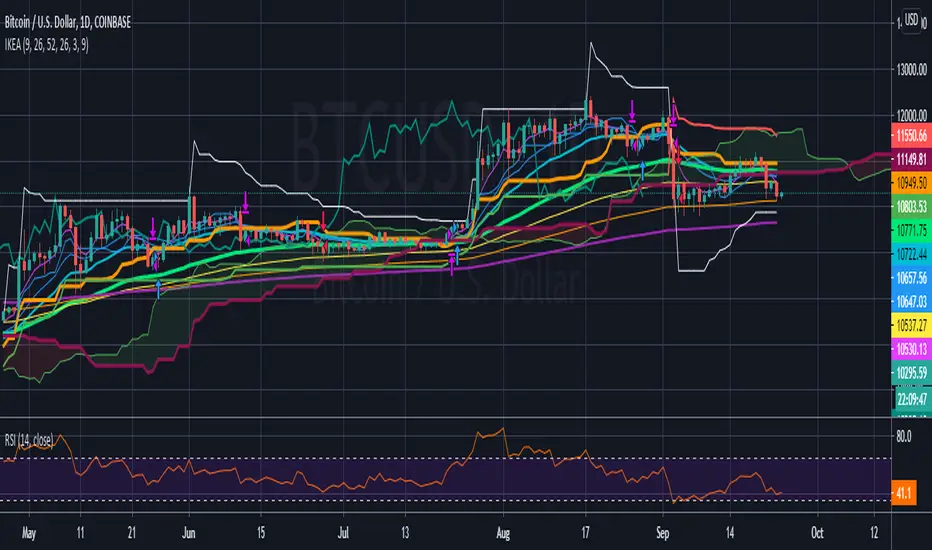
Profit Maximizer PMax Strategy - Long-ShortI developed a different strategy perspective for the Profit Maximizer PMax indicator prepared by Kıvanç Özbilgiç.
When you come to the settings section;
- You will see 2 options as Straregy Type. You can test the price and pmax intersections as different strategies.
- I added the Long-Short option for spot traders to calculate the profitability rate correctly. Spot traders should not choose this option.
Here you can set alarms on the original indicator with the parameters you find successful.
Türkçe:
Kıvanç Özbilgiç tarafından hazırlanan Profit Maximizer PMax indikatör için farklı bir strateji bakış açısı geliştirdim.
Ayarlar bölümüne geldiğinizde;
- Straregy Type olarak 2 seçenek göreceksiniz. Fiyat kesişimi ve pmax kesişimlerini, farklı stratejiler olarak test edebilirsiniz.
- Spot işlem yapanlar için karlılık oranını doğru hesaplayabilmeleri için Long-Short seçeneği ekledim. Spot işlem yapanların bu seçeneği seçmemeleri gerekmektedir.
Burada başarılı bulduğunuz parametreler ile orijinal indikatör üzerinde alarmlar kurabilirsiniz.

Daily Average True RangeIf you want to get an idea if the current range (low to high) is extended or not?
This script should help you to get an idea relative to the ATR.
Further comments you find in the script.
Feel free to modify upon your needs.
Jonas
NB: Due to issues around the "security" function, the recommended patch of Trading View was implemented.

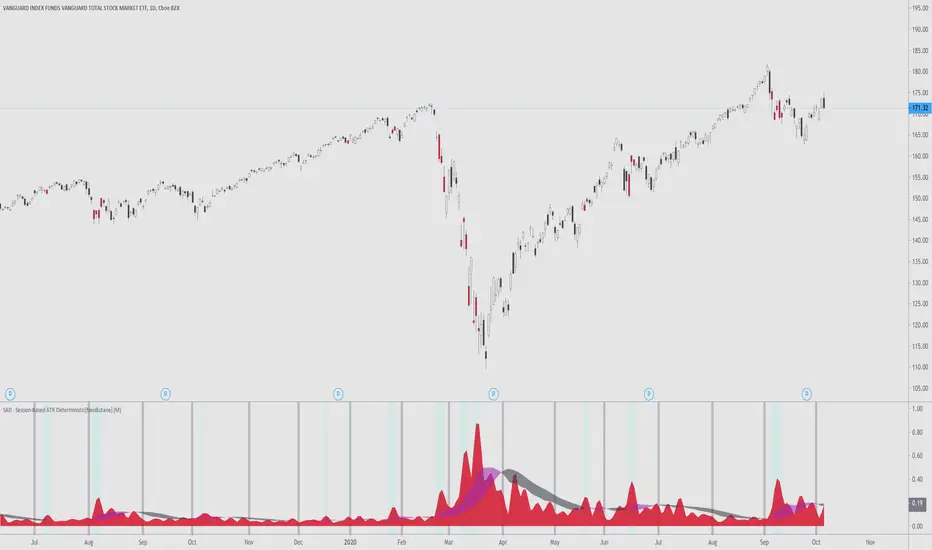
SAD - Session-Based ATR Deterministic[NeoButane]SAD - ATR with a utility tune-up.
Similar to ATR, SAD finds the true range of an asset. Unlike ATR, which is a rolling indicator, SAD is session based, simliar to VWAP. This gives it a great advantage over a regular ATR, where one must determine if their ATR level is statistically significant or not. SAD makes it easy for you to analyze statistical anomalies without having to pull out a calculator.
By breaking up ATR in sessions, it is able to be determined when price has moved an abnormal amount in a session deterministically. Noise is removed by a moving average filter, the weighted moving average. This was chosen over the EMA?SMA because an EMA would be to quick to change and the SMA would be too slow.
The ribbon's colors, purple, is active when volatility is rising. It is black when volatility is falling. You can see that this is directionally neutral.
Options to configure:
Timeframe
Ribbon dipslay
Session break display
[*}Bar coloring
Common examples of usage:
If you want to use this indicator, add it to your favorites and you can find it there.
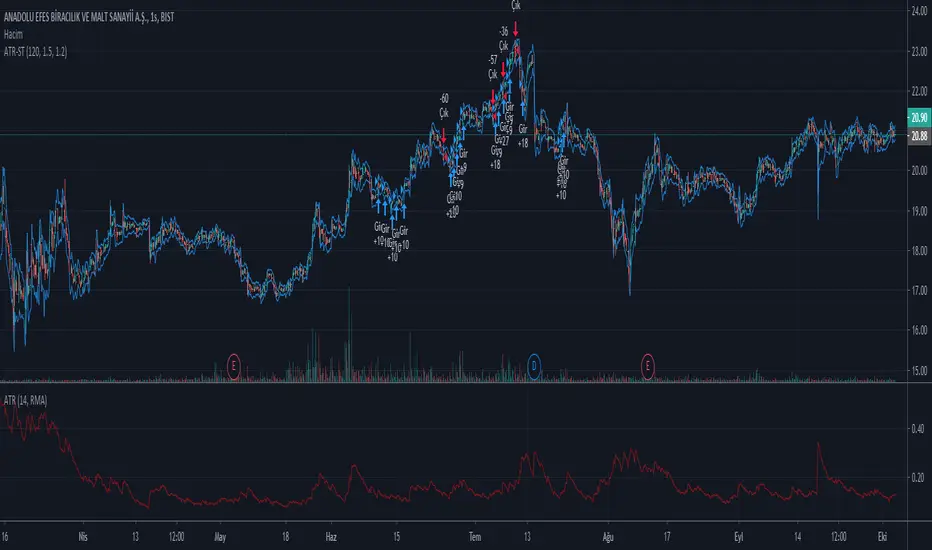
ATR Stop Buy StrategyThis strategy trial is let you to giving sell and buy orders with ATR (average true range) and an coefficent for them. it is my first strategy work, needs to be upgraded. USE IT WITH YOUR OWN RISK. IT IS NOT EVEN GUARANTEED TO WORK.
2 Candles Inside ATR2 agitated candles falling inside ATR range, awaiting possibly a big move.
Buy / Sell signals at combined high / low can be used as order with other as stop loss.
Counter trade, when this minimal stop loss is hit, is also as useful. However, wait till the SL candle closes, before opening position on the other side.
Works quite well on 15 mins chart, with settings of ATR duration 25 and multiplier 0.6. These settings are configurable, so feel free.

Realtime ATR Based TP-SL by KAANCThe indicator indicating ATR-based Stop Loss and Take Profit values, which I made inspired by the videos of Okan Yorgancı.
You can set the SL ATR value and TP ATR value from the settings.
----
Okan Yorgancı'nın videolarından esinlenerek yaptığım ATR tabanlı Stop Loss ve Take Profit değerlerini belirten indikatör.
Ayarlardan SL ATR değeri ve TP ATR değerini belirleyebilirsiniz.

ATR Stop Loss IndicatorIt’s very simple – all it does is calculate your stop loss with trailing stop price.
How It Works
Blue is the current ATR (pips).
Green is your trailing stop-loss price for Long
Red is your trailing stop-loss price for Short .
Settings
ATR Length:
Your ATR Length
Multiplier:
ATR multiplier.
For example, if you want to use a 2x ATR stop, set to 2.
ATR color zones with volume radar [LM]Hello Guys,
I would like to introduce you the ATR color zones with volume radar indicator. It's a fork of @GlobalMarketSignals "GMS: Mr. Yen's Color Zone" shout-out to him.
I have enriched it -> that zones are calculated based on the ATR and percentages as described below and volume radar on candle bars. You can select from which timeframe color zones are calculated.
Zones:
white line is the previous period close
red zone = +/- 20% ATR of previous period
yellow zone = +/- 40% ATR of previous period
green zone = +/- 60% ATR of previous period
blue zone = +/- 100% ATR of previous period
Volume radar:
lime = above volume MA average multiplied by multiplier up bar
maroon = above volume MA average multiplied by multiplier down bar
black = volume is decreasing but is not below half of volume MA
navy = volume is decreasing and is below half of volume MA
markers are shown when volume is increasing two consecutive candle in row in direction of the candle
Any suggestions are welcomed

Ichimoku Kinko Hyo Strategy+ EMA + 3ATRThis trading strategy uses combination of the Ichimoku Kinko Hyo system with Fibonacci numbers based 13/21/55 exponential moving average ( EMA ) crossover, giving good results in various trending assets !
Also has the Trend-following indicator combining SuperTrend with Chiku breakout from Ichimoku is added in order to confirm trend pattern.
The Ichimoku Kinko Hyo system includes five kinds of signal, of which this strategy uses the most recent of ones i.e. Tenkan Sen / Kijun Sen Cross and price crosses the Kijun Sen. As the Chikou Span, Senkou Span A and Senkou Span B are shifted into the past/future.
The Tenkan Sen, also known as the Turning or Conversion line, is a moving average of the highest high and lowest low over the last 9 periods in this strategy.
The Kijun Sen, also known as the Standard or Base line, is a moving average of the highest high and lowest low over the last 26 periods in this strategy.
The Chikou Span, also known as the Lagging line, is the closing price plotted 26 periods behind in this strategy.
The Senkou Span A, also known as the 1st leading line, is a moving average of the Tenkan Sen and Kijun Sen and is plotted 26 periods ahead in this strategy.
The Senkou Span B, also known as the 2nd leading line, is a moving average of the highest high and lowest low over the last 52 trading days is plotted 26 periods ahead in this strategy.
EMA is quicker to react to the current market price is because EMA gives more importance to the most recent data points. This helps the trader to take quicker trading decisions. Just used the laws of nature for EMA numbers: taken from Fibonacci sequence numbers 13/21/55
A SuperTrend employs ATR values to calculate the indicator values. The SuperTrend indicator combined with Chiku breakout from Ichimoku and plotted. The indicator line changes its color between green and red based on the price momentum in the underlying.