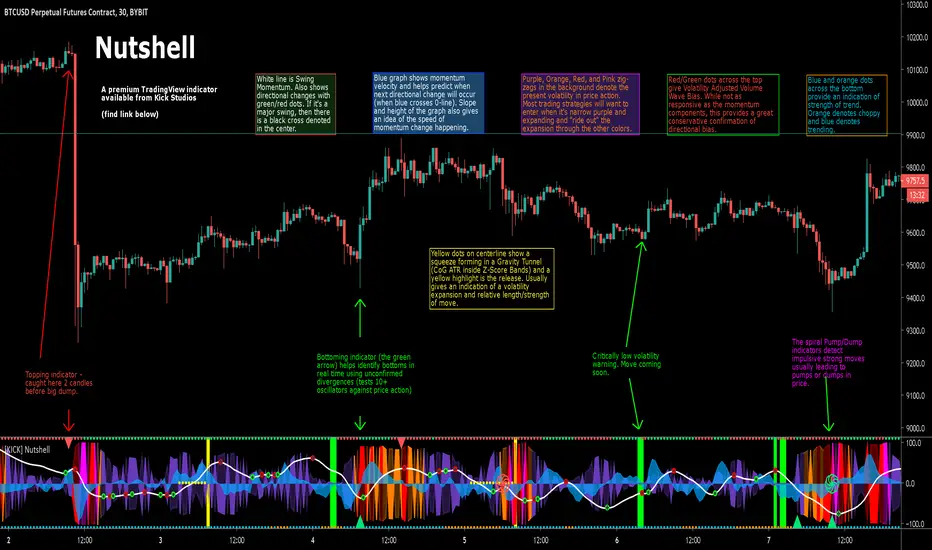
[KICK] NutshellThe Nutshell indicator gives you a true read of the market at quick glance – “in a nutshell”. The indicator contains components for volatility, momentum, trend strength, volume flow, price divergence detection, and impulsive move detection. This allows you to discern improved entry and exit points and accommodates many trading styles, systems, and strategies. It will work with most instruments and timeframes (though a few of the components do require volume, so some things like indexes won't work). The specific components of the indicator are:
Price action volatility indicator (the background zig-zags that are purple, orange, red, and pink). We are using a percentile ranking of ATR which gives a broader picture of the price volatility intra-bar than something like historical volatility percentile because it encompasses the range of price action and not simply the close of each bar. It is typically best to enter trades in the purple zone and “ride them out” through the higher volatility intervals.
Low volatility warning indicator (the bright green background highlights). When the ATR-PR is critically low, that means price volatility can only go on way (expand). These warnings are key to volatility strategies where knowing large moves are imminent is critical. While these warnings do not indicate the direction of the imminent move, there are plenty of other directional indicators present.
Gravity Tunnel Squeeze indicator (the yellow dots down the center-line, culminating in a yellow background highlight upon release). This is a slightly different take on the Momentum Squeeze indicator. In the traditional implementation a squeeze occurs when Keltner Channels move inside Bollinger Bands. In our implementation we use the Center of Gravity as a basis and measure when the Z-Score Deviation moves inside an ATR multiple. At the point of release you typically see an expansion of volatility, though often the signal presents earlier than an ATR-PR expansion. The longer the price action was under the squeeze the longer/farther the released price action is likely to go.
Swing Momentum indicator (white line with various red/green dots on it). The swing momentum indicator uses stochastic oscillators in the style of the ever-popular “Wave Trend” indicator to give a responsive read on the price action momentum. Green and Red dots indicate a change in direction of the momentum and when these occur in the extreme the center of the dot will be a black cross. Usually these extreme direction changes denote larger trend changes.
Momentum velocity indicator (blue area fill). This indicator can be used with the swing momentum line to determine how close/far the next direction change is away (every time the blue line crosses the zero-line a direction change occurs). The steeper the slope of this line also gives an indication of how fast the swing momentum is accelerating or decelerating.
Volatility Adjusted Volume Waves (the red/green dots across the top of the indicator) denote the current direction of price action based on cumulative volume weighted based on the ATR of the associated price action. While they are slower to respond than some of the other directional momentum components of this indicator, they can be treated as a pretty strong (conservative) confirmation of trend direction.
Strength of Trend (the blue/orange dots across the bottom of the indicator) is indicated with a Leaf-West variant of the ADX. Basically, if you see orange the price action is considered choppy and if it’s blue it’s trending. Depending on your time frame you can interpret these a bit differently. On smaller time frames you might consider the orange areas no-trade zones and wait until it turns blue.
Topping or Bottoming moves (Red triangles at the top or Green triangles at the bottom). We use a series of methods to detect likely reversal points (including checks for 10+ oscillator/price divergences). Since divergence is only confirmed after new local price highs/lows are established these reversal points won’t always be accurate, but we want to provide the earliest warning possible. Keep this in mind when taking action on them and wait a few bars for confirmation to be more conservative.
Pump and Dump warnings (red/green spirals that appear in the center of the indicator). Using 3rd generation moving average stochastics we get a very sensitive read on when they form patterns that typically precede large price action movements. These patterns work better for some markets than others so you will have to test with your instrument and timeframe to see how accurate they are for you. If you get one of these in conjunction with a red/green triangle and/or just after a low volatility or GT-Sqz release highlight, then buckle up.
The indicator also includes a number of custom alert conditions (all related to the above indicator components) that can be used to create alerts.
Use the link below to watch a tutorial video, request a trial, or purchase for access.
ATR
HG Scalpius - ATR Up/Down Tick HighlightHG Scalpius - ATR Up/Down Tick Highlight
This indicator highlights ATR(14) upticks (green) and downticks (red) and has the below application:
- If a new trend closing high (low) is made on a downtick in ATR, decreasing volatility mode turns on
If you come across or think of any other useful scripts for the HG Scalpius system please comment below!
Links to 2 previous HG Scalpius scripts:
-
-
Happy trading!
Code:
study(title="Average True Range", shorttitle="ATR", overlay=false)
length = input(title="Length", defval=14, minval=1)
smoothing = input(title="Smoothing", defval="RMA", options= )
ma_function(source, length) =>
if smoothing == "RMA"
rma(source, length)
else
if smoothing == "SMA"
sma(source, length)
else
if smoothing == "EMA"
ema(source, length)
else
wma(source, length)
ATR = ma_function(tr(true), length)
c = ATR >= ATR ? color.lime : color.red
plot(ATR, title = "ATR", color=c, transp=0)

Cracking Cryptocurrency - Quadrigo Position SizingCracking Cryptocurrency - Quadrigo Position Sizing
This indicator is designed to work in conjunction with our position sizing calculations pursuant to the Quadrigo Indicator.
This indicator will allow a trader to input their Account Balance and desired Risk % that they have decided, through their statistical analysis, provides them the greatest Return on Equity balanced against minimal draw down.
Once inputted, the Data Window will display the recommended USD Position Size. It will also pull the current price of Bitcoin, so that a recommended BTC Position Size will be calculated as well, making orders very easy to enter on exchanges that deal in BTC values for order value.
This indicator is optimized for the aesthetics of traders using TradingView's mobile app. With a simple glance you can determine your proper position size for any trade. This is helpful because the larger Quadrigo indicator can take up a lot of screen real estate when on mobile version.

Cracking Cryptocurrency - QuadrigoCracking Cryptocurrency - Quadrigo
An objective method of determining an initial Take Profit and Stop Loss, based on true market volatility and not arbitrary price levels. This indicator gives the user a powerful range of input variation, from Average to Median True Range and a myriad permutations of smoothing and look back lengths, to build an objective value from which to measure profit and stop levels.
This indicator also automatically calculates a recommended position size based on our position sizing methodology. Simply input your capital amount and desired risk level. This indicator will display your optimum position size in USD or BTC, even giving you the flexibility to select your desired exchange for BTC/USD conversion calculations.
Features & Functions
Set custom multipliers for Take Profit and Stop Loss Levels.
Select between Average or Median True Range Calculations.
Select smoothing type and look back length for True Range.
Input custom True Range Level for dialing in precise measurements.
Position Size Calculator.
Aesthetically pleasing display of Take Profit and Stop Loss Levels.
Aesthetically pleasing dashboard display of all relevant trade information including Potential Loss, Distance to Stop Loss, and TR Percentage, among other data.
Indicator displays quantity of position to be removed at each take profit for convenient order setting flow.
---
Purpose
To give clear objective stop losses and take profit levels based off price volatility rather than arbitrary price levels, percentage points, ticks, pips, etc.

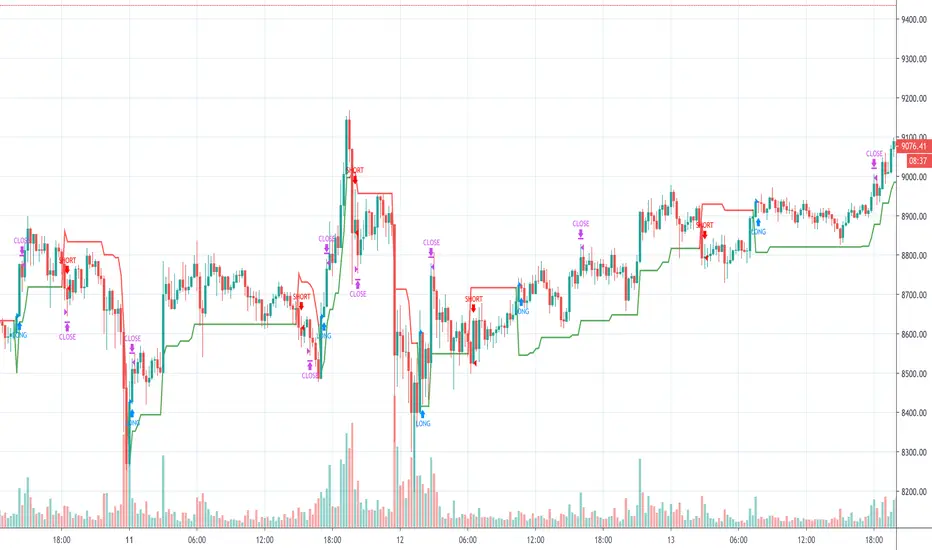
Support/ Resistance with H1 ATR - strategy mainline versionThis script using ATR (average true range) with source hl2 for create Support/ Resistance line
The color meaning:
- Green = Support line
- Red = Resistance line
Signal:
- If close price breakout Resistance line -> LONG signal will been active.
- If close price breakout Support line -> SHORT signal will been active.
Input setting:
Recommended default setting.
- Factor: amplitude for create Support/ Resistance line.
- Length: length of ATR.
- Offset: number of bar for check sideway or choppy market.
- Take profit: if you want test close position by profit.
- Stop loss: should not be missed.
- Open Position with Stop-Market type:
+ Open LONG position with high price and type Stop-Market.
+ Open SHORT position with low price and type Stop-Market.
Strategy setting:
Recommended default setting if you trade on Binance Futures or change Comission if you trade on another exchange.
Best backtest if:
- Max drawdown less than 10%.
- Min backtest time: 6 month.
- Avg profit: 10%/ month when no leverage is used.
Alert version:
1 - Select create new alert
2 - Condition:
+ eb BUY -> LONG signal
+ eb BUY close -> close LONG position
+ eb SELL -> SHORT signal
+ eb SELL close -> close SHORT position
3 - Option: recommended using only. Because the signal will be more accurate if the price close breakout successfully.
+ Always put stop loss position to avoid PUMP/ DUMP market.
// Note: alert version not free, send for me a private message on TradingView to get price and gain access.
Recommended:
- Using in M30, M45, H1 timeframe with default setting.
- Symbol: BTC
- Exchange: Binance Futures
- Order size: 10% wallet balance, maximum 25% wallet balance.
- Leverage: X2-X5, maximum X10.
---> I using 10% wallet balance and X2 only.

{INDYAN} Dual Supertrend#Always follow MAJOR trend, find MINOR trend as per Major trend and choose entry/exit accordingly .
Suppose major trend is blue so only go long while inside minor trend is green, when it turns RED exit from long but dont short in BLUE i.e. major uptrend and vice versa for downtrend i.e. major should be pink and minor should be red for short and when it turn green under pink just exit the sort.
By default major trend is set to 15 Minutes which is generally good for index, and 1 hour should be for stocks. You can change it through settings.
My recommendation for index is major should be 15 minutes and minor 5 and for stocks major should be 1 hour and minor 15 minutes.
It can be used with index,stocks and commodties.
Hope it will help my trader friends.
Happy Trading...
Love INDYAN

cATRpillar Strategy**This is my first strategy on the Pine editor, any tips or tricks from the community would be awesome!
This strategy was developed from my indicator "cATRpillar". it uses the ATR range values to determine entry, and uses EMA values to determine an exit if the market goes against it.

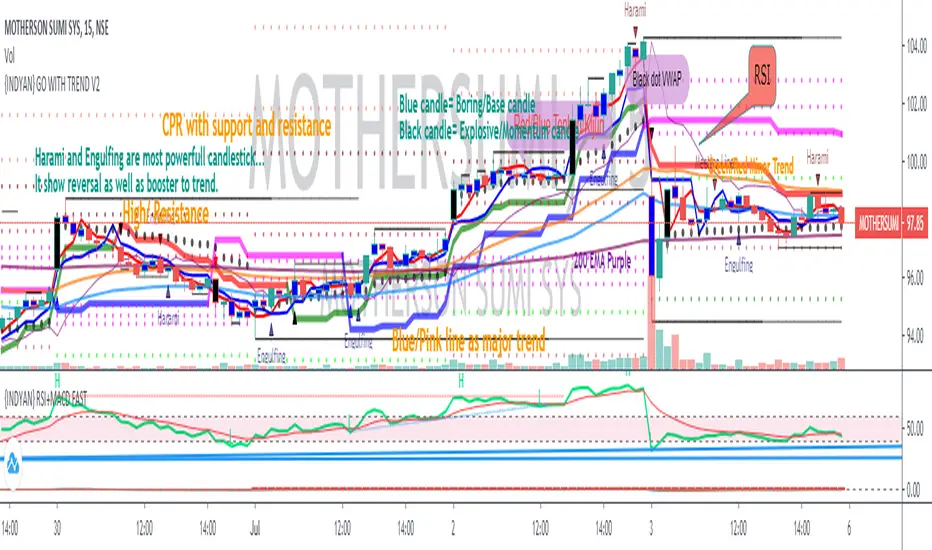
{INDYAN} GO WITH TREND V2This indicator has almost everything for intraday trading . There are two supertrends one with higher time frame and one at lower time frame, Due to which we can recognize reversal. If higher time frame supertrend is showing uptrend and minor is showing downtrend then better to avoid taking any trade in between. Both trend should be in same direction.
Tenkan and kijun is there to verify the trend authencity, check where the tenkan and kijun crossover is there or not at the time of reversal signal given by supertrends. It will boost trading chances.
Also VWAP is placed to know the current situation, If price is below VWAP go for sort if all other things match as above said.
HEMA LEMA is a EMA band and i found that it act as support and resistance, If price breaks channel with volume and sustain above/below for 2 candle close (TIMEFRAME AS SYMBOL).
Also placed FAST EMA to recognize the fast moving trend.
Pivot with CPR is there to trade on basis of CPR and Pivot.
For demand and supply traders, they can use blue and black candle for marking up zones. Blue is boring/base candle and Black is explosive candle.
I hope it will help my trader friends to recognize the trend and reversal.
Let me know if anything more we need to include or remove to make it better for everyone.
Happy Trading... Love INDYAN
#intraday
#hema-lema
#pivot
#cpr
#supertrend_reversal
#demandzone
#supplyzone
#tenkansen
#kijunsen
cATRpillerThis indicator is used to identify range breakouts using an ATR multiplier. My first script, Im sure there are indies out there like this, but this my favorite way to identify breakouts and trends.

ATR Percent of PriceShows:
1. The current True Range, taken as ATR(1) as % of the close price
2. The SMA(14) of the current True Range, taken as ATR(1) as % of the close price

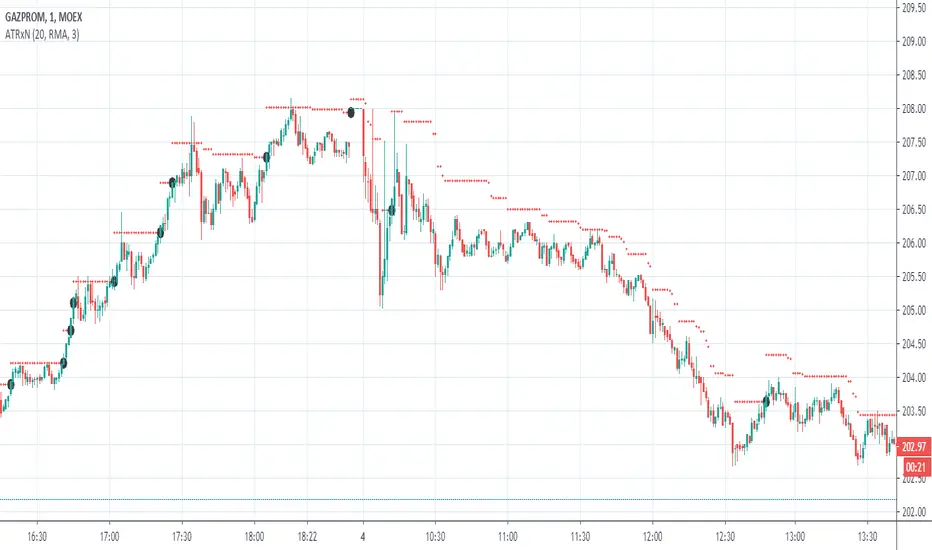
ATRxNIndacator shows price range calculated as previous closing price +/- ATR * multiplier
Setup options: multiplier, average type (RMA, EMA,SMA,WMA), Source and number of point to average
Индикатор показывает диапазон цен рассчитанный как цена предыдущего закрытия +/- ATR * множитель
Настраивается : Множитель, тип усреднения (RMA, EMA,SMA,WMA), Источник и Длина усреднения
ATR Trailing Stop advanceHello Traders,
The average true range (ATR) is a technical analysis indicator that measures market volatility . The ATR indicator is easy to use and gives an accurate reading about an ongoing trend that very effective.
I. Signals are used for entry
- Entry your long position (buy) when price crosses above the ATR trailing stop line.
- Entry your short position (sell) when price crosses below the ATR trailing stop line.
II. ATR Trailing Stops Setup
- The ATR period is used to adjust the sensitivity of the ATR trailing stop line. With larger period, the ATR will "smoother" but will signal slower than the price.
- ATR multiplier is a multiple of ATR trailing stop.
- If you want to backtest with trailing take profit, you can tick the box “test with trailing?”. It will affect 2 parameters which are: Trailing point and trailing offset. Where: Trailing Point is the trigger point, the distance from the entry price. Trailing Offset is the take-profit price, which is the distance from the Trailing Point.
III. A few ATR trailing stop configurations, you can use for backtesting:
1. BTC /USDT (M15):
- ATR period: 80
- ATR multiple: 1.91
- Trailing point: 63
- Trailing offset: 10
2. BTC /USDT (M30):
- ATR period: 71
- ATR multiple: 1.63
- Trailing point: 60
- Trailing offset: 10
3. ETH/USDT (M30):
- ATR period: 90
- ATR multiple: 1.81
- Trailing point: 1.12
- Trailing offset: 0.15
4. XRP/USDT (M30):
- ATR period: 125
- ATR multiple: 1.61
- Trailing point: 0.0016
- Trailing offset: 0.0003
IMPORTANT:
Generally, ATR trailing stop still fails in a sideways-moving market. Be Careful and research the strategy before making a buy/sell order.
Hope you enjoy it. We look forward to hearing from you so we can improve this strategy.
Thank you,
ATR Stop Loss LONG/SHORT by melihgulerYou can monitor the stop loss level according to ATR in 2 ways (Long/Short).

BOT Buddy v3Bot Buddy is a script that uses customized indicators to give out signals for a number of different assets with high probability and really good risk to reward.
Bot Buddy will provide:
- Entry signals with alerts
- Stop Loss
- Two Take profit targets
- Break Even signals with alerts
How does it work?
-Uses a Trend direction to find trades going in the right direction
-Uses a customized Volume, EMA's, candle pattern and ATR to find entries
Signals:
-Green Arrow-long
-Red Arrow-short
-Red line- STOP LOSS
-Blue lines- Take Profits
The Script is designed to be very user friendly as it'll post all the information you'll need for each trade on every entry signal.
For access, please DM us or visit the link below in Signature.

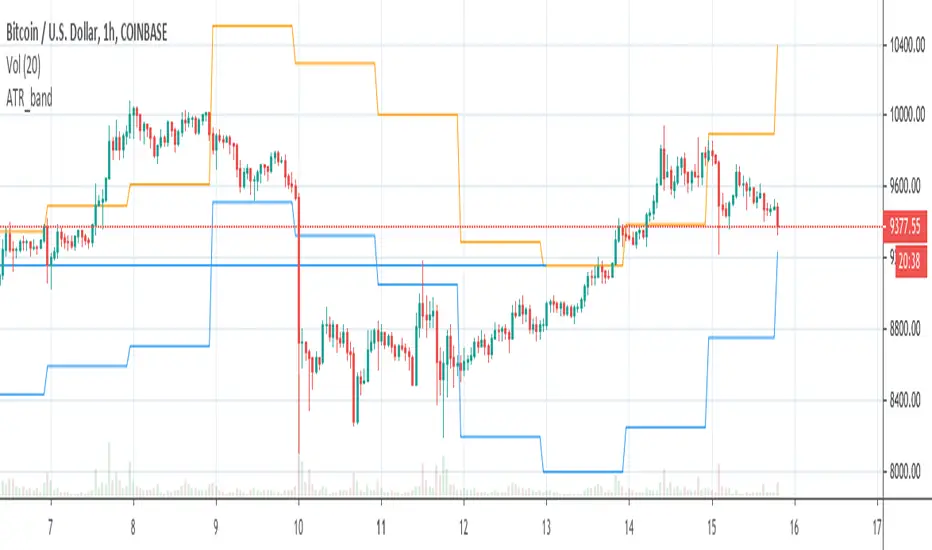
ATR_bandCreates lower and upper band on BTCUSD chart based on ATR value of the previous day and daily open of the current day
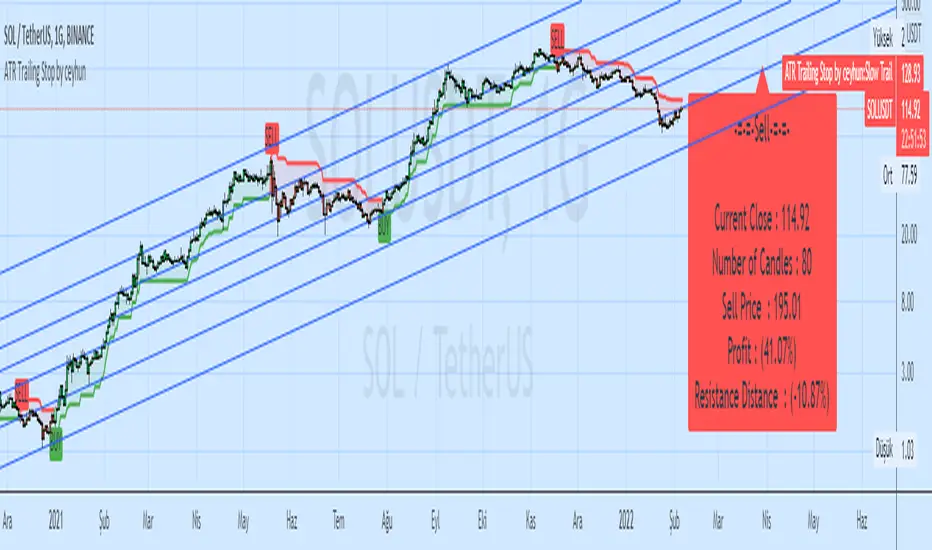
ATR Trailing Stop by ceyhunSame coding only coloring and information panel was added.
CDC ATR Trailing Stop V2.1 (2013)
//Barcolor
Green = Trail1 > Trail2 and close > Trail2 and low > Trail2
Blue = Trail1 > Trail2 and close > Trail2 and low < Trail2
Red = Trail2 > Trail1 and close < Trail2 and high < Trail2
Yellow = Trail2 > Trail1 and close < Trail2 and high > Trail2
//It gives White color where there is deterioration.
//InfoPanel
Buy Price = Blue draws the circles at the purchase price.
Profit Long>20 = Risk level taken as a percentage, I got the highest 20%, you can determine as you wish.
Sell Price = Red draws the circles at the purchase price.
Profit Short>20 = Risk level taken as a percentage, I got the highest 20%, you can determine as you wish.
ATR _NormalizedThis script is good to use with Williams %R indicator, to find out when price has bottomed out.
ATR has to be over 90 and Williams %R ( lenght 52 ) has to be over 95 to find out level around which one is good to buy.
You can check back, to see that this worked very well over history. Best way to use this 2 indicators is with DCA ( dollar cost average ), as area where to buy can go a little bit down and up for as long as few months. So dont just jump in, use DCA .


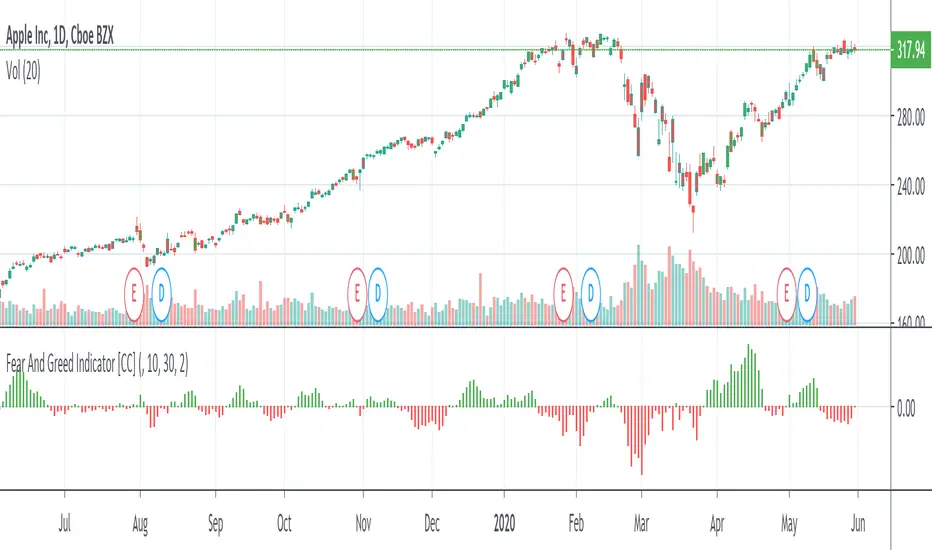
Fear And Greed IndicatorThe Fear And Greed Indicator is a very popular indicator on the Bloomberg platform and since I didn't have actual source code to work with, this is a very close approximation of that indicator. Let me know if you spot any discrepancies with the original and I will do my best to fix them.
For buy and sell signals it is pretty straightforward. Just buy when the green (greed) is in control and sell when the fear (red) is in control
This was a special request so let me know if you want to see more scripts from me or if you want something custom!
Sicko Mode v3.0The goal of this indicator is to determine when volatility is trending in a specific direction.
This indicator leverages the ATR over a certain metric where the exterior lines represent X amount of ATRs from the open of a consecutive candle sequence and X ATRs from the swing low or swing high over a period of X candles.
The up and down arrows represent a break of these support and resistance lines where both lines are breached in a 5 candle period.
For best results please use with the current trending time frame as that is when ATR is most relevant.
PM us to obtain access or use the contact information provided in my signature field in the link below.

BKN ATR Trading RangeThis script allows you to view ATR extremes based on the open of the candle. Average True Range gives you the average move of an asset during a period of time. If you're viewing the Daily timeframe , The Average True Range represents the average size of a move that occurs in a one day timespan over the specified period. Reaching the upper or lower boundary could signify that a trend is reaching exhaustion as the asset is reaching it's expected move for the period.
You can manually set a timeframe to use for the ATR value. By default, we are viewing a Daily timeframe . For lower timeframe trading you may want to look at the hourly or four hour ATR range.

GODMODE GUPPY ATRThis script includes volatility calibrated ATR ( Average True Range )
features :
* Custom time intervals for ATR
( example you can use 45 min ATR on any time frame for swing plays & you can use 15 min ATR on lower time frames like 15 min for scalping )
* Smooth Guppy : helps to understand support and resistance also helps to understand trend direction ( Red is bearish trend & Blue is bullish trend )
* Triangle shapes : Triangle shapes are extra confirmation for trend changing
HOW TO USE :
"BULL" signal is a bullish breakout
&
"BEAR" signal is a bearish breakdown
Stops above or below ATR as per the signal
Guppy shows trend direction
So,
when guppy is blue longs are profitable
and when red shorts are profitable
Buy/Sell on the candle close confirmation of signal is set on candle close
For access DM
*******************

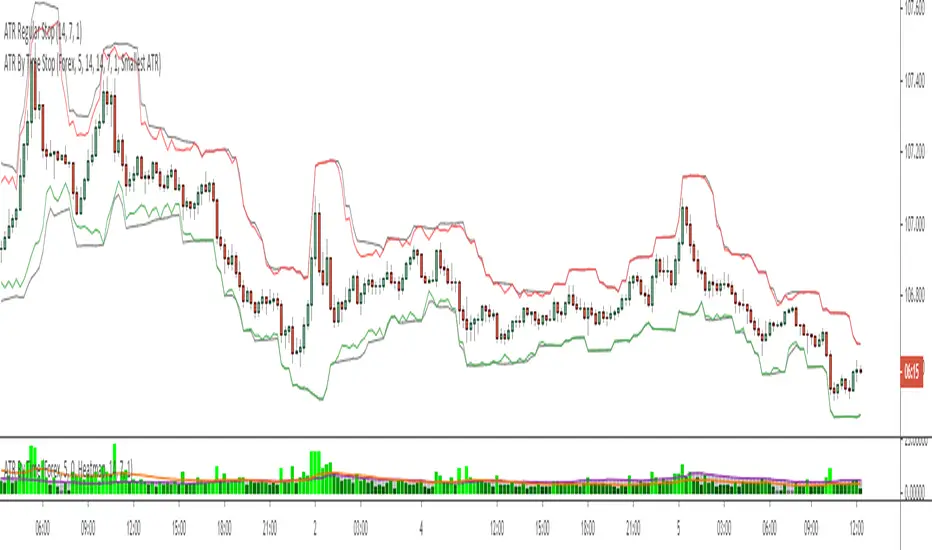
ATR By Time [Chart]What is ATR By Time (Chart)?
This premium indicator is a companion script to my ATR By Time indicator.
This companion script draws your stop loss price to the chart directly. In the above example, the black line represents a regular 1x ATR stop loss above and below price action, while the colored lines are the 1x ATR By Time indicator values when set to use the "Smallest ATR" in the settings menu.
When set to "Smallest ATR", the script calculates the regular ATR and the ATR By Time of Day and compares the distance of the two values. It then selects whichever value is smaller to be used as the stop loss, and adds or subtracts it to the most recent swing high or low (or the closing price if desired).
This allows for tighter stops and larger position sizing during certain times of day for aggressive traders when set to Smallest ATR, or wider stop losses during more volatile periods of the day for conservative traders when set to Largest ATR.
Stop Loss Distance Options:
- Regular ATR
- ATR By Time
- Smallest ATR
- Largest ATR
More Information
Similar to my RVOL By Time indicator, the ATR By Time indicator works on any market that has consistent trading session lengths . So it works best on Forex & Crypto, but also works on some Stock and Futures markets.
Instead of calculating the ATR based on recent price data like the regular ATR indicator, it calculates an ATR value for each candle based on that candle’s time of day .
For example, if you set the Lookback setting on this indicator to 14, then instead of calculating the ATR based on the past 14 candles, it will calculate an ATR value based on the past 14 trading sessions for each candle (as an average).
So in other words, your 10:00AM candle will show the average of the past 14 10:00AM candles rather than the past 14 candles leading up to that 10:00AM candle.
This is extremely useful for day traders in particular as it allows you to gauge the average range of candles during certain times of day instead of only by the most recent price action.
It also draws a regular ATR (optional) – so this is essentially an enhanced ATR script that gives you multiple readings on price volatility.
If you are interested in trying the script or you want more information on how the script works, there is more information available on my website including instructions on how to apply for a free trial: ATR By Time Feature Page .
Good luck with your trading!