Volume-Price Shift Box (Lite Version)Description
This indicator is a clean and intuitive visual tool designed to help traders quickly assess the current balance of bullish and bearish forces in the market.
It combines volume, price movement, VWAP, and OBV dynamics into a compact on-chart table that updates in real time.
This version focuses on the core logic and visualization of momentum and volume shifts, making it ideal for traders who want actionable insight without complex configuration.
How It Works
The script measures the combined strength of multiple market components:
VWAP trend indicates price bias relative to fair value.
OBV (On-Balance Volume) tracks volume flow to confirm or contradict price movement.
Volume ratio compares current volume to its recent average.
Momentum evaluates directional price movement over a configurable lookback period.
Accumulation / Distribution (A/D) Line estimates buying or selling pressure within each candle:
↑ — A/D is rising (buying pressure is increasing)
↑↑ — A/D is rising faster than before (acceleration of buying)
↓ — A/D is falling (selling pressure is increasing)
↓↓ — A/D is falling faster than before (acceleration of selling)
Each of these components contributes to an overall shift score.
Depending on this score, the box displays:
🟢 Bullish Shift — strong upward alignment
🔴 Bearish Shift — downward alignment
⚪ Neutral — mixed or indecisive conditions
Key Features
Compact on-chart information box with color-coded parameters
Combined volume-price relationship model
Configurable lookback and sensitivity controls
Real-time shift strength and trend duration tracking
Adjustable EMA/SMA smoothing for all averages
Lightweight design optimized for clarity
Inputs Overview
Box Position / Size – Place and scale the on-chart info box
Lookback Period – Number of bars used for calculations
VWAP Lookback – Period for VWAP distance smoothing
Shift Sensitivity – Adjusts reaction strength of bullish/bearish shifts
Neutral Zone Threshold – Defines when the market is considered neutral
EMA or SMA – Choose exponential or simple moving averages
Component Weights – Set the influence of VWAP, OBV, Volume, and Momentum on the shift score
Display Toggles – Enable or disable metrics shown in the box (Strength, Volume, VWAP, Duration, OBV)
How to Use
Apply the indicator to any symbol and timeframe.
Observe the box on the chart — it updates dynamically.
Look for transitions between Neutral → Bullish or Neutral → Bearish shifts.
Combine with your existing price action or confirmation tools (e.g., support/resistance, trendlines).
Use the “Strength” and “Duration” values to assess consistency and momentum quality.
(This indicator is not a buy/sell signal generator — it is designed as a contextual analysis and confirmation tool.)
How It Helps
Merges several key volume and price metrics into a single view
Highlights transitions in market control between buyers and sellers
Reduces clutter by presenting only relevant context data
Works on any market and timeframe, from scalping to swing trading
⚠️Disclaimer:
This script is provided for educational and informational purposes only. It is not financial advice and should not be considered a recommendation to buy, sell, or hold any financial instrument. Trading involves significant risk of loss and is not suitable for every investor. Users should perform their own due diligence and consult with a licensed financial advisor before making any trading decisions. The author does not guarantee any profits or results from using this script, and assumes no liability for any losses incurred. Use this script at your own risk.
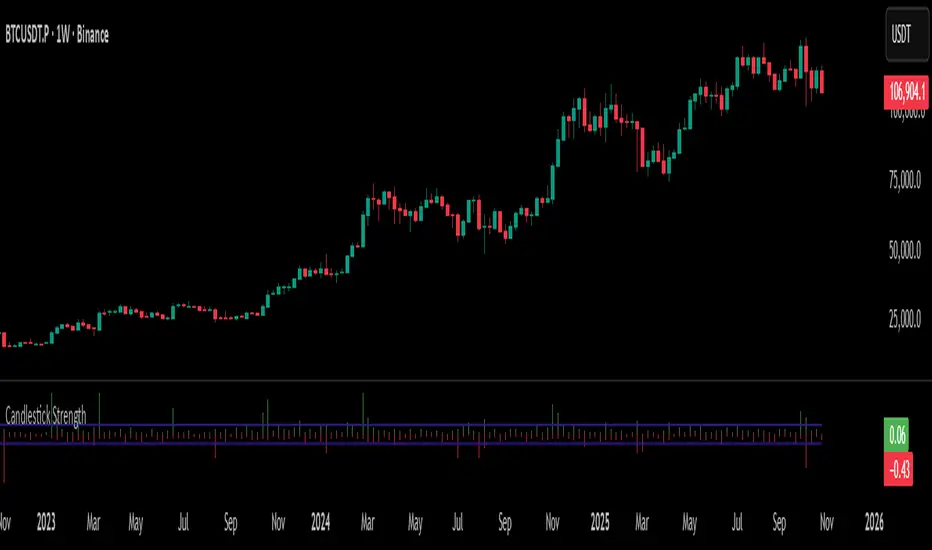
Wolumen

Candlestick StrengthThis indicator quantifies the “energy” of each candlestick by combining its height (high–low span), trading volume, and internal structure (body vs. wick proportions). It provides a numeric measure of how strongly each candle contributes to market momentum, allowing traders to distinguish meaningful price action from indecision or noise.
Concept
Every candlestick represents a short-term contest between buyers and sellers. Large candles with significant volume indicate strong market participation, while small or low-volume candles suggest hesitation or absorption. Candlestick Strength captures this by calculating a normalized measure of each candle’s energy relative to recent activity, making it comparable across different market conditions and timeframes.
The indicator also analyzes the candle’s internal structure:
The body reflects net directional movement.
The wicks represent back-and-forth price traversal within the candle. Because wick movement does not fully contribute to directional momentum, it is weighted at half the body’s contribution. This ensures the indicator emphasizes sustained directional pressure while still acknowledging rejection or absorption.
Interpretation
High values indicate candles with energy above recent averages — suggesting expanding momentum and strong directional intent.
Average values reflect typical candle activity, representing neutral or steady market behavior.
Low values suggest weak candles — either the market is pausing, consolidating, or momentum is fading.
The outputs are displayed as a symmetric histogram: bullish candle energy is shown in green above zero, bearish energy in red below zero, with ±1 reference lines marking the normalized average energy level.
Usage
Combine with trend analysis, swing highs/lows, or volume-weighted averages to validate breakouts or trend continuation.
Monitor for divergence between price movement and candle energy to identify exhaustion, absorption, or potential reversals.
Filter out false momentum signals caused by narrow-range or low-volume candles.
Adaptable across timeframes: normalized energy allows comparison between small and large timeframe candles.
ATR x Trend x Volume SignalsATR x Trend x Volume Signals is a multi-factor indicator that combines volatility, trend, and volume analysis into one adaptive framework. It is designed for traders who use technical confluence and prefer clear, rule-based setups.
🎯 Purpose
This tool identifies high-probability market moments when volatility structure (ATR), momentum direction (CCI-based trend logic), and volume expansion all align. It helps filter out noise and focus on clean, actionable trade conditions.
⚙️ Structure
The indicator consists of three main analytical layers:
1️⃣ ATR Trailing Stop – calculates two adaptive ATR lines (fast and slow) that define volatility context, trend bias, and potential reversal points.
2️⃣ Trend Indicator (CCI + ATR) – uses a CCI-based logic combined with ATR smoothing to determine the dominant trend direction and reduce false flips.
3️⃣ Volume Analysis – evaluates volume deviations from their historical average using standard deviation. Bars are highlighted as medium, high, or extra-high volume depending on intensity.
💡 Signal Logic
A Buy Signal (green) appears when all of the following are true:
• The ATR (slow) line is green.
• The Trend Indicator is blue.
• A bullish candle closes above both the ATR (slow) and the Trend Indicator.
• The candle shows medium, high, or extra-high volume.
A Sell Signal (red) appears when:
• The ATR (slow) line is red.
• The Trend Indicator is red.
• A bearish candle closes below both the ATR (slow) and the Trend Indicator.
• The candle shows medium, high, or extra-high volume.
Only one signal can appear per ATR trend phase. A new signal is generated only after the ATR direction changes.
❌ Exit Logic
Exit markers are shown when price crosses the slow ATR line. This behavior simulates a trailing stop exit. The exit is triggered one bar after entry to prevent same-bar exits.
⏰ Session Filter
Signals are generated only between the user-defined session start and end times (default: 14:00–18:00 chart time). This allows the trader to limit signal generation to active trading hours.
💬 Practical Use
It is recommended to trade with a fixed risk-reward ratio such as 1 : 1.5. Stop-loss placement should be beyond the slow ATR line and adjusted gradually as the trade develops.
For better confirmation, the Trend Indicator timeframe should be higher than the chart timeframe (for example: trading on 1 min → set Trend Indicator timeframe to 15 min; trading on 5 min → set to 1 hour).
🧠 Main Features
• Dual ATR volatility structure (fast and slow)
• CCI-based trend direction filtering
• Volume deviation heatmap logic
• Time-restricted signal generation
• Dynamic trailing-stop exit system
• Non-repainting logic
• Fully optimized for Pine Script v6
📊 Usage Tip
Best results are achieved when combining this indicator with additional technical context such as support-resistance, higher-timeframe confirmation, or market structure analysis.
📈 Credits
Inspired by:
• ATR Trailing Stop by Ceyhun
• Trend Magic by Kivanc Ozbilgic
• Heatmap Volume by xdecow

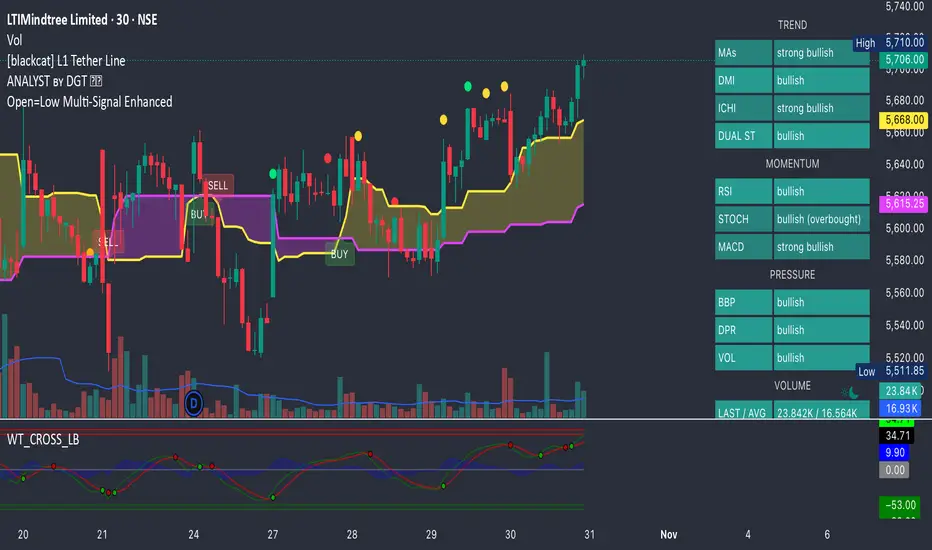
Open=Low Multi-Signal EnhancedPower your trades with all new Open = Low with tolerance added in the price. This script will give Open = Low and also if slight deviation in the Open = Low with rising volume and rising momentum in the price.
High Volume Vector CandlesHigh Volume Vector Candles highlights candles where trading activity significantly exceeds the average, helping you quickly identify powerful moves driven by strong volume.
How it works:
- The script calculates a moving average of volume over a user-defined period.
- When current volume exceeds the chosen threshold (e.g. 150% of the average), the candle is marked as a high-volume event.
- Bullish high-volume candles are highlighted in blue tones, while bearish ones are shown in yellow, both with adjustable opacity.
This visualization makes it easier to spot potential breakout points, absorption zones, or institutional activity directly on your chart.
Customizable Settings:
• Moving average length
• Threshold percentage above average
• Bullish/Bearish highlight colors
• Opacity level
Ideal for traders who combine price action with volume analysis to anticipate market momentum.
Retail vs Banker Net Positions – Symmetry BreakRetail vs Banker Net Positions – Symmetry Break (Institution Focus)
Description:
This advanced indicator is a volume-proxy-based positioning tool that separates institutional vs. retail behavior using bar structure, trend-following logic, and statistical analysis. It identifies net position flows over time, detects institutional aggression spikes, and highlights symmetry breaks—those moments when institutional action diverges sharply from retail behavior. Designed for intraday to swing traders, this is a powerful tool for gauging smart money activity and retail exhaustion.
What It Does:
Separates Volume into Two Groups:
Institutional Proxy: Volume on large bars in trend direction
Retail Proxy: Volume on small or counter-trend bars
Calculates Net Positions (%):
Smooths cumulative buying vs. selling behavior for each group over time.
Highlights Symmetry Breaks:
Alerts when institutions make statistically abnormal moves while retail is quiet or doing the opposite.
Detects Extremes in Institutional Activity:
Flags major tops/bottoms in institutional positioning using swing pivots or rolling windows.
Retail Sentiment Flips:
Marks when the retail line crosses the zero line (e.g., flipping from net short to net long).
How to Use It:
Interpreting the Two Lines:
Aqua/Orange Line (Institutional Proxy):
Rising above zero = Net buying bias
Falling below zero = Net selling bias
Lime/Red Line (Retail Proxy):
Green = Retail buying; Red = Retail selling
Watch for crosses of zero for sentiment shifts
Spotting Symmetry Breaks:
Pink Circle or Background Highlight =
Institutions made a sharp, outsized move while retail was:
Quiet (low ROC), or
Moving in the opposite direction
These often precede explosive directional moves or stop hunts.
Institutional Extremes:
Marked with aqua (top) or orange (bottom) dots
Based on swing pivot logic or rolling highs/lows in institutional positioning
Optional filter: Only show extremes that coincide with a symmetry break
Settings You Can Tune:
Lookback lengths for trend, z-scores, smoothing
Z-Score thresholds to control sensitivity
Retail quiet filters to reduce false positives
Cool-down timer to avoid rapid repeat signals
Toggle visual aids like shading, markers, and threshold lines
Alerts Included:
-Retail flips (green/red)
- Institutional symmetry breaks
- Institutional extreme tops/bottoms
Strategy Tip:
Use this indicator to track institutional accumulation or distribution phases and catch asymmetric inflection points where the "smart money" acts decisively. Confluence with price structure or FVGs (Fair Value Gaps) can further enhance signal quality.

MTF K-Means Price Regimes [matteovesperi] ⚠️ The preview uses a custom example to identify support/resistance zones. due to the fact that this identifier clusterizes, this is possible. this example was set up "in a hurry", therefore it has a possible inaccuracy. When setting up the indicator, it is extremely important to select the correct parameters and double-check them on the selected history.
📊 OVERVIEW
Purpose
MTF K-Means Price Regimes is a TradingView indicator that automatically identifies and classifies the current market regime based on the K-Means machine learning algorithm. The indicator uses data from a higher timeframe (Multi-TimeFrame, MTF) to build stable classification and applies it to the working timeframe in real-time.
Key Features
✅ Automatic market regime detection — the algorithm finds clusters of similar market conditions
✅ Multi-timeframe (MTF) — clustering on higher TF, application on lower TF
✅ Adaptive — model recalculates when a new HTF bar appears with a rolling window
✅ Non-Repainting — classification is performed only on closed bars
✅ Visualization — bar coloring + information panel with cluster characteristics
✅ Flexible settings — from 2 to 10 clusters, customizable feature periods, HTF selection
━━━━━━━━━━━━━━━━━━━━━━━━━━━━━━━━━━━━━━━━━━━━━━━━━━━━━━━━━━━━━━━━━
🔬 TECHNICAL DETAILS
K-Means Clustering Algorithm
What is K-Means?
K-Means is one of the most popular clustering algorithms (unsupervised machine learning). It divides a dataset into K groups (clusters) so that similar elements are within each cluster, and different elements are between clusters.
Algorithm objective:
Minimize within-cluster variance (sum of squared distances from points to their cluster center).
How Does K-Means Work in Our Indicator?
Step 1: Data Collection
The indicator accumulates history from the higher timeframe (HTF):
RSI (Relative Strength Index) — overbought/oversold indicator
ATR% (Average True Range as % of price) — volatility indicator
ΔP% (Price Change in %) — trend strength and direction indicator
By default, 200 HTF bars are accumulated (clusterLookback parameter).
Step 2: Creating Feature Vectors
Each HTF bar is described by a three-dimensional vector:
Vector =
Step 3: Normalization (Z-Score)
All features are normalized to bring them to a common scale:
Normalized_Value = (Value - Mean) / StdDev
This is critically important, as RSI is in the range 0-100, while ATR% and ΔP% have different scales. Without normalization, one feature would dominate over others.
Step 4: K-Means++ Centroid Initialization
Instead of random selection of K initial centers, an improved K-Means++ method is used:
First centroid is randomly selected from the data
Each subsequent centroid is selected with probability proportional to the square of the distance to the nearest already selected centroid
This ensures better initial centroid distribution and faster convergence
Step 5: Iterative Optimization (Lloyd's Algorithm)
Repeat until convergence (or maxIterations):
1. Assignment step:
For each point find the nearest centroid and assign it to this cluster
2. Update step:
Recalculate centroids as the average of all points in each cluster
3. Convergence check:
If centroids shifted less than 0.001 → STOP
Euclidean distance in 3D space is used:
Distance = sqrt((RSI1 - RSI2)² + (ATR1 - ATR2)² + (ΔP1 - ΔP2)²)
Step 6: Adaptive Update
With each new HTF bar:
The oldest bar is removed from history (rolling window method)
New bar is added to history
K-Means algorithm is executed again on updated data
Model remains relevant for current market conditions
Real-Time Classification
After building the model (clusters + centroids), the indicator works in classification mode:
On each closed bar of the current timeframe, RSI, ATR%, ΔP% are calculated
Feature vector is normalized using HTF statistics (Mean/StdDev)
Distance to all K centroids is calculated
Bar is assigned to the cluster with minimum distance
Bar is colored with the corresponding cluster color
Important: Classification occurs only on a closed bar (barstate.isconfirmed), which guarantees no repainting .
Data Architecture
Persistent variables (var):
├── featureVectors - Normalized HTF feature vectors
├── centroids - Cluster center coordinates (K * 3 values)
├── assignments - Assignment of each HTF bar to a cluster
├── htfRsiHistory - History of RSI values from HTF
├── htfAtrHistory - History of ATR values from HTF
├── htfPcHistory - History of price changes from HTF
├── htfCloseHistory - History of close prices from HTF
├── htfRsiMean, htfRsiStd - Statistics for RSI normalization
├── htfAtrMean, htfAtrStd - Statistics for ATR normalization
├── htfPcMean, htfPcStd - Statistics for Price Change normalization
├── isCalculated - Model readiness flag
└── currentCluster - Current active cluster
All arrays are synchronized and updated atomically when a new HTF bar appears.
Computational Complexity
Data collection: O(1) per bar
K-Means (one pass):
- Assignment: O(N * K) where N = number of points, K = number of clusters
- Update: O(N * K)
- Total: O(N * K * I) where I = number of iterations (usually 5-20)
Example: With N=200 HTF bars, K=5 clusters, I=20 iterations:
200 * 5 * 20 = 20,000 operations (executes quickly)
━━━━━━━━━━━━━━━━━━━━━━━━━━━━━━━━━━━━━━━━━━━━━━━━━━━━━━━━━━━━━━━━━
📖 USER GUIDE
Quick Start
1. Adding the Indicator
TradingView → Indicators → Favorites → MTF K-Means Price Regimes
Or copy the code from mtf_kmeans_price_regimes.pine into Pine Editor.
2. First Launch
When adding the indicator to the chart, you'll see a table in the upper right corner:
┌─────────────────────────┐
│ Status │ Collecting HTF │
├─────────────────────────┤
│ Collected│ 15 / 50 │
└─────────────────────────┘
This means the indicator is accumulating history from the higher timeframe. Wait until the counter reaches the minimum (default 50 bars for K=5).
3. Active Operation
After data collection is complete, the main table with cluster information will appear:
┌────┬──────┬──────┬──────┬──────────────┬────────┐
│ ID │ RSI │ ATR% │ ΔP% │ Description │Current │
├────┼──────┼──────┼──────┼──────────────┼────────┤
│ 1 │ 68.5 │ 2.15 │ 1.2 │ High Vol,Bull│ │
│ 2 │ 52.3 │ 0.85 │ 0.1 │ Low Vol,Flat │ ► │
│ 3 │ 35.2 │ 1.95 │ -1.5 │ High Vol,Bear│ │
└────┴──────┴──────┴──────┴──────────────┴────────┘
The arrow ► indicates the current active regime. Chart bars are colored with the corresponding cluster color.
Customizing for Your Strategy
Choosing Higher Timeframe (HTF)
Rule: HTF should be at least 4 times higher than the working timeframe.
| Working TF | Recommended HTF |
|------------|-----------------|
| 1 min | 15 min - 1H |
| 5 min | 1H - 4H |
| 15 min | 4H - D |
| 1H | D - W |
| 4H | D - W |
| D | W - M |
HTF Selection Effect:
Lower HTF (closer to working TF): More sensitive, frequently changing classification
Higher HTF (much larger than working TF): More stable, long-term regime assessment
Number of Clusters (K)
K = 2-3: Rough division (e.g., "uptrend", "downtrend", "flat")
K = 4-5: Optimal for most cases (DEFAULT: 5)
K = 6-8: Detailed segmentation (requires more data)
K = 9-10: Very fine division (only for long-term analysis with large windows)
Important constraint:
clusterLookback ≥ numClusters * 10
I.e., for K=5 you need at least 50 HTF bars, for K=10 — at least 100 bars.
Clustering Depth (clusterLookback)
This is the rolling window size for building the model.
50-100 HTF bars: Fast adaptation to market changes
200 HTF bars: Optimal balance (DEFAULT)
500-1000 HTF bars: Long-term, stable model
If you get an "Insufficient data" error:
Decrease clusterLookback
Or select a lower HTF (e.g., "4H" instead of "D")
Or decrease numClusters
Color Scheme
Default 10 colors:
Red → Often: strong bearish, high volatility
Orange → Transition, medium volatility
Yellow → Neutral, decreasing activity
Green → Often: strong bullish, high volatility
Blue → Medium bullish, medium volatility
Purple → Oversold, possible reversal
Fuchsia → Overbought, possible reversal
Lime → Strong upward momentum
Aqua → Consolidation, low volatility
White → Undefined regime (rare)
Important: Cluster colors are assigned randomly at each model recalculation! Don't rely on "red = bearish". Instead, look at the description in the table (RSI, ATR%, ΔP%).
You can customize colors in the "Colors" settings section.
━━━━━━━━━━━━━━━━━━━━━━━━━━━━━━━━━━━━━━━━━━━━━━━━━━━━━━━━━━━━━━━━━
⚙️ INDICATOR PARAMETERS
Main Parameters
Higher Timeframe (htf)
Type: Timeframe selection
Default: "D" (daily)
Description: Timeframe on which the clustering model is built
Recommendation: At least 4 times larger than your working TF
Clustering Depth (clusterLookback)
Type: Integer
Range: 50 - 2000
Default: 200
Description: Number of HTF bars for building the model (rolling window size)
Recommendation:
- Increase for more stable long-term model
- Decrease for fast adaptation or if there's insufficient historical data
Number of Clusters (K) (numClusters)
Type: Integer
Range: 2 - 10
Default: 5
Description: Number of market regimes the algorithm will identify
Recommendation:
- K=3-4 for simple strategies (trending/ranging)
- K=5-6 for universal strategies
- K=7-10 only when clusterLookback ≥ 100*K
Max K-Means Iterations (maxIterations)
Type: Integer
Range: 5 - 50
Default: 20
Description: Maximum number of algorithm iterations
Recommendation:
- 10-20 is sufficient for most cases
- Increase to 30-50 if using K > 7
Feature Parameters
RSI Period (rsiLength)
Type: Integer
Default: 14
Description: Period for RSI calculation (overbought/oversold feature)
Recommendation:
- 14 — standard
- 7-10 — more sensitive
- 20-25 — more smoothed
ATR Period (atrLength)
Type: Integer
Default: 14
Description: Period for ATR calculation (volatility feature)
Recommendation: Usually kept equal to rsiLength
Price Change Period (pcLength)
Type: Integer
Default: 5
Description: Period for percentage price change calculation (trend feature)
Recommendation:
- 3-5 — short-term trend
- 10-20 — medium-term trend
Visualization
Show Info Panel (showDashboard)
Type: Checkbox
Default: true
Description: Enables/disables the information table on the chart
Cluster Color 1-10
Type: Color selection
Description: Customize colors for visual cluster distinction
Recommendation: Use contrasting colors for better readability
━━━━━━━━━━━━━━━━━━━━━━━━━━━━━━━━━━━━━━━━━━━━━━━━━━━━━━━━━━━━━━━━━
📊 INTERPRETING RESULTS
Reading the Information Table
┌────┬──────┬──────┬──────┬──────────────┬────────┐
│ ID │ RSI │ ATR% │ ΔP% │ Description │Current │
├────┼──────┼──────┼──────┼──────────────┼────────┤
│ 1 │ 68.5 │ 2.15 │ 1.2 │ High Vol,Bull│ │
│ 2 │ 52.3 │ 0.85 │ 0.1 │ Low Vol,Flat │ ► │
│ 3 │ 35.2 │ 1.95 │ -1.5 │ High Vol,Bear│ │
│ 4 │ 45.0 │ 1.20 │ -0.3 │ Low Vol,Bear │ │
│ 5 │ 72.1 │ 3.05 │ 2.8 │ High Vol,Bull│ │
└────┴──────┴──────┴──────┴──────────────┴────────┘
"ID" Column
Cluster number (1-K). Order doesn't matter.
"RSI" Column
Average RSI value in the cluster (0-100):
< 30: Oversold zone
30-45: Bearish sentiment
45-55: Neutral zone
55-70: Bullish sentiment
> 70: Overbought zone
"ATR%" Column
Average volatility in the cluster (as % of price):
< 1%: Low volatility (consolidation, narrow range)
1-2%: Normal volatility
2-3%: Elevated volatility
> 3%: High volatility (strong movements, impulses)
Compared to the average volatility across all clusters to determine "High Vol" or "Low Vol".
"ΔP%" Column
Average price change in the cluster (in % over pcLength period):
> +0.05%: Bullish regime
-0.05% ... +0.05%: Flat (sideways movement)
< -0.05%: Bearish regime
"Description" Column
Automatic interpretation:
"High Vol, Bull" → Strong upward momentum, high activity
"Low Vol, Flat" → Consolidation, narrow range, uncertainty
"High Vol, Bear" → Strong decline, panic, high activity
"Low Vol, Bull" → Slow growth, low activity
"Low Vol, Bear" → Slow decline, low activity
"Current" Column
Arrow ► shows which cluster the last closed bar of your working timeframe is in.
Typical Cluster Patterns
Example 1: Trend/Flat Division (K=3)
Cluster 1: RSI=65, ATR%=2.5, ΔP%=+1.5 → Bullish trend
Cluster 2: RSI=50, ATR%=0.8, ΔP%=0.0 → Flat/Consolidation
Cluster 3: RSI=35, ATR%=2.3, ΔP%=-1.4 → Bearish trend
Strategy: Open positions when regime changes Flat → Trend, avoid flat.
Example 2: Volatility Breakdown (K=5)
Cluster 1: RSI=72, ATR%=3.5, ΔP%=+2.5 → Strong bullish impulse (high risk)
Cluster 2: RSI=60, ATR%=1.5, ΔP%=+0.8 → Moderate bullish (optimal entry point)
Cluster 3: RSI=50, ATR%=0.7, ΔP%=0.0 → Flat
Cluster 4: RSI=40, ATR%=1.4, ΔP%=-0.7 → Moderate bearish
Cluster 5: RSI=28, ATR%=3.2, ΔP%=-2.3 → Strong bearish impulse (panic)
Strategy: Enter in Cluster 2 or 4, avoid extremes (1, 5).
Example 3: Mixed Regimes (K=7+)
With large K, clusters can represent condition combinations:
High RSI + Low volatility → "Quiet overbought"
Neutral RSI + High volatility → "Uncertainty with high activity"
Etc.
Requires individual analysis of each cluster.
Regime Changes
Important signal: Transition from one cluster to another!
Trading situation examples:
Flat → Bullish trend → Buy signal
Bullish trend → Flat → Take profit, close longs
Flat → Bearish trend → Sell signal
Bearish trend → Flat → Close shorts, wait
You can build a trading system based on the current active cluster and transitions between them.
━━━━━━━━━━━━━━━━━━━━━━━━━━━━━━━━━━━━━━━━━━━━━━━━━━━━━━━━━━━━━━━━━
💡 USAGE EXAMPLES
Example 1: Scalping with HTF Filter
Task: Scalping on 5-minute charts, but only enter in the direction of the daily regime.
Settings:
Working TF: 5 min
HTF: D (daily)
K: 3 (simple division)
clusterLookback: 100
Logic:
IF current cluster = "Bullish" (ΔP% > 0.5)
→ Look for long entry points on 5M
IF current cluster = "Bearish" (ΔP% < -0.5)
→ Look for short entry points on 5M
IF current cluster = "Flat"
→ Don't trade / reduce risk
Example 2: Swing Trading with Volatility Filtering
Task: Swing trading on 4H, enter only in regimes with medium volatility.
Settings:
Working TF: 4H
HTF: D (daily)
K: 5
clusterLookback: 200
Logic:
Allowed clusters for entry:
- ATR% from 1.5% to 2.5% (not too quiet, not too chaotic)
- ΔP% with clear direction (|ΔP%| > 0.5)
Prohibited clusters:
- ATR% > 3% → Too risky (possible gaps, sharp reversals)
- ATR% < 1% → Too quiet (small movements, commissions eat profit)
Example 3: Portfolio Rotation
Task: Managing a portfolio of multiple assets, allocate capital depending on regimes.
Settings:
Working TF: D (daily)
HTF: W (weekly)
K: 4
clusterLookback: 100
Logic:
For each asset in portfolio:
IF regime = "Strong trend + Low volatility"
→ Increase asset weight in portfolio (40-50%)
IF regime = "Medium trend + Medium volatility"
→ Standard weight (20-30%)
IF regime = "Flat" or "High volatility without trend"
→ Minimum weight or exclude (0-10%)
Example 4: Combining with Other Indicators
MTF K-Means as a filter:
Main strategy: MA Crossover
Filter: MTF K-Means on higher TF
Rule:
IF MA_fast > MA_slow AND Cluster = "Bullish regime"
→ LONG
IF MA_fast < MA_slow AND Cluster = "Bearish regime"
→ SHORT
ELSE
→ Don't trade (regime doesn't confirm signal)
This dramatically reduces false signals in unsuitable market conditions.
━━━━━━━━━━━━━━━━━━━━━━━━━━━━━━━━━━━━━━━━━━━━━━━━━━━━━━━━━━━━━━━━━
📈 OPTIMIZATION RECOMMENDATIONS
Optimal Settings for Different Styles
Day Trading
Working TF: 5M - 15M
HTF: 1H - 4H
numClusters: 4-5
clusterLookback: 100-150
Swing Trading
Working TF: 1H - 4H
HTF: D
numClusters: 5-6
clusterLookback: 150-250
Position Trading
Working TF: D
HTF: W - M
numClusters: 4-5
clusterLookback: 100-200
Scalping
Working TF: 1M - 5M
HTF: 15M - 1H
numClusters: 3-4
clusterLookback: 50-100
Backtesting
To evaluate effectiveness:
Load historical data (minimum 2x clusterLookback HTF bars)
Apply the indicator with your settings
Study cluster change history:
- Do changes coincide with actual trend transitions?
- How often do false signals occur?
Optimize parameters:
- If too much noise → increase HTF or clusterLookback
- If reaction too slow → decrease HTF or increase numClusters
Combining with Other Techniques
Regime-Based Approach:
MTF K-Means (regime identification)
↓
+---+---+---+
| | | |
v v v v
Trend Flat High_Vol Low_Vol
↓ ↓ ↓ ↓
Strategy_A Strategy_B Don't_trade
Examples:
Trend: Use trend-following strategies (MA crossover, Breakout)
Flat: Use mean-reversion strategies (RSI, Bollinger Bands)
High volatility: Reduce position sizes, widen stops
Low volatility: Expect breakout, don't open positions inside range
━━━━━━━━━━━━━━━━━━━━━━━━━━━━━━━━━━━━━━━━━━━━━━━━━━━━━━━━━━━━━━━━━
📞 SUPPORT
Report an Issue
If you found a bug or have a suggestion for improvement:
Describe the problem in as much detail as possible
Specify your indicator settings
Attach a screenshot (if possible)
Specify the asset and timeframe where the problem is observed

#1 Vishal Toora Buy/Sell Table#1 Vishal Toora Buy/Sell Table
A multi-range volume analysis tool that tracks Short, Medium, and Long-term volume activity directly from recent candles.
It calculates Buy and Sell volumes for each range, shows their Delta (difference), and generates a combined Signal (Buy / Sell / Neutral) based on all active ranges.
Each column and the Signal row can be switched ON/OFF for custom clarity.
🧠 What the Numbers Represent (Candle Connection)
Each number represents total volume from a group of candles:
The script looks back a certain number of candles in each range (e.g., 2–3 candles for Short, 10–20 for Medium, 50–100 for Long).
It measures how much volume occurred on bullish candles (Buy) vs bearish candles (Sell).
Buy Volume (Green Numbers):
Volume from candles where price closed higher than it opened → bullish pressure.
Sell Volume (Red Numbers):
Volume from candles where price closed lower than it opened → bearish pressure.
Delta (White or Yellow Numbers):
The difference between Buy and Sell volumes within that range.
Positive → More bullish volume.
Negative → More bearish volume.
Larger absolute values = stronger imbalance between buyers and sellers.
Signal Row:
Summarizes all ranges’ deltas:
🟢 Buy → majority of ranges show positive delta.
🔴 Sell → majority show negative delta.
⚪ Neutral → roughly balanced or mixed candle behavior.
🎯 In Simple Terms
Each number in the table is a summary of what recent candles did —
it converts multiple candles’ volume data into clean, readable signals,
so you instantly see who’s in control (buyers or sellers) across short, medium, and long perspectives.
© 2025 Vishal Toora — counting volumes so you don’t have to.
Buy or Sell... or just stare at the screen.
Making deltas speak louder than your ex. 💀
Disclaimer:
This indicator is for educational and informational purposes only.
It does not guarantee accuracy or performance.
You are solely responsible for your trading decisions.

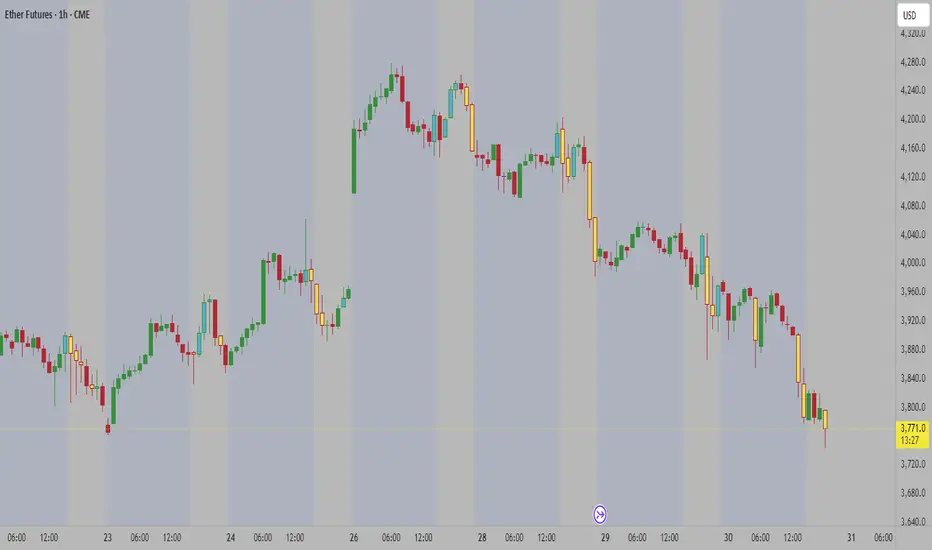
NDOG [派大星]🧠 Indicator Description — “NDOG ”
This indicator visualizes Night-Day Opening Gaps (NDOG) based on the custom trading session timing used in U.S. markets.
Instead of using the standard daily candle change, it detects gaps between the 16:59 close and the 18:00 open (New York time, UTC-4).
Whenever the market reopens after the evening pause (from 16:59 → 18:00),
the script measures the price difference between the previous session’s close and the new session’s open,
then draws a shaded box to highlight the opening gap region.
🟦 Bullish Gap (Upward) — when the new session opens above the previous close.
🟪 Bearish Gap (Downward) — when the new session opens below the previous close.
You can control the maximum number of displayed gaps with the “Amount” setting.
This custom session logic allows more accurate visualization of after-hours transitions for futures or extended-hours instruments (e.g., ES, NQ, SPY).

Nqaba Goldminer StrategyThis indicator plots the New York session key timing levels used in institutional intraday models.
It automatically marks the 03:00 AM, 10:00 AM, and 2:00 PM (14:00) New York times each day:
Vertical lines show exactly when those time windows open — allowing traders to identify major global liquidity shifts between London, New York, and U.S. session overlaps.
Horizontal lines mark the opening price of the 5-minute candle that begins at each of those key times, providing precision reference levels for potential reversals, continuation setups, and intraday bias shifts.
Users can customize each line’s color, style (solid/dashed/dotted), width, and horizontal-line length.
A history toggle lets you display all past occurrences or just today’s key levels for a cleaner chart.
These reference levels form the foundation for strategies such as:
London Breakout to New York Reversal models
Opening Range / Session Open bias confirmation
Institutional volume transfer windows (London → NY → Asia)
The tool provides a simple visual structure for traders to frame intraday decision-making around recurring institutional time events.

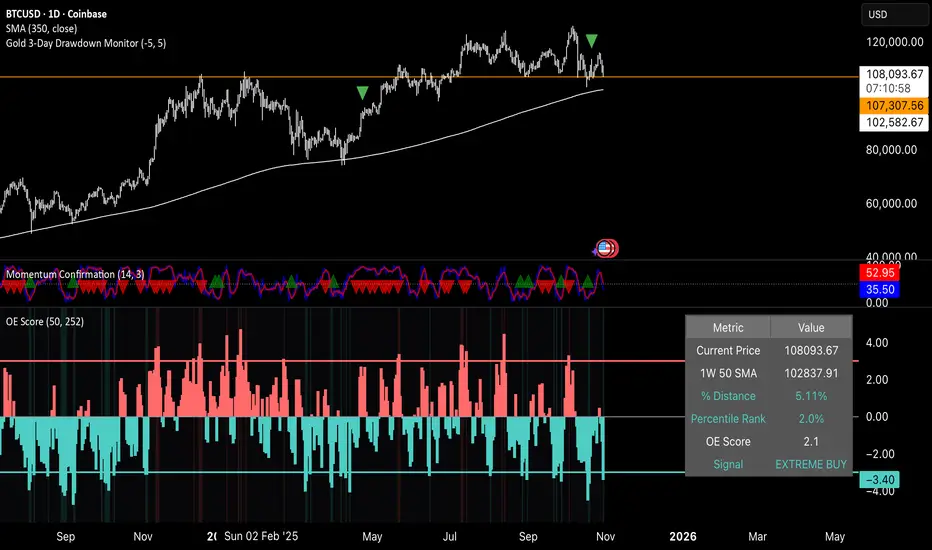
Percentile Rank Oscillator (Price + VWMA)A statistical oscillator designed to identify potential market turning points using percentile-based price analytics and volume-weighted confirmation.
What is PRO?
Percentile Rank Oscillator measures how extreme current price behavior is relative to its own recent history. It calculates a rolling percentile rank of price midpoints and VWMA deviation (volume-weighted price drift). When price reaches historically rare levels – high or low percentiles – it may signal exhaustion and potential reversal conditions.
How it works
Takes midpoint of each candle ((H+L)/2)
Ranks the current value vs previous N bars using rolling percentile rank
Maps percentile to a normalized oscillator scale (-1..+1 or 0–100)
Optionally evaluates VWMA deviation percentile for volume-confirmed signals
Highlights extreme conditions and confluence zones
Why percentile rank?
Median-based percentiles ignore outliers and read the market statistically – not by fixed thresholds. Instead of guessing “overbought/oversold” values, the indicator adapts to current volatility and structure.
Key features
Rolling percentile rank of price action
Optional VWMA-based percentile confirmation
Adaptive, noise-robust structure
User-selectable thresholds (default 95/5)
Confluence highlighting for price + VWMA extremes
Optional smoothing (RMA)
Visual extreme zone fills for rapid signal recognition
How to use
High percentile values –> statistically extreme upward deviation (potential top)
Low percentile values –> statistically extreme downward deviation (potential bottom)
Price + VWMA confluence strengthens reversal context
Best used as part of a broader trading framework (market structure, order flow, etc.)
Tip: Look for percentile spikes at key HTF levels, after extended moves, or where liquidity sweeps occur. Strong moves into rare percentile territory may precede mean reversion.
Suggested settings
Default length: 100 bars
Thresholds: 95 / 5
Smoothing: 1–3 (optional)
Important note
This tool does not predict direction or guarantee outcomes. It provides statistical context for price extremes to help traders frame probability and timing. Always combine with sound risk management and other tools.

量价策略信号+K线pinbar+波动率出场+市场结构【梦喂马】v3Part 1: Indicator Module Explained (Code Analysis and Function Description)
Module 1: Master Switches
This is your "dashboard master control." Due to the numerous indicator functions, charts can appear cluttered. Here, you can easily turn each major function module on or off, allowing you to focus on the information you need most.
- Suggested Usage: When using it for the first time, you can start by only turning on the Vegas Channel and Core Entry Signals to familiarize yourself with the system's main trend judgment and entry logic. Then gradually turn on other modules to experience how they work together.
Module 2: Core Entry Signals (Long/Short Signals)
This is the "engine" of the entire system, responsible for generating the highest quality trend-following trading signals. The appearance of a "long" or "short" signal represents the resonance of multiple indicators, satisfying extremely stringent filtering conditions:
- 1. Vegas Channel Filtering:
- When going long, the price must be above the slow channel (576/676 EMA) and the fast channel (21/55 EMA).
- When shorting, the price must break below both the slow and fast channels.
- Interpretation: This ensures your trading direction is perfectly aligned with the medium- to long-term macro trend.
- 2. Alligator Line Confirmation:
- When going long, the price must be above the alligator lines (lips, teeth, jaws), and the alligator lines must be in a bullish alignment (opening upwards).
- When shorting, the opposite applies.
- Interpretation: This confirms that short-term momentum aligns with the long-term trend, avoiding hasty entry at the start or end of a trend.
- 3. OBV (On-Balance Volume) Filter:
- When going long, the OBV value must be above its own moving average (default 34 periods).
- When shorting, the OBV value must be below its moving average.
- Interpretation: OBV is a key indicator measuring fund inflows and outflows. This condition ensures that trading volume (funds) is supporting your trading direction.
- 4. ADX Trend Strength Filter:
- Whether going long or short, the ADX value must be greater than the set threshold (default 20).
- Interpretation: This is a crucial "insurance" layer. It helps filter out volatile market conditions with no clear direction, prone to repeated "misjudgments." We only act in markets with clear and strong trends.
Core Usage: Once a "long"/"short" signal appears, it represents a high-certainty trend-following trading opportunity. Due to the very strict nature of the signals, they appear infrequently, but each one deserves your close attention.
Module Three: Vegas Channel & Alligator Line (Trend Judgment Tool)
- Vegas Channel: Composed of two sets of EMAs.
- Slow Channel (576/676): Your "bull/bear dividing line." Above this line, only consider going long; below this line, only consider going short. It is your strategic compass.
- Fast Channel (21/55): Your "short-term momentum line." In an uptrend, price pullbacks to the vicinity of the fast channel are potential areas for adding to positions or entering.
- Alligator Line:
- Widening divergence: Indicates that a trend is underway.
- Convergence/Entanglement: Indicates the market is dormant or consolidating.
- Interpretation: Alligator lines allow you to visually see whether the market is in a "trending" or "consolidating" state. We primarily trade when the alligator lines widen.
Module Four: R/C Volume-Price Signals (Refined Entry/Warning Signals)
This is the system's "special forces," specifically designed to identify abnormal volume and price movements on key candlesticks. It is divided into the R series (Reversal) and the C series (Continuation).
- Prerequisites: All signals are based on trading volume. A signal's appearance must be accompanied by a significantly higher-than-average trading volume (increased volume). This indicates large capital participation at that price level, making the signal more reliable.
- R Series - Trend Reversal Signals (Warning/Opportunity):
- R1 (Core Reversal): In a downtrend, a sudden increase in volume on a bullish candlestick; or in an uptrend, an increase in volume on a bearish candlestick.
- Interpretation: This is the most basic reversal warning signal. It tells you that counter-trend forces are emerging, but it doesn't mean the trend will immediately reverse. Confirmation needs to be combined with other signals.
- R2 (Pattern Confirmation): In addition to R1, this candlestick must also be a well-defined Pin Bar (a bullish Pin Bar with a long lower shadow, or a bearish Pin Bar with a long upper shadow).
- Interpretation: This is a more reliable reversal signal. The Pin Bar pattern represents a strong rejection of the price after an attempt to break through; combined with increased volume, this indicates strong reversal momentum.
- R3 (Top Momentum): In addition to R2, the trading volume reaches a "massive" level (default is more than 4 times the average volume).
- Interpretation: This is the highest level reversal signal. It usually appears at the end of a trend, representing the extreme struggle and conversion of bullish and bearish forces, and is a potential sign of a "V-shaped reversal" or a deep V-bottom/top.
- C Series - Trend Continuation/Termination Signals:
- C0 (Trend Continuation): In a clear uptrend, a bearish Pin Bar (long upper shadow) with increased volume appears during a price pullback; or in a downtrend, a bullish Pin Bar (long lower shadow) with increased volume appears during a rebound.
- Interpretation: This is a classic "buy on pullback/sell on rebound" signal. It indicates that the pullback/rebound attempt to counterattack is quickly suppressed by the strong main trend, making it an excellent entry point for adding to positions or following the trend.
- CX (Exhaustion Signal): A C-series signal that appears when the price has moved far away from the slow Vegas Channel (default more than 5 times the ATR distance).
- Interpretation: This is an advanced use of the C-series. After a trend has run for a long time, market sentiment may be overly enthusiastic. The high-volume PinBar appearing at this time, while trend-following in form, is more likely to represent the exhaustion or "final frenzy" of the trend. This is an alert that the trend may be running out of momentum, and you should consider taking profits in batches rather than adding to your position.
Signal Priority: This indicator has been internally optimized: CX/R3 > R2 > C0 > R1. Higher-level signals will override lower-level signals, ensuring you see the most important information at the moment.
Module 5: Chandelier Exit - Dynamic Risk Management
This is a dynamic stop-loss system based on ATR (Average True Range).
- How it works:
- In an uptrend, it subtracts N times the ATR from the recent high, forming a stepped upward stop-loss line.
- In a downtrend, it adds N times the ATR from the recent low, forming a stepped downward stop-loss line.
- Core advantages: It automatically adjusts the stop-loss distance based on market volatility. During periods of high market volatility, the stop-loss widens, giving you more room; during periods of market stability, the stop-loss tightens, locking in profits more quickly.
- Usage:
- As an initial stop-loss: After entering a position, the stop-loss can be set outside the Chandelier line.
- As a trailing stop: The position is held as long as the price does not fall below (uptrend) or rise above (downtrend) the Chandelier line. This is a powerful tool for "letting profits run."
- As an auxiliary trend indicator: The direction of the chandelier line (upward/downward) also provides a concise short-term trend perspective.
Module Six: Candlestick Coloring
This feature is very intuitive; it colors candlesticks based on volume:
- High Volume (Orange): Volume exceeds twice the average volume.
- Huge Volume (Red): Volume exceeds four times the average volume.
- Usage: Helps you identify key candlesticks indicating significant market events at a glance, typically the start, acceleration, reversal, or exhaustion points of a trend.
Module Seven: ICT Market Structure
This is an advanced price behavior analysis tool based on ICT (Inner Circle Trader) theory, helping you understand the market's "skeleton."
- Core Concepts:
- Swing High/Low: Local tops and bottoms in market prices.
- BOS (Break of Structure): In an uptrend, the price creates a higher high than the previous swing high; in a downtrend, it creates a lower low.
- Interpretation: BOS (Bullish Oscillator) is a confirmation signal of trend continuation. Consecutive upward BOS indicate a healthy bullish trend, and vice versa.
- MSS (Market Structure Shift, also often called CHOCH): In an uptrend, the price fails to make a new high and instead falls below the previous valid swing low.
- Interpretation: MSS is the first and most important signal of a potential trend reversal. It indicates that market forces are shifting from bullish to bearish (or vice versa).
- Period Settings (Short/Intermediate/Long Term):
- Short Term: Based on the most minute 3-bar swing points, very sensitive, suitable for short-term traders to observe subtle changes.
- Intermediate Term (Recommended): Based on higher-level swing points formed from short-term swing points, filtering out some noise, suitable for day and swing traders.
- Long Term: Based on swing points formed from intermediate-term swing points, reflecting a longer-term structure, suitable for swing and long-term traders.
- Usage: Combine market structure with your trading signals. For example, in an uptrend (price above the Vegas Channel), each upward BOS confirms the health of the trend. If a C0 pullback signal appears at this point, it would be an excellent entry point. Conversely, if an MSS appears, even with a strong buy signal, caution is advised, as the trend may be reversing.
Module Eight: Information Panel
This is your "cockpit dashboard," consolidating all key information in one place, giving you a clear overview of the current market state:
- Main Trend Direction: The final trend judgment given by multiple indicators.
- Alligator Line Pattern: Shows whether the current trend is trending or consolidating.
- OBV Status: Whether funds are flowing in or out.
- ADX Status: Whether the trend is strong or weak.
- Chandelier Stop-Loss Direction: Short-term trend direction.

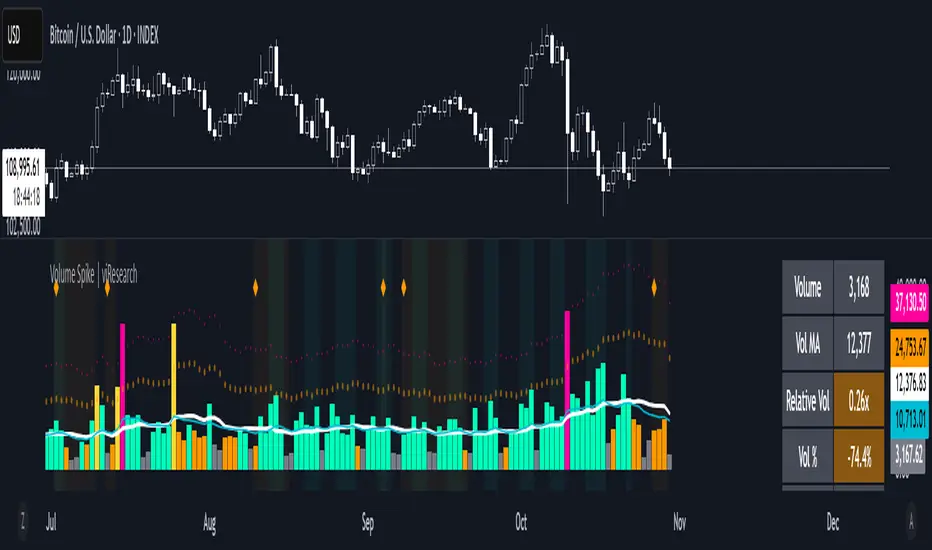
Volume Spike | viResearchVolume Spike | viResearch
Conceptual Foundation and Innovation
The Volume Spike indicator by viResearch is designed to identify the underlying strength and health of market participation by analyzing volume behavior. Rather than simply detecting high or low volume, this indicator distinguishes between healthy, gradual accumulation and unsustainable volume surges, giving traders a nuanced understanding of market sentiment.
The indicator focuses on the relationship between current trading volume and its moving average, classifying market activity into several key regimes — gradual, consistent, spiking, or weakening. This allows traders to quickly assess whether a price move is supported by solid participation or driven by temporary excitement that may not last.
Core Concept and Analysis Approach
At its core, Volume Spike measures the quality and consistency of trading activity over time. When volume rises steadily and remains within a stable range, it reflects healthy participation and sustainable trends. In contrast, when volume suddenly surges several times above average, it may indicate a climax move, often preceding a short-term top or bottom.
The indicator also incorporates consistency and trend assessments to evaluate whether current volume conditions align with accumulation, distribution, or exhaustion phases — helping traders interpret why a move is happening, not just that it is.
Features and User Inputs
The Volume Spike script includes several key parameters that allow traders to tailor its behavior to different assets and timeframes:
Volume Average Length: Defines the lookback period for calculating the average volume baseline.
Spike Multiplier: Sets the threshold (in multiples of the average) to define a true “spike” in volume.
Gradual Max Multiplier: Determines the upper limit of what is considered healthy, gradual volume growth.
Consistency Check Period: Evaluates how stable or erratic recent volume behavior has been.
Volume MA & EMA Display: Optional overlays for visual comparison against current activity.
These settings allow traders to distinguish between normal volume growth during trend formation and excessive spikes that often signal exhaustion or reversal risk.
Market Interpretation and Use Cases
The Volume Spike indicator provides valuable insights into market conditions, particularly during strong price movements or breakout phases. It can be used to:
Identify Healthy Trend Participation: Gradually rising volume within consistent ranges confirms genuine trend momentum.
Detect Volume Climax Events: Sudden spikes far above the average often mark exhaustion points, signaling caution.
Spot Divergences: When price rises but volume weakens, it can indicate a fading rally or distribution phase.
Evaluate Accumulation vs. Distribution: Volume patterns during down moves reveal whether smart money is buying weakness or selling strength.
Visual Cues and Color Logic
The indicator uses intuitive color coding to make volume interpretation straightforward:
Aqua (Healthy Gradual Volume): Stable, sustainable participation supporting trend continuation.
Pink (Volume Spike): Sharp, excessive surge — a warning of possible exhaustion or reversal.
Yellow (Elevated Volume): Moderate increase, often during breakout confirmation.
Gray (Low Volume): Reduced participation, signaling potential indecision.
Background highlights and on-chart alerts visually reinforce these signals:
Green background: Healthy, consistent volume environment.
Pink background: Warning of sudden volume spikes.
Orange background: Price-volume divergence, signaling weakening conviction.
Strategic Insights and Warnings
A gradual rise in volume typically validates trend strength, while sharp spikes can serve as early warnings of potential exhaustion. Repeated volume spikes near resistance levels may indicate distribution, whereas spikes near lows often suggest capitulation. Monitoring how volume evolves — not just its magnitude — helps traders stay aligned with smart money flow.
Information Table and Alerts
A real-time dashboard displays key statistics such as current volume, relative multiple of average, consistency level, and pattern type. Built-in alerts notify traders of critical situations, including:
Volume Spike on Up Candle — potential short-term top or euphoria.
Volume Spike on Down Candle — possible bottom or panic-driven selling.
Summary and Practical Use
The Volume Spike | viResearch indicator provides traders with a deeper understanding of volume dynamics, highlighting when market activity supports a move and when it signals exhaustion. By combining volume consistency, relative strength, and pattern recognition, it transforms raw volume data into actionable insights.
Use it to confirm breakout quality, detect unsustainable rallies, or identify accumulation zones before reversals occur. Sustainable trends are built on consistent participation — Volume Spike helps you see when that conviction begins to fade or surge beyond control.
Trading example: Spike volume + Oversold Commodity Index For Loop | viResearch
Note: Historical readings are for analytical purposes only and do not guarantee future performance.
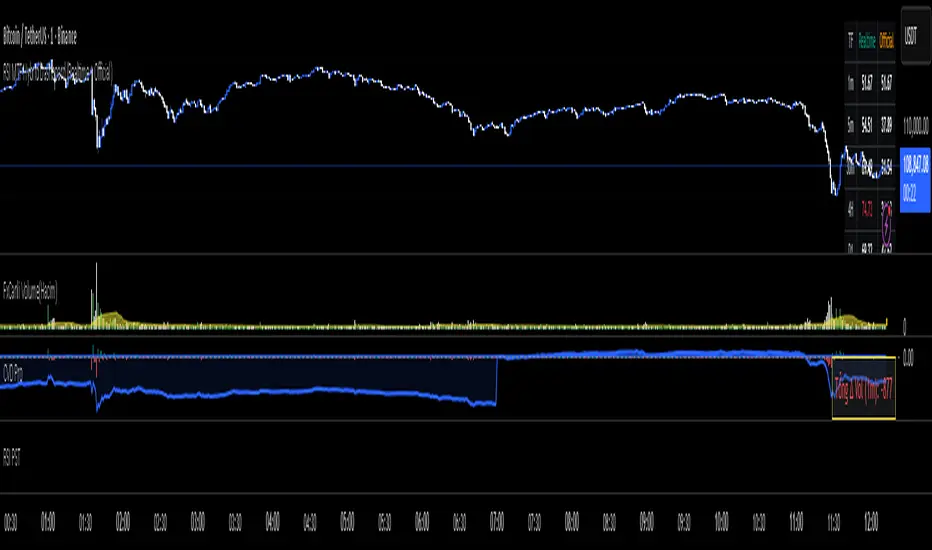
RKT_(CVD + Δ Vol) DESCRIPTION
The Volume & Volume Delta (CVD) indicator tracks buy–sell imbalance to gauge money flow strength. Delta is calculated from aggressive (market) volume and accumulated into CVD to identify directional flow. Suitable for crypto/futures/forex, intraday and swing trading.
HOW TO USE
When Delta > 0 and CVD makes higher highs → favor the uptrend; when Delta < 0 and CVD makes lower lows → favor the downtrend.
Divergence between price and CVD suggests potential reversals or pullbacks.
Recommend confirming with price structure/MA/volume before acting.
#1 Vishal Toora Buy Sell Tablecopyright Vishal Toora
**“© 2025 Vishal Toora — counting volumes so you don’t have to. Buy, sell, or just stare at the screen.”**
Or a few more playful options:
1. **“© Vishal Toora — making deltas speak louder than your ex.”**
2. **“© Vishal Toora — one signal to rule them all (Buy/Sell/Neutral).”**
3. **“© Vishal Toora — because guessing markets is so 2024.”**
Disclaimer: This indicator is for educational and informational purposes only. I do not claim 100% accuracy, and you are responsible for your own trading decisions.

SigmaKernel - AdaptiveSigmaKernel - Adaptive Self-Optimizing Multi-Factor Trading System
SigmaKernel - Adaptive is a self-learning algorithmic trading strategy that combines four distinct analytical dimensions—momentum, market structure, volume flow, and reversal patterns—within a machine-learning-inspired framework that continuously adjusts its own parameters based on realized trading performance. Unlike traditional fixed-parameter strategies that maintain static weightings regardless of market conditions or results, this system implements a feedback loop that tracks which signal types, directional biases, and market conditions produce profitable outcomes, then mathematically adjusts component weightings, minimum score thresholds, position sizing multipliers, and trade spacing requirements to optimize future performance.
The strategy is designed for futures traders operating on prop firm accounts or live capital, incorporating realistic execution mechanics including configurable entry modes (stop breakout orders, limit pullback entries, or market-on-open), commission structures calibrated to retail futures contracts ($0.62 per contract default), one-tick slippage modeling, and professional risk controls including trailing drawdown guards, daily loss limits, and weekly profit targets. The system features universal futures compatibility—it automatically detects and adapts to any futures contract by reading the instrument's tick size and point value directly from the chart, eliminating the need for manual configuration across different markets.
What Makes This Approach Different
Adaptive Weight Optimization System
The core differentiation is the adaptive learning architecture. The strategy maintains four independent scoring components: momentum analysis (using RSI multi-timeframe, MACD histogram, and DMI/ADX), market structure detection (breakout identification via pivot-based support/resistance and moving average positioning), volume flow analysis (Volume Price Trend indicator with standard deviation confirmation), and reversal pattern recognition (oversold/overbought conditions combined with structural levels).
Each component generates a directional score that is multiplied by its current weight. After every closed trade, the system performs a retrospective analysis on the last N trades (configurable Learning Period, default 15 trades) to calculate win rates for each signal type independently. For example, if momentum-driven trades won 65% of the time while reversal trades won only 35%, the adaptive algorithm increases the momentum weight and decreases the reversal weight proportionally. The adjustment formula is:
New_Weight = Current_Weight + (Component_Win_Rate - Average_Win_Rate) × Adaptation_Speed
This creates a self-correcting mechanism where successful signal generators receive more influence in future composite scores, while underperforming components are de-emphasized. The system separately tracks long versus short win rates and applies directional bias corrections—if shorts consistently outperform longs, the strategy applies a 10% reduction to bullish signals to prevent fighting the prevailing market character.
Dynamic Parameter Adjustment
Beyond component weightings, three critical strategy parameters self-adjust based on performance:
Minimum Signal Score: The threshold required to trigger a trade. If overall win rate falls below 45%, the system increments this threshold by 0.10 per adjustment cycle, making the strategy more selective. If win rate exceeds 60%, the threshold decreases to allow more opportunities. This prevents the strategy from overtrading during unfavorable conditions and capitalizes on high-probability environments.
Risk Multiplier: Controls position sizing aggression. When drawdown exceeds 5%, risk per trade reduces by 10% per cycle. When drawdown falls below 2%, risk increases by 5% per cycle. This implements the professional risk management principle of "bet small when losing, bet bigger when winning" algorithmically.
Bars Between Trades: Spacing filter to prevent overtrading. Base value (default 9 bars) multiplies by drawdown factor and losing streak factor. During drawdown or consecutive losses, spacing expands up to 2x to allow market conditions to change before re-entering.
All adaptation operates during live forward-testing or real trading—there is no in-sample optimization applied to historical data. The system learns solely from its own realized trades.
Universal Futures Compatibility
The strategy implements universal futures instrument detection that automatically adapts to any futures contract without requiring manual configuration. Instead of hardcoding specific contract specifications, the system reads three critical values directly from TradingView's symbol information:
Tick Size Detection: Uses `syminfo.mintick` to obtain the minimum price increment for the current instrument. This value varies widely across markets—ES trades in 0.25 ticks, crude oil (CL) in 0.01 ticks, gold (GC) in 0.10 ticks, and treasury futures (ZB) in increments of 1/32nds. The strategy adapts all entry buffer calculations and stop placement logic to the detected tick size.
Point Value Detection: Uses `syminfo.pointvalue` to determine the dollar value per full point of price movement. For ES, one point equals $50; for crude oil, one point equals $1,000; for gold, one point equals $100. This automatic detection ensures accurate P&L calculations and risk-per-contract measurements across all instruments.
Tick Value Calculation: Combines tick size and point value to compute dollar value per tick: Tick_Value = Tick_Size × Point_Value. This derived value drives all position sizing calculations, ensuring the risk management system correctly accounts for each instrument's economic characteristics.
This universal approach means the strategy functions identically on emini indices (ES, MES, NQ, MNQ), micro indices, energy contracts (CL, NG, RB), metals (GC, SI, HG), agricultural futures (ZC, ZS, ZW), treasury futures (ZB, ZN, ZF), currency futures (6E, 6J, 6B), and any other futures contract available on TradingView. No parameter adjustments or instrument-specific branches exist in the code—the adaptation happens automatically through symbol information queries.
Stop-Out Rate Monitoring System
The strategy includes an intelligent stop-out rate tracking system that monitors the percentage of your last 20 trades (or available trades if fewer than 20) that were stopped out. This metric appears in the dashboard's Performance section with color-coded guidance:
Green (<30% stop-out rate): Very few trades are being stopped out. This suggests either your stops are too loose (giving back profits on reversals) or you're in an exceptional trending market. Consider tightening your Stop Loss ATR multiplier to lock in profits more efficiently.
Orange (30-65% stop-out rate): Healthy range. Your stop placement is appropriately sized for current market conditions and the strategy's risk-reward profile. No adjustment needed.
Red (>65% stop-out rate): Too many trades are being stopped out prematurely. Your stops are likely too tight for the current volatility regime. Consider widening your Stop Loss ATR multiplier to give trades more room to develop.
Critical Design Philosophy: Unlike some systems that automatically adjust stops based on performance statistics, this strategy intentionally keeps stop-loss control in the user's hands. Automatic stop adjustment creates dangerous feedback loops—widening stops increases risk per contract, which forces position size reduction, which distorts performance metrics, leading to incorrect adaptations. Instead, the dashboard provides visibility into stop performance, empowering you to make informed manual adjustments when warranted. This preserves the integrity of the adaptive system while giving you the critical data needed for stop optimization.
Execution Kernel Architecture
The entry system offers three distinct execution modes to match trader preference and market character:
StopBreakout Mode: Places buy-stop orders above the prior bar's high (for longs) or sell-stop orders below the prior bar's low (for shorts), plus a 2-tick buffer. This ensures entries only occur when price confirms directional momentum by breaking recent structure. Ideal for trending and momentum-driven markets.
LimitPullback Mode: Places limit orders at a pullback price calculated as: Entry_Price = Close - (ATR × Pullback_Multiplier) for longs, or Close + (ATR × Pullback_Multiplier) for shorts. Default multiplier is 0.5 ATR. This waits for mean-reversion before entering in the signal direction, capturing better prices in volatile or oscillating markets.
MarketNextOpen Mode: Executes at market on the bar immediately following signal generation. This provides fastest execution but sacrifices the filtering effect of requiring price confirmation.
All pending entry orders include a configurable Time-To-Live (TTL, default 6 bars). If an order is not filled within the TTL period, it cancels automatically to prevent stale signals from executing in changed market conditions.
Professional Exit Management
The exit system implements a three-stage progression: initial stop loss, breakeven adjustment, and dynamic trailing stop.
Initial Stop Loss: Calculated as entry price ± (ATR × User_Stop_Multiplier × Volatility_Adjustment). Users have direct control via the Stop Loss ATR multiplier (default 1.25). The system then applies volatility regime adjustments: ×1.2 in high-volatility environments (stops automatically widen), ×0.8 in low volatility (stops tighten), ×1.0 in normal conditions. This ensures stops adapt to market character while maintaining user control over baseline risk tolerance.
Breakeven Trigger: When profit reaches a configurable multiple of initial risk (default 1.0R), the stop loss automatically moves to breakeven (entry price). This locks in zero-loss status once the trade demonstrates favorable movement.
Trailing Stop Activation: When profit reaches the Trail_Trigger_R multiple (default 1.2R), the system cancels the fixed stop and activates a dynamic trailing stop. The trail uses Step and Offset parameters defined in R-multiples. For example, with Trail_Offset_R = 1.0 and Trail_Step_R = 1.5, the stop trails 1.0R behind price and moves in 1.5R increments. This captures extended moves while protecting accumulated profit.
Additional failsafes include maximum time-in-trade (exits after N bars if specified) and end-of-session flatten (automatically closes all positions X minutes before session end to avoid overnight exposure).
Core Calculation Methodology
Signal Component Scoring
Momentum Component:
- Calculates 14-period DMI (Directional Movement Index) with ADX strength filter (trending when ADX > 25)
- Computes three RSI timeframes: fast (7-period), medium (14-period), slow (21-period)
- Analyzes MACD (12/26/9) histogram for directional acceleration
- Bullish momentum: uptrend (DI+ > DI- with ADX > 25) + MACD histogram rising above zero + RSI fast between 50-80 = +1.6 score
- Bearish momentum: downtrend (DI- > DI+ with ADX > 25) + MACD histogram falling below zero + RSI fast between 20-50 = -1.6 score
- Score multiplies by volatility adjustment factor: ×0.8 in high volatility (momentum less reliable), ×1.2 in low volatility (momentum more persistent)
Structure Component:
- Identifies swing highs and lows using 10-bar pivot lookback on both sides
- Maintains most recent swing high as dynamic resistance, most recent swing low as dynamic support
- Detects breakouts: bullish when close crosses above resistance with prior bar below; bearish when close crosses below support with prior bar above
- Breakout score: ±1.0 for confirmed break
- Moving average alignment: +0.5 when price > SMA20 > SMA50 (bullish structure); -0.5 when price < SMA20 < SMA50 (bearish structure)
- Total structure range: -1.5 to +1.5
Volume Component:
- Calculates Volume Price Trend: VPT = Σ [(Close - Close ) / Close × Volume]
- Compares VPT to its 10-period EMA as signal line (similar to MACD logic)
- Computes 20-period volume moving average and standard deviation
- High volume event: current volume > (volume_average + 1× std_dev)
- Bullish volume: VPT > VPT_signal AND high_volume = +1.0
- Bearish volume: VPT < VPT_signal AND high_volume = -1.0
- No score if volume is not elevated (filters out low-conviction moves)
Reversal Component:
- Identifies extreme RSI conditions: RSI slow < 30 (oversold) or > 70 (overbought)
- Requires structural confluence: price at or below support level for bullish reversal; at or above resistance for bearish reversal
- Requires momentum shift: RSI fast must be rising (for bull) or falling (for bear) to confirm reversal in progress
- Bullish reversal: RSI < 30 AND price ≤ support AND RSI rising = +1.0
- Bearish reversal: RSI > 70 AND price ≥ resistance AND RSI falling = -1.0
Composite Score Calculation
Final_Score = (Momentum × Weight_M) + (Structure × Weight_S) + (Volume × Weight_V) + (Reversal × Weight_R)
Initial weights: Momentum = 1.0, Structure = 1.2, Volume = 0.8, Reversal = 0.6
These weights adapt after each trade based on component-specific performance as described above.
The system also applies directional bias adjustment: if recent long trades have significantly lower win rate than shorts, bullish scores multiply by 0.9 to reduce aggressive long entries. Vice versa for underperforming shorts.
Position Sizing Algorithm
The position sizing calculation incorporates multiple confidence factors and automatically scales to any futures contract:
1. Base risk amount = Account_Size × Base_Risk_Percent × Adaptive_Risk_Multiplier
2. Stop distance in price units = ATR × User_Stop_Multiplier × Volatility_Regime_Multiplier × Entry_Buffer
3. Risk per contract = Stop_Distance × Dollar_Per_Point (automatically detected from instrument)
4. Raw position size = Risk_Amount / Risk_Per_Contract
Then applies confidence scaling:
- Signal confidence = min(|Weighted_Score| / Min_Score_Threshold, 2.0) — higher scores receive larger size, capped at 2×
- Direction confidence = Long_Win_Rate (for bulls) or Short_Win_Rate (for bears)
- Type confidence = Win_Rate of dominant signal type (momentum/structure/volume/reversal)
- Total confidence = (Signal_Confidence + Direction_Confidence + Type_Confidence) / 3
Adjusted size = Raw_Size × Total_Confidence × Losing_Streak_Reduction
Losing streak reduction = 0.5 if losing_streak ≥ 5, otherwise 1.0
Universal Maximum Position Calculation: Instead of hardcoded limits per instrument, the system calculates maximum position size as: Max_Contracts = Account_Size / 25000, clamped between 1 and 10 contracts. This means a $50,000 account allows up to 2 contracts, a $100,000 account allows up to 4 contracts, regardless of which futures contract is being traded. This universal approach maintains consistent risk exposure across different instruments while preventing overleveraging.
Final size is rounded to integer and bounded by the calculated maximum.
Session and Risk Management System
Timezone-Aware Session Control
The strategy implements timezone-correct session filtering. Users specify session start hour, end hour, and timezone from 12 supported zones (New York, Chicago, Los Angeles, London, Frankfurt, Moscow, Tokyo, Hong Kong, Shanghai, Singapore, Sydney, UTC). The system converts bar timestamps to the selected timezone before applying session logic.
For split sessions (e.g., Asian session 18:00-02:00), the logic correctly handles time wraparound. Weekend trading can be optionally disabled (default: disabled) to avoid low-liquidity weekend price action.
Multi-Layer Risk Controls
Daily Loss Limit: Strategy ceases all new entries when daily P&L reaches negative threshold (default $2,000). This prevents catastrophic drawdown days. Resets at timezone-corrected day boundary.
Weekly Profit Target: Strategy ceases trading when weekly profit reaches target (default $10,000). This implements the professional principle of "take the win and stop pushing luck." Resets on timezone-corrected Monday.
Maximum Daily Trades: Hard cap on entries per day (default 20) to prevent overtrading during volatile conditions when many signals may generate.
Trailing Drawdown Guard: Optional prop-firm-style trailing stop on account equity. When enabled, if equity drops below (Peak_Equity - Trailing_DD_Amount), all trading halts. This simulates the common prop firm rule where exceeding trailing drawdown results in account termination.
All limits display status in the real-time dashboard, showing "MAX LOSS HIT", "WEEKLY TARGET MET", or "ACTIVE" depending on current state.
How To Use This Strategy
Initial Setup
1. Apply the strategy to your desired futures chart (tested on 5-minute through daily timeframes)
2. The strategy will automatically detect your instrument's specifications—no manual configuration needed for different contracts
3. Configure your account size and risk parameters in the Core Settings section
4. Set your trading session hours and timezone to match your availability
5. Adjust the Stop Loss ATR multiplier based on your risk tolerance (0.8-1.2 for tighter stops, 1.5-2.5 for wider stops)
6. Select your preferred entry execution mode (recommend StopBreakout for beginners)
7. Enable adaptation (recommended) or disable for fixed-parameter operation
8. Review the strategy's Properties in the Strategy Tester settings and verify commission/slippage match your broker's actual costs
The universal futures detection means you can switch between ES, NQ, CL, GC, ZB, or any other futures contract without changing any strategy parameters—the system will automatically adapt its calculations to each instrument's unique specifications.
Dashboard Interpretation
The strategy displays a comprehensive real-time dashboard in the top-right corner showing:
Market State Section:
- Trend: Shows UPTREND/DOWNTREND/CONSOLIDATING/NEUTRAL based on ADX and DMI analysis
- ADX Value: Current trend strength (>25 = strong trend, <20 = consolidating)
- Momentum: BULL/BEAR/NEUTRAL classification with current momentum score
- Volatility: HIGH/LOW/NORMAL regime with ATR percentage of price
Volume Profile Section (Large dashboard only):
- VPT Flow: Directional bias from volume analysis
- Volume Status: HIGH/LOW/NORMAL with relative volume multiplier
Performance Section:
- Daily P&L: Current day's profit/loss with color coding
- Daily Trades: Number of completed trades today
- Weekly P&L: Current week's profit/loss
- Target %: Progress toward weekly profit target
- Stop-Out Rate: Percentage of last 20 trades (or available trades if <20) that were stopped out. Includes all stop types: initial stops, breakeven stops, trailing stops, timeout exits, and EOD flattens. Color coded with actionable guidance:
- Green (<30%): Shows "TIGHTEN" guidance. Very few stop-outs suggests stops may be too loose or exceptional market conditions. Consider reducing Stop Loss ATR multiplier.
- Orange (30-65%): Shows "OK" guidance. Healthy stop-out rate indicating appropriate stop placement for current conditions.
- Red (>65%): Shows "WIDEN" guidance. Too many premature stop-outs. Consider increasing Stop Loss ATR multiplier to give trades more room.
- Status: Overall trading status (ACTIVE/MAX LOSS HIT/WEEKLY TARGET MET/FILTERS ACTIVE)
Adaptive Engine Section:
- Min Score: Current minimum threshold for trade entry (higher = more selective)
- Risk Mult: Current position sizing multiplier (adjusts with performance)
- Bars BTW: Current minimum bars required between trades
- Drawdown: Current drawdown percentage from equity peak
- Weights: M/S/V/R showing current component weightings
Win Rates Section:
- Type: Win rates for Momentum, Structure, Volume, Reversal signal types
- Direction: Win rates for Long vs Short trades
Color coding shows green for >50% win rate, red for <50%
Session Info Section:
- Session Hours: Active trading window with timezone
- Weekend Trading: ENABLED/DISABLED status
- Session Status: ACTIVE/INACTIVE based on current time
Signal Generation and Entry
The strategy generates entries when the weighted composite score exceeds the adaptive minimum threshold (initial value configurable, typically 1.5 to 2.5). Entries display as layered triangle markers on the chart:
- Long Signal: Three green upward triangles below the entry bar
- Short Signal: Three red downward triangles above the entry bar
Triangle tooltip shows the signal score and dominant signal type (MOMENTUM/STRUCTURE/VOLUME/REVERSAL).
Position Management and Stop Optimization
Once entered, the strategy automatically manages the position through its three-stage exit system. Monitor the Stop-Out Rate metric in the dashboard to optimize your stop placement:
If Stop-Out Rate is Green (<30%): You're rarely being stopped out. This could mean:
- Your stops are too loose, allowing trades to give back too much profit on reversals
- You're in an exceptional trending market where tight stops would work better
- Action: Consider reducing your Stop Loss ATR multiplier by 0.1-0.2 to tighten stops and lock in profits more efficiently
If Stop-Out Rate is Orange (30-65%): Optimal range. Your stops are appropriately sized for the strategy's risk-reward profile and current market volatility. No adjustment needed.
If Stop-Out Rate is Red (>65%): You're being stopped out too frequently. This means:
- Your stops are too tight for current market volatility
- Trades need more room to develop before reaching profit targets
- Action: Increase your Stop Loss ATR multiplier by 0.1-0.3 to give trades more breathing room
Remember: The stop-out rate calculation includes all exit types (initial stops, breakeven stops, trailing stops, timeouts, EOD flattens). A trade that reaches breakeven and gets stopped out at entry price counts as a stop-out, even though it didn't lose money. This is intentional—it indicates the stop placement didn't allow the trade to develop into profit.
Optimization Workflow
For traders wanting to customize the strategy for their specific instrument and timeframe:
Week 1-2: Run with defaults, adaptation enabled
Allow the system to execute at least 30-50 trades (the Learning Period plus additional buffer). Monitor which session periods, signal types, and market conditions produce the best results. Observe your stop-out rate—if it's consistently red or green, plan to adjust Stop Loss ATR multiplier after the learning period. Do not adjust parameters yet—let the adaptive system establish baseline performance data.
Week 3-4: Analyze adaptation behavior and optimize stops
Review the dashboard's adaptive weights and win rates. If certain signal types consistently show <40% win rate, consider slightly reducing their base weight. If a particular entry mode produces better fill quality and win rate, switch to that mode. If you notice the minimum score threshold has climbed very high (>3.0), market conditions may not suit the strategy's logic—consider switching instruments or timeframes.
Based on your Stop-Out Rate observations:
- Consistently <30%: Reduce Stop Loss ATR multiplier by 0.2-0.3
- Consistently >65%: Increase Stop Loss ATR multiplier by 0.2-0.4
- Oscillating between zones: Leave stops at default and let volatility regime adjustments handle it
Ongoing: Fine-tune risk and execution
Adjust the following based on your risk tolerance and account type:
- Base Risk Per Trade: 0.5% for conservative, 0.75% for moderate, 1.0% for aggressive
- Stop Loss ATR Multiplier: 0.8-1.2 for tight stops (scalping), 1.5-2.5 for wide stops (swing trading)
- Bars Between Trades: Lower (5-7) for more opportunities, higher (12-20) for more selective
- Entry Mode: Experiment between modes to find best fit for current market character
- Session Hours: Narrow to specific high-performance session windows if certain hours consistently underperform
Never adjust: Do not manually modify the adaptive weights, minimum score, or risk multiplier after the system has begun learning. These parameters are self-optimizing and manual interference defeats the adaptive mechanism.
Parameter Descriptions and Optimization Guidelines
Adaptive Intelligence Group
Enable Self-Optimization (default: true): Master switch for the adaptive learning system. When enabled, component weights, minimum score, risk multiplier, and trade spacing adjust based on realized performance. Disable to run the strategy with fixed parameters (useful for comparing adaptive vs non-adaptive performance).
Learning Period (default: 15 trades): Number of most recent trades to analyze for performance calculations. Shorter values (10-12) adapt more quickly to recent conditions but may overreact to variance. Longer values (20-30) produce more stable adaptations but respond slower to regime changes. For volatile markets, use shorter periods. For stable trends, use longer periods.
Adaptation Speed (default: 0.25): Controls the magnitude of parameter adjustments per learning cycle. Lower values (0.05-0.15) make gradual, conservative changes. Higher values (0.35-0.50) make aggressive adjustments. Faster adaptation helps in rapidly changing markets but increases parameter instability. Start with default and increase only if you observe the system failing to adapt quickly enough to obvious performance patterns.
Performance Memory (default: 100 trades): Maximum number of historical trades stored for analysis. This array size does not affect learning (which uses only Learning Period trades) but provides data for future analytics features including stop-out rate tracking. Higher values consume more memory but provide richer historical dataset. Typical users should not need to modify this.
Core Settings Group
Account Size (default: $50,000): Starting capital for position sizing calculations. This should match your actual account size for accurate risk per trade. The strategy uses this value to calculate dollar risk amounts and determine maximum position size (1 contract per $25,000).
Weekly Profit Target (default: $10,000): When weekly P&L reaches this value, the strategy stops taking new trades for the remainder of the week. This implements a "quit while ahead" rule common in professional trading. Set to a realistic weekly goal—20% of account size per week ($10K on $50K) is very aggressive; 5-10% is more sustainable.
Max Daily Loss (default: $2,000): When daily P&L reaches this negative threshold, strategy stops all new entries for the day. This is your maximum acceptable daily loss. Professional traders typically set this at 2-4% of account size. A $2,000 loss on a $50,000 account = 4%.
Base Risk Per Trade % (default: 0.5%): Initial percentage of account to risk on each trade before adaptive multiplier and confidence scaling. 0.5% is conservative, 0.75% is moderate, 1.0-1.5% is aggressive. Remember that actual risk per trade = Base Risk × Adaptive Risk Multiplier × Confidence Factors, so the realized risk will vary.
Trade Filters Group
Base Minimum Signal Score (default: 1.5): Initial threshold that composite weighted score must exceed to generate a signal. Lower values (1.0-1.5) produce more trades with lower average quality. Higher values (2.0-3.0) produce fewer, higher-quality setups. This value adapts automatically when adaptive mode is enabled, but the base sets the starting point. For trending markets, lower values work well. For choppy markets, use higher values.
Base Bars Between Trades (default: 9): Minimum bars that must elapse after an entry before another signal can trigger. This prevents overtrading and allows previous trades time to develop. Lower values (3-6) suit scalping on lower timeframes. Higher values (15-30) suit swing trading on higher timeframes. This value also adapts based on drawdown and losing streaks.
Max Daily Trades (default: 20): Hard limit on total trades per day regardless of signal quality. This prevents runaway trading during extremely volatile days when many signals may generate. For 5-minute charts, 20 trades/day is reasonable. For 1-hour charts, 5-10 trades/day is more typical.
Session Group
Session Start Hour (default: 5): Hour (0-23 format) when trading is allowed to begin, in the timezone specified. For US futures trading in Chicago time, session typically starts at 5:00 or 6:00 PM (17:00 or 18:00) Sunday evening.
Session End Hour (default: 17): Hour when trading stops and no new entries are allowed. For US equity index futures, regular session ends at 4:00 PM (16:00) Central Time.
Allow Weekend Trading (default: false): Whether strategy can trade on Saturday/Sunday. Most futures have low volume on weekends; keeping this disabled is recommended unless you specifically trade Sunday evening open.
Session Timezone (default: America/Chicago): Timezone for session hour interpretation. Select your local timezone or the timezone of your instrument's primary exchange. This ensures session logic aligns with your intended trading hours.
Prop Guards Group
Trailing Drawdown Guard (default: false): Enables prop-firm-style trailing maximum drawdown. When enabled, if equity drops below (Peak Equity - Trailing DD Amount), all trading halts for the remainder of the backtest/live session. This simulates rules used by funded trader programs where exceeding trailing drawdown terminates the account.
Trailing DD Amount (default: $2,500): Dollar amount of drawdown allowed from equity peak. If your equity reaches $55,000, the trailing stop sets at $52,500. If equity then drops to $52,499, the guard triggers and trading ceases.
Execution Kernel Group
Entry Mode (default: StopBreakout):
- StopBreakout: Places stop orders above/below signal bar requiring price confirmation
- LimitPullback: Places limit orders at pullback prices seeking better fills
- MarketNextOpen: Executes immediately at market on next bar
Limit Offset (default: 0.5x ATR): For LimitPullback mode, how far below/above current price to place the limit order. Smaller values (0.3-0.5) seek minor pullbacks. Larger values (0.8-1.2) wait for deeper retracements but may miss trades.
Entry TTL (default: 6 bars, 0=off): Bars an entry order remains pending before cancelling. Shorter values (3-4) keep signals fresh. Longer values (8-12) allow more time for fills but risk executing stale signals. Set to 0 to disable TTL (orders remain active indefinitely until filled or opposite signal).
Exits Group
Stop Loss (default: 1.25x ATR): Base stop distance as a multiple of the 14-period ATR. This is your primary risk control parameter and directly impacts your stop-out rate. Lower values (0.8-1.0) create tighter stops that reduce risk per trade but may get stopped out prematurely in volatile conditions—expect stop-out rates above 65% (red zone). Higher values (1.5-2.5) give trades more room to breathe but increase risk per contract—expect stop-out rates below 30% (green zone). The system applies additional volatility regime adjustments on top of this base: ×1.2 in high volatility environments (stops widen automatically), ×0.8 in low volatility (stops tighten), ×1.0 in normal conditions. For scalping on lower timeframes, use 0.8-1.2. For swing trading on higher timeframes, use 1.5-2.5. Monitor the Stop-Out Rate metric in the dashboard and adjust this parameter to keep it in the healthy 30-65% orange zone.
Move to Breakeven at (default: 1.0R): When profit reaches this multiple of initial risk, stop moves to breakeven. 1.0R means after price moves in your favor by the distance you risked, you're protected at entry price. Lower values (0.5-0.8R) lock in breakeven faster. Higher values (1.5-2.0R) allow more room before protection.
Start Trailing at (default: 1.2R): When profit reaches this multiple, the fixed stop transitions to a dynamic trailing stop. This should be greater than the BE trigger. Values typically range 1.0-2.0R depending on how much profit you want secured before trailing activates.
Trail Offset (default: 1.0R): How far behind price the trailing stop follows. Tighter offsets (0.5-0.8R) protect profit more aggressively but may exit prematurely. Wider offsets (1.5-2.5R) allow more room for profit to run but risk giving back more on reversals.
Trail Step (default: 1.5R): How far price must move in profitable direction before the stop advances. Smaller steps (0.5-1.0R) move the stop more frequently, tightening protection continuously. Larger steps (2.0-3.0R) move the stop less often, giving trades more breathing room.
Max Bars In Trade (default: 0=off): Maximum bars allowed in a position before forced exit. This prevents trades from "going stale" during periods of no meaningful price action. For 5-minute charts, 50-100 bars (4-8 hours) is reasonable. For daily charts, 5-10 bars (1-2 weeks) is typical. Set to 0 to disable.
Flatten near Session End (default: true): Whether to automatically close all positions as session end approaches. Recommended to avoid carrying positions into off-hours with low liquidity.
Minutes before end (default: 5): How many minutes before session end to flatten. 5-15 minutes provides buffer for order execution before the session boundary.
Visual Effects Configuration Group
Dashboard Size (default: Normal): Controls information density in the dashboard. Small shows only critical metrics (excludes stop-out rate). Normal shows comprehensive data including stop-out rate. Large shows all available metrics including weights, session info, and volume analysis. Larger sizes consume more screen space but provide complete visibility.
Show Quantum Field (default: true): Displays animated grid pattern on the chart indicating market state. Disable if you prefer cleaner charts or experience performance issues on lower-end hardware.
Show Wick Pressure Lines (default: true): Draws dynamic lines from bars with extreme wicks, indicating potential support/resistance or liquidity absorption zones. Disable for simpler visualization.
Show Morphism Energy Beams (default: true): Displays directional beams showing momentum energy flow. Beams intensify during strong trends. Disable if you find this visually distracting.
Show Order Flow Clouds (default: true): Draws translucent boxes representing volume flow bullish/bearish bias. Disable for cleaner price action visibility.
Show Fractal Grid (default: true): Displays multi-timeframe support/resistance levels based on fractal price structure at 10/20/30/40/50 bar periods. Disable if you only want to see primary pivot levels.
Glow Intensity (default: 4): Controls the brightness and thickness of visual effects. Lower values (1-2) for subtle visualization. Higher values (7-10) for maximum visibility but potentially cluttered charts.
Color Theme (default: Cyber): Visual color scheme. Cyber uses cyan/magenta futuristic colors. Quantum uses aqua/purple. Matrix uses green/red terminal style. Aurora uses pastel pink/purple gradient. Choose based on personal preference and monitor calibration.
Show Watermark (default: true): Displays animated watermark at bottom of chart with creator credit and current P&L. Disable if you want completely clean charts or need screen space.
Performance Characteristics and Best Use Cases
Optimal Conditions
This strategy performs best in markets exhibiting:
Trending phases with periodic pullbacks: The combination of momentum and structure components excels when price establishes directional bias but provides retracement opportunities for entries. Markets with 60-70% trending bars and 30-40% consolidation produce the highest win rates.
Medium to high volatility: The ATR-based stop sizing and dynamic risk adjustment require sufficient price movement to generate meaningful profit relative to risk. Instruments with 2-4% daily ATR relative to price work well. Extremely low volatility (<1% daily ATR) generates too many scratch trades.
Clear volume patterns: The VPT volume component adds significant edge when volume expansions align with directional moves. Instruments and timeframes where volume data reflects actual transaction flow (versus tick volume proxies) perform better.
Regular session structure: Futures markets with defined opening and closing hours, consistent liquidity throughout the session, and clear overnight/day session separation allow the session controls and time-based failsafes to function optimally.
Sufficient liquidity for stop execution: The stop breakout entry mode requires that stop orders can fill without significant slippage. Highly liquid contracts work better than illiquid instruments where stop orders may face adverse fills.
Suboptimal Conditions
The strategy may struggle with:
Extreme chop with no directional persistence: When ADX remains below 15 for extended periods and price oscillates rapidly without establishing trends, the momentum component generates conflicting signals. Win rate typically drops below 40% in these conditions, triggering the adaptive system to increase minimum score thresholds until conditions improve. Stop-out rates may also spike into the red zone.
Gap-heavy instruments: Markets with frequent overnight gaps disrupt the continuous price assumptions underlying ATR stops and EMA-based structure analysis. Gaps can also cause stop orders to fill at prices far from intended levels, distorting stop-out rate metrics.
Very low timeframes with excessive noise: On 1-minute or tick charts, the signal components react to micro-structure noise rather than meaningful price swings. The strategy works best on 5-minute through daily timeframes where price movements reflect actual order flow shifts.
Extended low-volatility compression: During historically low volatility periods, profit targets become difficult to reach before mean-reversion occurs. The trail offset, even when set to minimum, may be too wide for the compressed price environment. Stop-out rates may drop to green zone indicating stops should be tightened.
Parabolic moves or climactic exhaustion: Vertical price advances or selloffs where price moves multiple ATRs in single bars can trigger momentum signals at exhaustion points. The structure and reversal components attempt to filter these, but extreme moves may override normal logic.
The adaptive learning system naturally reduces signal frequency and position sizing during unfavorable conditions. If you observe multiple consecutive days with zero trades and "FILTERS ACTIVE" status, this indicates the strategy has self-adjusted to avoid poor conditions rather than forcing trades.
Instrument Recommendations
Emini Index Futures (ES, MES, NQ, MNQ, YM, RTY): Excellent fit. High liquidity, clear volatility patterns, strong volume signals, defined session structure. These instruments have been extensively tested and the universal detection handles all contract specifications automatically.
Micro Index Futures (MES, MNQ, M2K, MYM): Excellent fit for smaller accounts. Same market characteristics as the standard eminis but with reduced contract sizes allowing proper risk management on accounts below $50,000.
Energy Futures (CL, NG, RB, HO): Good to mixed fit. Crude oil (CL) works well due to strong trends and reasonable volatility. Natural gas (NG) can be extremely volatile—consider reducing Base Risk to 0.3-0.4% and increasing Stop Loss ATR multiplier to 1.8-2.2 for NG. The strategy automatically detects the $10/tick value for CL and adjusts position sizing accordingly.
Metal Futures (GC, SI, HG, PL): Good fit. Gold (GC) and silver (SI) exhibit clear trending behavior and work well with the momentum/structure components. The strategy automatically handles the different point values ($100/point for gold, $5,000/point for silver).
Agricultural Futures (ZC, ZS, ZW, ZL): Good fit. Grain futures often trend strongly during seasonal periods. The strategy handles the unique tick sizes (1/4 cent increments) and point values ($50/point for corn/wheat, $60/point for soybeans) automatically.
Treasury Futures (ZB, ZN, ZF, ZT): Good fit for trending rates environments. The strategy automatically handles the fractional tick sizing (32nds for ZB/ZN, halves of 32nds for ZF/ZT) through the universal detection system.
Currency Futures (6E, 6J, 6B, 6A, 6C): Good fit. Major currency pairs exhibit smooth trending behavior. The strategy automatically detects point values which vary significantly ($12.50/tick for 6E, $12.50/tick for 6J, $6.25/tick for 6B).
Cryptocurrency Futures (BTC, ETH, MBT, MET): Mixed fit. These markets have extreme volatility requiring parameter adjustment. Increase Base Risk to 0.8-1.2% and Stop Loss ATR multiplier to 2.0-3.0 to account for wider stop distances. Enable 24-hour trading and weekend trading as these markets have no traditional sessions.
The universal futures compatibility means you can apply this strategy to any of these markets without code modification—simply open the chart of your desired contract and the strategy will automatically configure itself to that instrument's specifications.
Important Disclaimers and Realistic Expectations
This is a sophisticated trading strategy that combines multiple analytical methods within an adaptive framework designed for active traders who will monitor performance and market conditions. It is not a "set and forget" fully automated system, nor should it be treated as a guaranteed profit generator.
Backtesting Realism and Limitations
The strategy includes realistic trading costs and execution assumptions:
- Commission: $0.62 per contract per side (accurate for many retail futures brokers)
- Slippage: 1 tick per entry and exit (conservative estimate for liquid futures)
- Position sizing: Realistic risk percentages and maximum contract limits based on account size
- No repainting: All calculations use confirmed bar data only—signals do not change retroactively
However, backtesting cannot fully capture live trading reality:
- Order fill delays: In live trading, stop and limit orders may not fill instantly at the exact tick shown in backtest
- Volatile periods: During high volatility or low liquidity (news events, rollover days, pre-holidays), slippage may exceed the 1-tick assumption significantly
- Gap risk: The backtest assumes stops fill at stop price, but gaps can cause fills far beyond intended exit levels
- Psychological factors: Seeing actual capital at risk creates emotional pressures not present in backtesting, potentially leading to premature manual intervention
The strategy's backtest results should be viewed as best-case scenarios. Real trading will typically produce 10-30% lower returns than backtest due to the above factors.
Risk Warnings
All trading involves substantial risk of loss. The adaptive learning system can improve parameter selection over time, but it cannot predict future price movements or guarantee profitable performance. Past wins do not ensure future wins.
Losing streaks are inevitable. Even with a 60% win rate, you will encounter sequences of 5, 6, or more consecutive losses due to normal probability distributions. The strategy includes losing streak detection and automatic risk reduction, but you must have sufficient capital to survive these drawdowns.
Market regime changes can invalidate learned patterns. If the strategy learns from 50 trades during a trending regime, then the market shifts to a ranging regime, the adapted parameters may initially be misaligned with the new environment. The system will re-adapt, but this transition period may produce suboptimal results.
Prop firm traders: understand your specific rules. Every prop firm has different rules regarding maximum drawdown, daily loss limits, consistency requirements, and prohibited trading behaviors. While this strategy includes common prop guardrails, you must verify it complies with your specific firm's rules and adjust parameters accordingly.
Never risk capital you cannot afford to lose. This strategy can produce substantial drawdowns, especially during learning periods or market regime shifts. Only trade with speculative capital that, if lost, would not impact your financial stability.
Recommended Usage
Paper trade first: Run the strategy on a simulated account for at least 50 trades or 1 month before committing real capital. Observe how the adaptive system behaves, identify any patterns in losing trades, monitor your stop-out rate trends, and verify your understanding of the entry/exit mechanics.
Start with minimum position sizing: When transitioning to live trading, reduce the Base Risk parameter to 0.3-0.4% initially (vs 0.5-1.0% in testing) to reduce early impact while the system learns your live broker's execution characteristics.
Monitor daily, but do not micromanage: Check the dashboard daily to ensure the strategy is operating normally and risk controls have not triggered unexpectedly. Pay special attention to the Stop-Out Rate metric—if it remains in the red or green zones for multiple days, adjust your Stop Loss ATR multiplier accordingly. However, resist the urge to manually adjust adaptive weights or disable trades based on short-term performance. Allow the adaptive system at least 30 trades to establish patterns before making manual changes.
Combine with other analysis: While this strategy can operate standalone, professional traders typically use systematic strategies as one component of a broader approach. Consider using the strategy for trade execution while applying your own higher-timeframe analysis or fundamental view for trade filtering or sizing adjustments.
Keep a trading journal: Document each week's results, note market conditions (trending vs ranging, high vs low volatility), record stop-out rates and any Stop Loss ATR adjustments you made, and document any manual interventions. Over time, this journal will help you identify conditions where the strategy excels versus struggles, allowing you to selectively enable or disable trading during certain environments.
Technical Implementation Notes
All calculations execute on closed bars only (`calc_on_every_tick=false`) ensuring that signals and values do not repaint. Once a bar closes and a signal generates, that signal is permanent in the history.
The strategy uses fixed-quantity position sizing (`default_qty_type=strategy.fixed, default_qty_value=1`) with the actual contract quantity determined by the position sizing function and passed to the entry commands. This approach provides maximum control over risk allocation.
Order management uses Pine Script's native `strategy.entry()` and `strategy.exit()` functions with appropriate parameters for stops, limits, and trailing stops. All orders include explicit from_entry references to ensure they apply to the correct position.
The adaptive learning arrays (trade_returns, trade_directions, trade_types, trade_hours, trade_was_stopped) are maintained as circular buffers capped at PERFORMANCE_MEMORY size (default 100 trades). When a new trade closes, its data is added to the beginning of the array using `array.unshift()`, and the oldest trade is removed using `array.pop()` if capacity is exceeded. The stop-out tracking system analyzes the trade_was_stopped array to calculate the rolling percentage displayed in the dashboard.
Dashboard rendering occurs only on the confirmed bar (`barstate.isconfirmed`) to minimize computational overhead. The table is pre-created with sufficient rows for the selected dashboard size and cells are populated with current values each update.
Visual effects (fractal grid, wick pressure, morphism beams, order flow clouds, quantum field) recalculate on each bar for real-time chart updates. These are computationally intensive—if you experience chart lag, disable these visual components. The core strategy logic continues to function identically regardless of visual settings.
Timezone conversions use Pine Script's built-in timezone parameter on the `hour()`, `minute()`, and `dayofweek()` functions. This ensures session logic and daily/weekly resets occur at correct boundaries regardless of the chart's default timezone or the server's timezone.
The universal futures detection queries `syminfo.mintick` and `syminfo.pointvalue` on each strategy initialization to obtain the current instrument's specifications. These values remain constant throughout the strategy's execution on a given chart but automatically update when the strategy is applied to a different instrument.
The strategy has been tested on TradingView across timeframes from 5-minute through daily and across multiple futures instrument types including equity indices, energy, metals, agriculture, treasuries, and currencies. It functions identically on all instruments due to the percentage-based risk model and ATR-relative calculations which adapt automatically to price scale and volatility, combined with the universal futures detection system that handles contract-specific specifications.

FVG MagicFVG Magic — Fair Value Gaps with Smart Mitigation, Inversion & Auto-Clean-up
FVG Magic finds every tradable Fair Value Gap (FVG), shows who powered it, and then manages each gap intelligently as price interacts with it—so your chart stays actionable and clean.
Attribution
This tool is inspired by the idea popularized in “Volumatic Fair Value Gaps ” by BigBeluga (licensed CC BY-NC-SA 4.0). Credit to BigBeluga for advancing FVG visualization in the community.
Important: This is a from-scratch implementation—no code was copied from the original. I expanded the concept substantially with a different detection stack, a gap state machine (ACTIVE → 50% SQ → MITIGATED → INVERSED), auto-clean up rules, lookback/nearest-per-side pruning, zoom-proof volume meters, and timeframe auto-tuning for 15m/H1/H4.
What makes this version more accurate
Full-coverage detection (no “missed” gaps)
Default ICT-minimal rule (Bullish: low > high , Bearish: high < low ) catches all valid 3-candle FVGs.
Optional Strict filter (stricter structure checks) for traders who prefer only “clean” gaps.
Optional size percentile filter—off by default so nothing is hidden unless you choose to filter.
Correct handling of confirmations (wick vs close)
Mitigation Source is user-selectable: high/low (wick-based) or close (strict).
This avoids false “misses” when you expect wick confirmations (50% or full fill) but your logic required closes.
State-aware labelling to prevent misleading data
The Bull%/Bear% meter is shown only while a gap is ACTIVE.
As soon as a gap is 50% SQ, MITIGATED, or INVERSED, the meter is hidden and replaced with a clear tag—so you never read stale participation stats.
Robust zoom behaviour
The meter uses a fixed bar-width (not pixels), so it stays proportional and readable at any zoom level.
Deterministic lifecycle (no stale boxes)
Remove on 50% SQ (instant or delayed).
Inversion window after first entry: if price enters but doesn’t invert within N bars, the box auto-removes once fully filled.
Inversion clean up: after a confirmed flip, keep for N bars (context) then delete (or 0 = immediate).
Result: charts auto-maintain themselves and never “lie” about relevance.
Clarity near current price
Nearest-per-side (keep N closest bullish & bearish gaps by distance to the midpoint) focuses attention where it matters without altering detection accuracy.
Lookback (bars) ensures reproducible behaviour across accounts with different data history.
Timeframe-aware defaults
Sensible auto-tuning for 15m / H1 / H4 (right-extension length, meter width, inversion windows, clean up bars) to reduce setup friction and improve consistency.
What it does (under the hood)
Detects FVGs using ICT-minimal (default) or a stricter rule.
Samples volume from a 10× lower timeframe to split participation into Bull % / Bear % (sum = 100%).
Manages each gap through a state machine:
ACTIVE → 50% SQ (midline) → MITIGATED (full) → INVERSED (SR flip after fill).
Auto-clean up keeps only relevant levels, per your rules.
Dashboard (top-right) displays counts by side and the active state tags.
How to use it
First run (show everything)
Use Strict FVG Filter: OFF
Enable Size Filter (percentile): OFF
Mitigation Source: high/low (wick-based) or close (stricter), as you prefer.
Remove on 50% SQ: ON, Delay: 0
Read the context
While ACTIVE, use the Bull%/Bear% meter to gauge demand/supply behind the impulse that created the gap.
Confluence with your HTF structure, sessions, VWAP, OB/FVG, RSI/MACD, etc.
Trade interactions
50% SQ: often the highest-quality interaction; if removal is ON, the box clears = “job done.”
Full mitigation then rejection through the other side → tag changes to INVERSED (acts like SR). Keep for N bars, then auto-remove.
Keep the chart tidy (optional)
If too busy, enable Size Filter or set Nearest per side to 2–4.
Use Lookback (bars) to make behaviour consistent across symbols and histories.
Inputs (key ones)
Use Strict FVG Filter: OFF(default)/ON
Enable Size Filter (percentile): OFF(default)/ON + threshold
Mitigation Source: high/low or close
Remove on 50% SQ + Delay
Inversion window after entry (bars)
Remove inversed after (bars)
Lookback (bars), Nearest per side (N)
Right Extension Bars, Max FVGs, Meter width (bars)
Colours: Bullish, Bearish, Inversed fill
Suggested defaults (per TF)
15m: Extension 50, Max 12, Inversion window 8, Clean up 8, Meter width 20
H1: Extension 25, Max 10, Inversion window 6, Clean up 6, Meter width 15
H4: Extension 15, Max 8, Inversion window 5, Clean up 5, Meter width 10
Notes & edge cases
If a wick hits 50% or the far edge but state doesn’t change, you’re likely on close mode—switch to high/low for wick-based behaviour.
If a gap disappears, it likely met a clean up condition (50% removal, inversion window, inversion clean up, nearest-per-side, lookback, or max-cap).
Meters are hidden after ACTIVE to avoid stale percentages.

RightFlow Universal Volume Profile - Any Market Any TimeframeSummary in one paragraph
RightFlow is a right anchored microstructure volume profile for stocks, futures, FX, and liquid crypto on intraday and daily timeframes. It acts only when several conditions align inside a session window and presents the result as a compact right side profile with value area, POC, a bull bear mix by price bin, and a HUD of profile VWAP and pressure shares. It is original because it distributes each bar’s weight into multiple mid price slices, blends bull bear pressure per bin with a CLV based split, and grows the profile to the right so price action stays readable. Add to a clean chart, read the table, and use the visuals. For conservative workflows read on bar close.
Scope and intent
• Markets. Major FX pairs, index futures, large cap equities and ETFs, liquid crypto.
• Timeframes. One minute to daily.
• Default demo used in the publication. SPY on 15 minute.
• Purpose. See where participation concentrates, which side dominated by price level, and how far price sits from VA and POC.
Originality and usefulness
• Unique fusion. Right anchored growth plus per bar slicing and CLV split, with weight modes Raw, Notional, and DeltaProxy.
• Failure mode addressed. False reads from single bar direction and coarse binning.
• Testability. All parts sit in Inputs and the HUD.
• Portable yardstick. Value Area percent and POC are universal across symbols.
• Protected scripts. Not applicable. Method and use are fully disclosed.
Method overview in plain language
Pick a scope Rolling or Today or This Week. Define a window and number of price bins. For each bar, split its range into small slices, assign each slice a weight from the selected mode, and split that weight by CLV or by bar direction. Accumulate totals per bin. Find the bin with the highest total as POC. Expand left and right until the chosen share of total volume is covered to form the value area. Compute profile VWAP for all, buyers, and sellers and show them with pressure shares.
Base measures
Range basis. High minus low and mid price samples across the bar window.
Return basis. Not used. VWAP trio is price weighted by weights.
Components
• RightFlow Bins. Price histogram that grows to the right.
• Bull Bear Split. CLV based 0 to 1 share or pure bar direction.
• Weight Mode. Raw volume, notional volume times close, or DeltaProxy focus.
• Value Area Engine. POC then outward expansion to target share.
• HUD. Profile VWAP, Buy and Sell percent, winner delta, split and weight mode.
• Session windows optional. Scope resets on day or week.
Fusion rule
Color of each bin is the convex blend of bull and bear shares. Value area shading is lighter inside and darker outside.
Signal rule
This is context, not a trade signal. A strong separation between buy and sell percent with price holding inside VA often confirms balance. Price outside VA with skewed pressure often marks initiative moves.
What you will see on the chart
• Right side bins with blended colors.
• A POC line across the profile width.
• Labels for POC, VAH, and VAL.
• A compact HUD table in the top right.
Table fields and quick reading guide
• VWAP. Profile VWAP.
• Buy and Sell. Pressure shares in percent.
• Delta Winner. Winner side and margin in percent.
• Split and Weight. The active modes.
Reading tip. When Session scope is Today or This Week and Buy minus Sell is clearly positive or negative, that side often controls the day’s narrative.
Inputs with guidance
Setup
• Profile scope. Rolling or session reset. Rolling uses window bars.
• Rolling window bars. Typical 100 to 300. Larger is smoother.
Binning
• Price bins. Typical 32 to 128. More bins increase detail.
• Slices per bar. Typical 3 to 7. Raising it smooths distribution.
Weighting
• Weight mode. Raw, Notional, DeltaProxy. Notional emphasizes expensive prints.
• Bull Bear split. CLV or BarDir. CLV is more nuanced.
• Value Area percent. Typical 68 to 75.
View
• Profile width in bars, color split toggle, value area shading, opacities, POC line, VA labels.
Usage recipes
Intraday trend focus
• Scope Today, bins 64, slices 5, Value Area 70.
• Split CLV, Weight Notional.
Intraday mean reversion
• Scope Today, bins 96, Value Area 75.
• Watch fades back to POC after initiative pushes.
Swing continuation
• Scope Rolling 200 bars, bins 48.
• Use Buy Sell skew with price relative to VA.
Realism and responsible publication
No performance claims. Shapes can move while a bar forms and settle on close. Education only.
Honest limitations and failure modes
Thin liquidity and data gaps can distort bin weights. Very quiet regimes reduce contrast. Session time is the chart venue time.
Open source reuse and credits
None.
Legal
Education and research only. Not investment advice. Test on history and simulation before live use.

Buying/Selling PressureBuying/Selling Pressure - Volume-Based Market Sentiment
Buying/Selling Pressure identifies market dominance by separating volume into buying and selling components. The indicator uses Volume ATR normalization to create a universal pressure oscillator that works consistently across all markets and timeframes.
What is Buying/Selling Pressure?
This indicator answers a fundamental question: Are buyers or sellers in control? By analyzing how volume distributes within each bar, it calculates cumulative buying and selling pressure, then normalizes the result using Volume ATR for cross-market comparability.
Formula: × 100
Where Delta = Buying Volume - Selling Volume
Calculation Methods
Money Flow (Recommended):
Volume weighted by close position in bar range. Close near high = buying pressure, close near low = selling pressure.
Formula: / (high - low)
Simple Delta:
Basic approach where bullish bars = 100% buying, bearish bars = 100% selling.
Weighted Delta:
Volume weighted by body size relative to total range, focusing on candle strength.
Key Features
Volume ATR Normalization: Adapts to volume volatility for consistent readings across assets
Cumulative Delta: Tracks net buying/selling pressure over time (similar to OBV)
Signal Line: EMA smoothing for trend identification and crossover signals
Zero Line: Clear visual separation between buyer and seller dominance
Color-Coded Display: Green area = buyers control, red area = sellers control
Interpretation
Above Zero: Buyers dominating - cumulative buying pressure exceeds selling
Below Zero: Sellers dominating - cumulative selling pressure exceeds buying
Cross Signal Line: Momentum shift - pressure trend changing direction
Increasing Magnitude: Strengthening pressure in current direction
Decreasing Magnitude: Weakening pressure, potential reversal
Volume vs Pressure
High volume with low pressure indicates balanced battle between buyers and sellers. High pressure with high volume confirms strong directional conviction. This separation provides insights beyond traditional volume analysis.
Best Practices
Use with price action for confirmation
Divergences signal potential reversals (price makes new high/low but pressure doesn't)
Large volume with near-zero pressure = indecision, breakout preparation
Signal line crossovers provide momentum change signals
Extreme readings suggest potential exhaustion
Settings
Calculation Method: Choose Money Flow, Simple Delta, or Weighted Delta
EMA Length: Period for cumulative delta smoothing (default: 21)
Signal Line: Optional EMA of oscillator for crossover signals (default: 9)
Buying/Selling Pressure transforms volume analysis into actionable market sentiment, revealing whether buyers or sellers control price action beneath surface volatility.
This indicator is designed for educational and analytical purposes. Past performance does not guarantee future results. Always conduct thorough research and consider consulting with financial professionals before making investment decisions.

CHN-M-HA secure buy/sell indicator for futures and spot trading. A green cloud indicates a trend. A magic line is available as support or a stop level. Buy and sell signals. Voluminous candlesticks are indicated.

SerenitySerenity: Find Serenity in Market Chaos
Every trader starts somewhere, often diving headfirst into the markets with charts cluttered by layers of lines, oscillators, and signals. It's easy to get caught up testing one approach after another—adding more tools, tweaking strategies, chasing the latest idea that promises clarity. The cycle repeats: overload the setup, second-guess every move, switch things up when results don't click right away. Over time, it becomes clear that jumping between setups rarely builds the consistency needed to navigate the ups and downs.
That's where the idea for Serenity came from—a way to step back from the noise and focus on a structured approach that encourages sticking to a plan and building consistency.
Built on the philosophy that no single perspective captures the full picture, Serenity offers two complementary views—Skye and Shade—to provide a more rounded interpretation of the market. Serenity’s logic builds on core market concepts—trend, momentum, and volume—combining them through carefully structured conditions that work across multiple timeframes. By focusing on where these elements align, it highlights key moments in the market while filtering out noise, providing clear and meaningful visual cues for analysis.
How Serenity Works
Serenity is designed to cut through market noise and simplify complex price action. By combining public, simple, everyday indicators and concepts into a progressive decision hierarchy of multi-layered signals, it removes ambiguity and leaves no room for guesswork—providing traders with straightforward, easy-to-read visual cues for decision-making.
Serenity's foundation starts with a core trend bias, built around two key concepts that set the stage for all signals:
Volatility-adjusted trend boundary (ATR-based) defines real-time directional bias using a dynamic channel that expands in choppy markets and tightens in calm ones — it only shifts when price proves real strength or weakness. This provides the overall market context, ensuring signals are in harmony with the prevailing direction.
Four nested volume-weighted price zones create progressive support levels—each acting as a filter for signal quality. These zones build on the trend boundary, requiring price to prove itself at increasing levels of conviction before triggering visuals.
Skye: Agile Momentum
Skye focuses on the faster side of market behavior. It reacts quickly to changes in trend and momentum, making it well-suited for traders who prefer agility and earlier entries. Skye thrives in environments where price moves sharply and timing matters.
Skye activates only when five independent filters align:
Momentum reversal — fast oscillator crosses above slow.
Volume surge — confirms participation strength, signaling that fresh momentum is backed by meaningful activity rather than isolated price movement.
Zone break — price closes above the earliest volume-weighted level.
Trend support — price remains above the dynamic channel.
Directional strength — positive momentum index rises above a required minimum.
This multi-condition gate eliminates single-trigger noise.
Shade: Structural Conviction Filter
Shade takes a more conservative stance, emphasizing broader confirmations and requires sustained dominance across four core pillars:
Long-term structure — price holds above deep volume-weighted trend.
Directional control — one side clearly dominates.
Zone hold — price sustains in mid or deep confluence level.
Volume trend — reveals sustained directional flow, confirming underlying market commitment behind the trend.
Each pillar must confirm — no partial signals.
Twilight & Eclipse: Reversal Cues
Twilight Reversal
Twilight draws attention to areas where upward momentum might begin to build. It serves as a visual cue for zones where buying interest could be forming, helping you focus on potential opportunities for a positive shift in market behavior.
Eclipse Reversal
Eclipse highlights areas where downward pressure may be emerging. It marks zones where sellers could be gaining influence, guiding your attention to potential points where market strength may start to wane.
These markers appear using:
Smoothed divergence — oscillator deviates from price at extremes.
Trend peak — strength index rolls over from overbought/oversold.
Volume opposition — surge against price direction.
What Makes Serenity Unique
What sets Serenity apart is not which concepts or indicators are used—but how they are applied together. Serenity employs a progressive decision hierarchy of multi-layered signals to identify meaningful confluences across trend, momentum, volume, and structure.
Instead of using standard setups that rely on default indicator inputs, Serenity uses carefully chosen, non-standard tailored inputs, ensuring that familiar indicators work together in a unique, confluence-driven way—offering structured context and visually intuitive cues to support clearer decision-making.
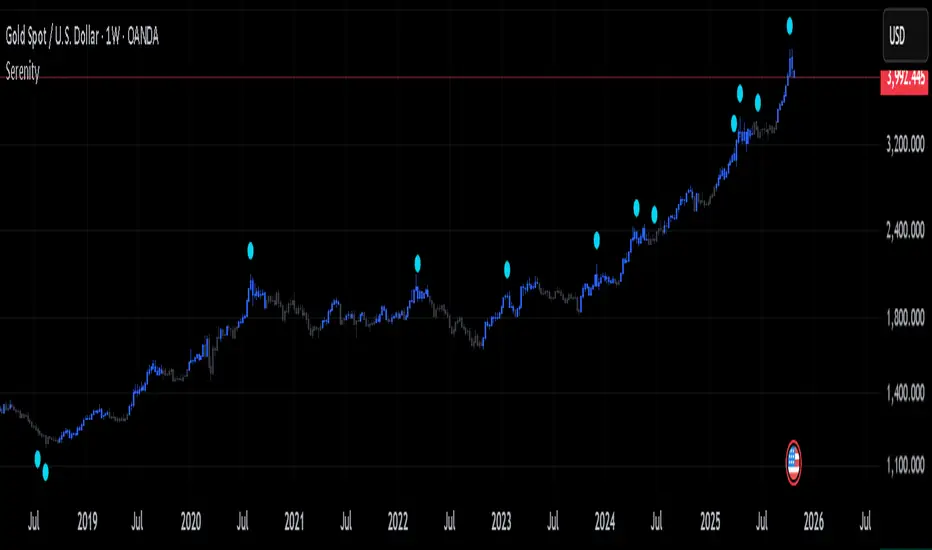
OBV with Divergence (SMA Smoother)Title: OBV Divergence with SMA Smoothing
Description:
This indicator is a powerful tool designed to identify regular (reversal) and hidden (continuation) On-Balance Volume (OBV) divergences against price action. It uses a modified OBV calculation (an OBV Oscillator) and integrates pivot analysis to automatically highlight potential turning points or trend continuations directly on your chart.
Key Features
Advanced Divergence Detection: Automatically detects and labels four types of divergences:
Regular Bullish/Bearish: Signals potential trend reversals.
Regular Bullish: Price makes a Lower Low (LL) but the OBV Oscillator makes a Higher Low (HL).
Regular Bearish: Price makes a Higher High (HH) but the OBV Oscillator makes a Lower High (LH).
Hidden Bullish/Bearish: Signals potential trend continuations.
Hidden Bullish: Price makes a Higher Low (HL) but the OBV Oscillator makes a Lower Low (LL).
Hidden Bearish: Price makes a Lower High (LH) but the OBV Oscillator makes a Higher High (HH).
OBV Oscillator: Instead of plotting the raw OBV, this script uses the difference between the OBV and its Exponential Moving Average (EMA). This technique centers the indicator around zero, making it easier to visualize volume momentum shifts and clearly identify peaks and troughs for divergence analysis.
Optional SMA Smoothing Line (New Feature): An added Simple Moving Average (SMA) line can be toggled on to further smooth the OBV Oscillator. Traders can use this line for crossover signals or to confirm the underlying trend of the volume momentum, reducing whipsaws.
Customizable Lookback: The indicator allows you to define the lookback periods (Pivot Lookback Left/Right) for price and oscillator pivots, giving you precise control over sensitivity. The Max/Min of Lookback Range helps filter out divergences that are too close or too far apart.
