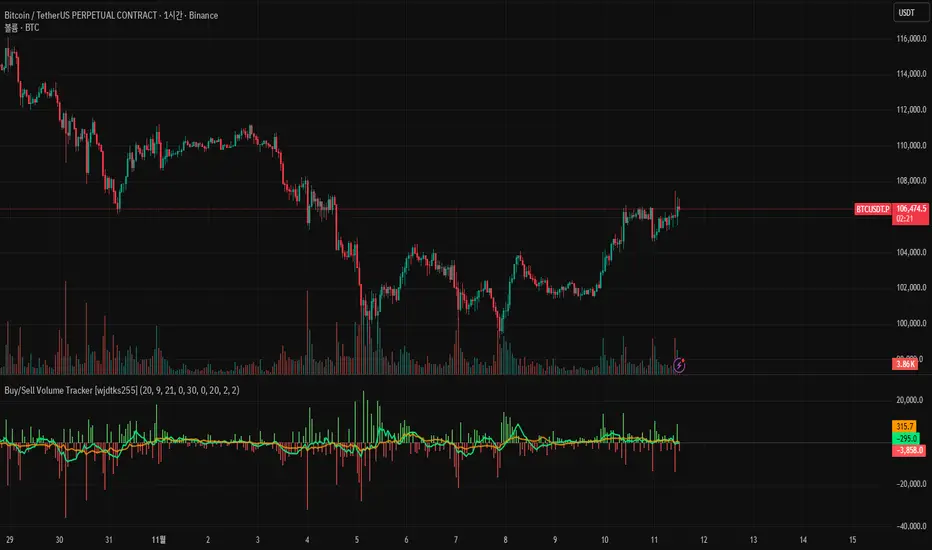
Buy/Sell Volume Tracker [wjdtks255]Indicator Description
Function: Separates buy and sell volume based on candle direction (close ≥ open) and displays the buy−sell difference (hist_val) as a histogram.
Visuals: Buy/sell bars are distinguished by user-selectable colors and opacity; two moving averages (MA1 and MA2) are shown to smooth the flow.
Meaning: A positive histogram indicates buy dominance; a negative histogram indicates sell dominance.
Limitation: The current separation is estimated from candle direction and may differ from execution-side (tick/trade-side) based data.
Trading Rules (Summary)
Conservative trend-following long
Entry: Enter long when hist_val turns above 0 and MA1 crosses MA2 from below.
Stop-loss: Exit if hist_val falls back below 0 or MA1 drops below MA2.
Take-profit: Use a risk:reward of 1:1.5 or set targets based on ATR.
Short-term rebound long
Entry: Enter a short-term long when a large negative histogram region begins to narrow and shows a recovery sign.
Stop-loss: Exit if hist_val drops below the previous low or bearish candles continue.
Take-profit: Prefer quick partial profit-taking.
Short (sell) strategy
Entry: Enter short when hist_val falls below 0 and MA1 crosses MA2 from above.
Stop-loss / Take-profit: Apply the inverse rules of the long strategy.
Filters and risk management
Volume filter: Only accept signals when volume exceeds a fraction of average volume to reduce noise.
Entry strength: Require |hist_val| to exceed a historical average threshold (e.g., avg(|hist_val|, N) × factor) to strengthen signals.
Position sizing: Size positions so that account risk per trade is within limits (e.g., 1–2% of account equity).
Timeframe: Use short timeframes for scalping and 1h+ for swing trading.
Wolumen
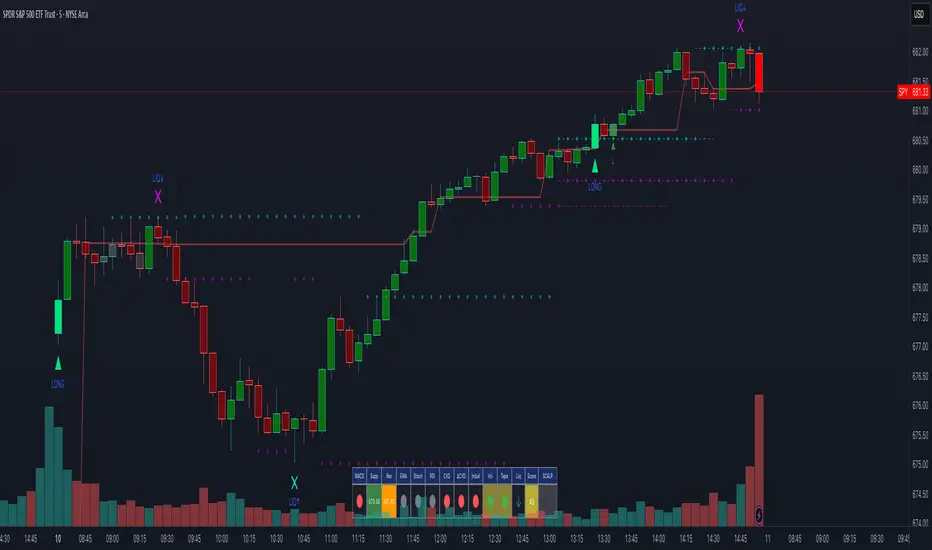
Scalping Dashboard - Volume Candles + Liquidity ZonesScalping Dashboard - Volume Candles + Liquidity Zones
📊 Overview
A comprehensive scalping indicator designed for high-frequency traders on 1-5 minute timeframes. This all-in-one dashboard combines volume analysis, order flow metrics, technical indicators, and institutional liquidity zones to identify high-probability scalping opportunities.
🎯 Key Features
✅ Multi-Timeframe Analysis
Fast MACD (5/13/5) for momentum
Quick EMAs (9/20/50) for trend direction
Rapid Stochastic (5/3/3) for oversold/overbought conditions
Fast RSI (7) for extreme readings
✅ Advanced Order Flow Metrics
CVD (Cumulative Volume Delta): Tracks buy vs sell pressure over time
Delta Momentum: Measures acceleration in buying/selling
Buy/Sell Pressure Ratio: Real-time balance of market forces
Order Flow Imbalance: Detects aggressive buying or selling
Tape Speed: Measures how fast volume is hitting the market
✅ Institutional Liquidity Zones
Buy-Side Liquidity: Areas above price where short stop losses cluster
Sell-Side Liquidity: Areas below price where long stop losses cluster
Liquidity Sweeps: Detects "stop hunts" by institutions before reversals
✅ Volume-Based Candle Coloring
Visual representation of volume intensity
Extreme, High, Normal, and Low volume categories
Fully customizable color schemes
✅ Dynamic Support/Resistance
Volume-weighted price levels
Automatically updates every 3 bars
Shows distance to key levels
📈 Dashboard Indicators Explained
The bottom-left dashboard displays 14 real-time metrics:
▸ MACD (●)
Green = Bullish momentum
Red = Bearish momentum
Gray = Neutral
▸ Supp (Price)
Support level
Green highlight = at support (good for long entry)
▸ Res (Price)
Resistance level
Orange highlight = at resistance (good for short entry)
▸ EMA (●)
Green = Price above EMAs (bullish)
Red = Price below EMAs (bearish)
▸ Stoch (●)
Green = Oversold (<20)
Red = Overbought (>80)
Gray = Neutral
▸ RSI (●)
Green = Oversold (<30)
Red = Overbought (>70)
Gray = Neutral
▸ CVD (●)
Green = Cumulative buying pressure
Red = Cumulative selling pressure
▸ ΔCVD (●)
Green = Increasing buy pressure
Red = Increasing sell pressure
▸ Imbal (●)
Green = Buy imbalance (>2:1 ratio)
Red = Sell imbalance
▸ Vol (●)
Green/Yellow background = Volume surge (>2x average)
▸ Tape (●)
Green/Yellow background = Fast tape (>1.5x speed)
▸ Liq (↑↓●)
↑ = Bullish sweep or near sell-side liquidity
↓ = Bearish sweep or near buy-side liquidity
● = Neutral
▸ Score (#L or #S)
Quality score (0-8) for Long or Short setups
Higher numbers = Better quality trade
▸ SCALP (LONG/SHORT/WAIT)
Primary signal
Bright color = High quality (score ≥5)
Dim color = Decent quality (score =4)
Gray = Wait for better setup
🎨 Candle Color System
Volume-Based Colors
Bright Green/Red: Extreme volume (>2.5x average) - Major moves
Medium Green/Red: High volume (>1.5x average) - Strong activity
Dull Green/Red: Normal volume - Standard market activity
Gray: Low volume (<0.5x average) - Avoid trading
Signal-Based Colors
Lime: Strong Long signal (score ≥5)
Green: Decent Long signal (score =4)
Orange: Strong Short signal (score ≥5)
Red: Decent Short signal (score =4)
Candle Color Modes (adjustable in settings):
Volume Only: Pure volume intensity
Volume + Signals: Signals override volume when present (default)
Signals Only: Only shows entry signals
🔵 Chart Indicators
Support & Resistance Lines
Green Line: Volume-weighted support level
Red Line: Volume-weighted resistance level
Lines update dynamically based on 100-bar volume profile
Liquidity Zones
Cyan Circles/Dashed Lines: Buy-side liquidity (above price)
Where short stop losses cluster
Potential targets for bullish moves
Institutions may push price here before reversing down
Magenta Circles/Dashed Lines: Sell-side liquidity (below price)
Where long stop losses cluster
Potential targets for bearish moves
Institutions may push price here before reversing up
Entry Markers
Large Green Triangle (▲): High quality long entry (score ≥5)
Small Green Triangle (▲): Decent long entry (score =4)
Large Orange Triangle (▼): High quality short entry (score ≥5)
Small Red Triangle (▼): Decent short entry (score =4)
Liquidity Sweep Markers
Cyan X-Cross (below bar): Bullish liquidity sweep - "LIQ↑"
Price swept sell-side liquidity and reversed up
Strong buy signal
Magenta X-Cross (above bar): Bearish liquidity sweep - "LIQ↓"
Price swept buy-side liquidity and reversed down
Strong sell signal
🎯 How to Use This Indicator
For Long Scalps (Buy):
Wait for Dashboard Signal: SCALP = "LONG" with score ≥5
Confirm Multiple Green Dots: Look for EMA, CVD, ΔCVD, Imbal all green
Check Volume: Vol or Tape should show yellow background (surge)
Look for Confluence:
Price at or near Support level (green highlight)
Price near Sell-Side Liquidity (magenta line below)
RSI oversold (green dot)
Large green triangle appears on chart
Best Entry: On a bullish liquidity sweep (cyan X-cross)
For Short Scalps (Sell):
Wait for Dashboard Signal: SCALP = "SHORT" with score ≥5
Confirm Multiple Red Dots: Look for EMA, CVD, ΔCVD, Imbal all red
Check Volume: Vol or Tape should show yellow background (surge)
Look for Confluence:
Price at or near Resistance level (orange highlight)
Price near Buy-Side Liquidity (cyan line above)
RSI overbought (red dot)
Large orange triangle appears on chart
Best Entry: On a bearish liquidity sweep (magenta X-cross)
Three Types of Scalping Setups:
1. Quick Scalp (Fastest - 1-5 minute holds)
MACD or Stochastic crossover + Volume surge
At Support/Resistance level
Score ≥4
2. Momentum Scalp (Ride the wave - 5-15 minute holds)
Strong EMA alignment + CVD slope positive
Order flow imbalance + Fast tape
Volume surge with price structure
Score ≥5
3. Reversal Scalp (Fade extremes - 3-10 minute holds)
Stochastic + RSI extreme readings
At Support/Resistance OR liquidity sweep
CVD momentum reversal
Score ≥6
⚙️ Recommended Settings
Timeframes
Primary: 1-minute, 2-minute, 5-minute
Confirmation: Use 15-minute chart for overall trend direction
Asset Types
Forex pairs (high liquidity)
Crypto (BTC, ETH with high volume)
Futures (ES, NQ)
Major stocks during market hours
Risk Management
Target: 1-3 times your stop loss
Stop Loss: Below nearest liquidity zone for longs, above for shorts
Position Size: Never risk more than 1% per trade
Score ≥5: Take full position size
Score =4: Take half position size or skip
🔧 Customization Options
Input Groups
MACD Settings
Fast Length: 5 (scalping optimized)
Slow Length: 13
Signal Length: 5
EMA Settings
EMA 9, 20, 50 (fast scalping EMAs)
Stochastic Settings
%K Length: 5
%D Smoothing: 3
Smooth: 3
CVD Settings
MA Length: 10 (for CVD smoothing)
RSI Settings
Length: 7 (fast RSI)
Overbought: 70
Oversold: 30
Volume Settings
MA Length: 10
Extreme Multiplier: 2.5x
High Multiplier: 1.5x
Low Multiplier: 0.5x
Liquidity Zone Settings
Lookback Periods: 20
Swing Strength: 3
Show Liquidity Zones: On/Off
Show Liquidity Sweeps: On/Off
Support/Resistance Settings
Volume Lookback: 100 bars (~2 hours on 1-min chart)
Order Flow Settings
Imbalance Threshold: 2.0 (2:1 ratio)
Color Customization
All volume colors customizable
All signal colors customizable
All liquidity colors customizable
📊 Volume Legend (Top Right)
The small table in the top-right corner shows the volume intensity key:
Extreme: >2.5x average volume
High: >1.5x average volume
Normal: 0.5x to 1.5x average volume
Low: <0.5x average volume
🔔 Built-in Alerts
Set up these alerts to never miss a trade:
High Quality Long Scalp: Triggers when entry_long and score ≥5
High Quality Short Scalp: Triggers when entry_short and score ≥5
Bullish Liquidity Sweep: Triggers when sell-side liquidity is swept
Bearish Liquidity Sweep: Triggers when buy-side liquidity is swept
To set up: Right-click chart → Add Alert → Select condition → Create
💡 Pro Tips
Understanding Liquidity Zones
Buy-Side Liquidity = Where shorts have their stops = Price tends to wick up here
Sell-Side Liquidity = Where longs have their stops = Price tends to wick down here
Liquidity Sweep = Institution triggers stops, absorbs liquidity, then reverses
Best trades = Enter AFTER the sweep when price reverses back
Reading the Dashboard
All Green Dots + Yellow Volume = Strong Long Setup
All Red Dots + Yellow Volume = Strong Short Setup
Mixed Colors = Choppy/Neutral = Wait
Score 6+ = Highest probability trades
Score 3 or less = Avoid
Confluence is Key
Never trade on a single indicator. Wait for:
Dashboard score ≥5
Volume surge (yellow background)
At support/resistance OR liquidity zone
CVD and momentum aligned
Price structure confirmation (triangle marker)
Avoid These Situations
❌ Low volume periods (gray candles)
❌ Dashboard shows "WAIT"
❌ Score below 4
❌ No volume surge during entry
❌ Trading against higher timeframe trend
Best Trading Sessions
Forex: London open (3-5 AM EST), NY open (8-10 AM EST)
Crypto: Works 24/7, best during high volume periods
Stocks: First hour (9:30-10:30 AM EST), last hour (3-4 PM EST)
Futures: US session open (9:30 AM EST)
🎓 Understanding the Scoring System
The indicator calculates a quality score (0-8) for both long and short setups:
+1 point for each:
EMA bias aligned (price above/below EMA structure)
CVD momentum bias aligned (buying/selling pressure)
Buy/Sell pressure ratio aligned (>1.5x or <0.67x)
Volume strength (surge detected)
Order flow imbalance (>2:1 ratio)
Tape speed (>1.3x average)
Price structure (higher highs or lower lows)
Liquidity bias (sweep detected)
Score Interpretation:
7-8: Extremely high probability (rare, take immediately)
6: Very high probability (excellent trade)
5: High probability (good trade)
4: Decent probability (acceptable with tight stop)
3 or less: Low probability (wait for better setup)
📋 Quick Reference Card
Entry Checklist
Dashboard shows LONG or SHORT
Score is ≥5
Multiple indicators aligned (green or red dots)
Volume surge present (yellow background)
At support/resistance or liquidity zone
Triangle marker appeared on chart
Risk:Reward ratio is at least 1:2
Exit Strategy
Take Profit: At opposite liquidity zone or resistance/support
Stop Loss: Below sell-side liquidity (longs) or above buy-side liquidity (shorts)
Trail Stop: Move to breakeven after 1:1 risk:reward achieved
⚠️ Important Notes
This is NOT a holy grail: No indicator is 100% accurate. Always use proper risk management.
Backtest first: Paper trade or backtest on your specific instrument before using real money.
Market conditions matter: This indicator works best in trending or volatile markets, not in tight consolidation.
Combine with price action: Use the indicator as confluence with your own price action reading.
Adjust for your instrument: Different assets may require tweaking the sensitivity settings.
Lower timeframes = More noise: 1-minute charts have more false signals than 5-minute charts.
🔄 Version History
v1.0 - Initial release
Multi-indicator dashboard
Volume-based candle coloring
Support/Resistance detection
Entry signal generation
v2.0 - Current version
Added liquidity zone detection
Added liquidity sweep identification
Enhanced scoring system (now 0-8)
Added liquidity bias to entries
New alerts for liquidity sweeps
Improved dashboard with Liq indicator
📞 Support & Feedback
If you find this indicator helpful, please:
⭐ Give it a boost
💬 Share your results in the comments
🐛 Report any bugs or issues
💡 Suggest improvements
Disclaimer: This indicator is for educational purposes only. Trading involves significant risk. Past performance does not guarantee future results. Always trade responsibly and never risk more than you can afford to lose.
🏆 Credits
Created for serious scalpers who want institutional-level insights on retail charts. Combines order flow analysis, volume profiling, and liquidity mapping into one comprehensive tool.
Happy Scalping! 🚀📈
VWAP Wave System ToolkitGENERAL OVERVIEW:
The VWAP Wave System Toolkit is an all-in-one trading indicator based on rules from Auction Market Theory. The indicator is built around Volume-Weighted Average Prices (VWAP), Initial Balance (IB) levels, session/composite volume profiles, low-volume zones, optional candle coloring, trade checklists, dashboard readings, and a watermark.
This indicator was developed by Flux Charts in collaboration with Chris Drysdale (Trader Drysdale), author of the best-selling book VWAP Wave System.
What’s the purpose of this indicator?
The VWAP Wave System Toolkit helps traders see where market value is forming, shifting, or being rejected across different timeframes. It’s built on the ideas of Auction Market Theory, which views the market as a continuous auction between buyers and sellers searching for fair value. The indicator combines VWAPs, Initial Balance levels, and volume profiles into one system that shows how price interacts with value throughout the day, week, and month. By combining short-term and higher-timeframe data, it helps traders understand when the market is balanced and when it’s starting to discover new price areas.
What’s the theory behind this indicator?
This indicator is built on Auction Market Theory, introduced by J. Peter Steidlmayer. The theory says that markets operate as continuous auctions, constantly seeking a fair price where buyers and sellers agree on value. When price stays within a narrow range and volume builds up, the market is balanced around a value area. When price moves away from that area, the market enters price discovery, searching for a new zone of balance. VWAPs represent an evolving measure of value, while Volume Profiles and Initial Balance visualize how the auction developed during each session. Low Volume Zones often show where the market moved too quickly to trade efficiently, making them potential areas of interest for future reactions. By combining these elements, the indicator provides a picture of how the market is auctioning and where value may shift next.
VWAP WAVE SYSTEM TOOLKIT FEATURES:
The VWAP Wave System Toolkit indicator includes 7 main features:
Initial Balance Levels
Multi-Timeframe VWAPs
Session Volume Profile
Composite Volume Profile
Low Volume Zones
Checklist
Watermark
Initial Balance Levels:
🔹What is the Initial Balance?
The Initial Balance (IB) is defined by the high and low prices that form within a specific time window. Typically, this time window is the first hour after the regular day trading session starts (09:30 - 10:30 AM EST).
The high and low formed during this window create the foundation for the day’s price structure. From these two points, the indicator automatically calculates several key reference levels that show how far price has extended beyond the initial range or where it may still be balanced. Understanding how these levels are derived and how to interpret them is essential to using the Initial Balance effectively.
🔹How Initial Balance Levels are calculated:
Once the IB window closes, the indicator plots a full set of reference levels derived from the IB range. These levels are:
IB High
IB Low
IB Midpoint
x2 High / x2 Low
x2 Midpoints (x1.5 High/Low)
x3 High / x3 Low
x3 Midpoints (x2.5 High/Low)
🔹IB High & IB Low
The IB High is the highest price reached during the IB session window, and the IB Low is the lowest price reached.
🔹IB Midpoint
The IB Midpoint is the average of the IB High and IB Low.
🔹x2 High & x2 Low
The x2 levels are calculated by projecting one full IB Range above and below the Initial Balance. The IB Range is the distance between the IB High and IB Low.
🔹x2 High Midpoint & x2 Low Midpoint
The x2 High Midpoint (x1.5 High) is the average of the IB High and x2 High. The x2 Low Midpoint (x1.5 Low) is the average of the IB Low and x2 Low.
🔹x3 High & x3 Low
The x3 High/Low levels are calculated by projecting two full IB Range above and below the Initial Balance.
🔹x3 High Midpoint & x3 Low Midpoint
The x3 High Midpoint (x2.5 High) is the average of the x2 High and x3 High. The x3 Low Midpoint (x2.5 Low) is the average of the x2 Low and x3 Low.
🔹Breaks & Retests:
For every Initial Balance level, the indicator automatically tracks when price retests or breaks through them.
A Break occurs when a candle closes above or below an IB level. When this happens, the indicator plots a small blue triangle.
A Retest occurs when price approaches and touches an IB Level, and then reverses in the opposite direction. When this happens, the indicator plots a small green or red triangle.
Green Triangle: Bullish Retest - Price comes down to a level, touches it, and continues up.
Red Triangle: Bearish Retest - Price comes up to a level, touches it, and continues down.
Both breaks and retests are plotted directly on the chart for every toggled IB level. Once detected, they remain fixed and are not repainted.
Other Settings:
🔹Shade IB Range
When enabled, this setting fills the area between the IB High and IB Low (IB Range). The fill helps visually separate the Initial Balance range from the rest of the session, making it easier to identify when price is trading inside or outside of the IB. The color and opacity can also be adjusted through the settings.
🔹Apply One Color
When this setting is enabled, all toggled IB levels use the same color instead of the user’s inputted colors.
🔹Levels Labels
When enabled, text labels that identify each IB level (for example, “IB High,” “x2 High,” or “x2.5 Low”) appear next to each level.
🔹Price Labels
When enabled, the indicator displays the real-time price value of each IB level directly on the chart. These labels update automatically as price changes or when the levels shift due to recalculation from a new session.
🔹Extend Levels Right
When enabled, all toggled IB Levels will be extended infinitely to the right of the chart.
🔹Align Text Right
This setting aligns all level and price labels to the right edge of the plotted line. When disabled, text labels will be aligned to the left edge of each level.
Multi-Timeframe VWAPs:
🔹Why does this indicator include VWAPs?
This indicator includes VWAPs because they show where the most trading activity has occurred within each timeframe, helping identify the market’s fair value area. According to Auction Market Theory, price moves between periods of balance and imbalance as buyers and sellers seek fair value. VWAPs represent those balance points where the majority of trading has taken place. By plotting the Intraday, Weekly, and Monthly VWAPs, the indicator shows how value shifts across different timeframes and whether the market is balanced or moving toward a new area of value.
🔹Intraday VWAP
The Intraday VWAP measures the average traded price for the current trading session and resets each day at market open. It shows where most of the session’s trading has taken place, acting as a real-time fair value line. When price trades near the Intraday VWAP, the market is considered balanced. When price moves far above or below it, the market is exploring new value areas.
🔹Candle Coloring:
The Intraday VWAP candle coloring highlights how far price is trading from the session’s average value using the first and second standard deviation bands as visual reference zones. This feature helps users see whether price is balanced around fair value or expanding into an overextended area.
When candle coloring is enabled, each candle’s color changes based on where it closes relative to the two standard deviation bands surrounding the Intraday VWAP. The first band represents one standard deviation (1.0 STD) and the second represents one and a half standard deviations (1.5 STD).
If a candle closes above the upper 1.5 standard deviation band, it is colored a brighter green, showing strong movement above fair value. Candles closing between the upper 1.0 and 1.5 standard deviation bands are a lighter green, showing moderate strength. If a candle closes below the lower 1.5 standard deviation band, it is colored a brighter red, showing strong movement below fair value. Candles closing between the lower 1.0 and 1.5 standard deviation bands are a lighter red, showing moderate weakness. Candles that close within the ±1.0 standard deviation range remain their normal color, showing that price is balanced near the session’s average.
Both the VWAP line and its bands can be customized in the Intraday VWAP settings. Users can adjust the VWAP line color, band colors, and fill transparency. The candle colors can also be modified. The band sizes (1.0 STD and 1.5 STD by default) can be changed through their input multipliers, allowing users to control the sensitivity of the zones.
Please Note: This candle coloring applies only to the Intraday VWAP
🔹Weekly VWAP
The Weekly VWAP measures the average traded price across the current trading week and resets at the start of each new week. It reflects the fair value area that has developed over multiple trading days, providing a broader view of market balance compared to the Intraday VWAP. When price stays close to the Weekly VWAP, it indicates that the week’s trading activity is balanced. When price consistently trades above or below it, the market is moving away from that balance and forming value in a new area.
Standard Deviation Bands:
The Weekly VWAP includes optional standard deviation bands. Users can toggle 1x and 1.5x STD bands. Users can also adjust the multipliers.
Customization:
All colors for the Weekly VWAP and its standard deviation bands can be changed in the indicator’s settings. Users can adjust the VWAP line color, band colors, and fill transparency.
🔹Monthly VWAP
The Monthly VWAP measures the average traded price for the current month and resets on the first trading day of each new month. It provides the broadest view of value within this indicator, showing where the majority of trading has occurred during the current month. When price remains near the Monthly VWAP, it reflects long-term balance.
Standard Deviation Bands:
The Monthly VWAP includes optional 1x and 1.5x standard deviation bands that can be enabled or disabled. In the settings, users can adjust the standard deviation multipliers.
Customization:
The Monthly VWAP line, band colors, and fill transparency can all be modified in the indicator’s settings.
🔹VWAP Dashboard
The VWAP Dashboard provides a quick real-time overview of how price is positioned relative to the Intraday, Weekly, and Monthly VWAPs. It is displayed directly on the chart and updates automatically with each new candle.
The dashboard is divided into five labeled sections:
Intraday
Weekly
Monthly
Weekly STD
Monthly STD
Intraday, Weekly, and Monthly Sections:
These three sections show whether price is currently trading Above or Below each VWAP.
If price is above a VWAP, that section displays “Bullish”
If price is below a VWAP, that section displays “Bearish”
Weekly STD and Monthly STD:
These sections display whether price is currently inside or outside the standard deviation bands of the Weekly and Monthly VWAPs.
When price is trading within the ±1.0 standard deviation zone, the dashboard output is “Balanced Market”
When price is above the upper standard deviation, price is extending up beyond the week’s or month’s fair value, and the dashboard output is “Bullish Price Discovery”
When price is below the lower standard deviation, price is extending down beyond the week’s or month’s fair value, and the dashboard output is “Bearish Price Discovery”
🔹What is a Balanced Market
A balanced market occurs when price is trading within the ±1.0 standard deviation range of a VWAP. This shows that buyers and sellers are in general agreement on value, and trading activity is taking place around the fair value area. In this state, price tends to rotate around the VWAP rather than trend strongly away from it. Balance reflects stability in the auction process, where neither side is dominant and value is being built at current prices.
🔹What is Bullish Price Discovery
Bullish Price Discovery occurs when price trades above the upper standard deviation of a VWAP. This indicates that buyers are accepting higher prices and that value may be shifting upward. In terms of Auction Market Theory, the market is moving away from balance as it searches for a new fair value area above the prior range.
🔹What is Bearish Price Discovery
Bearish Price Discovery occurs when price trades below the lower standard deviation of a VWAP. This shows that sellers are accepting lower prices and that value may be developing beneath the prior area of balance. The market is moving out of equilibrium as participants test lower prices to find new fair value.
Session Volume Profile:
🔹Why this feature is included:
The Session Volume Profile is included to show where trading activity occurred within each session. It visually represents the volume traded at each price, helping to identify where market participants considered value to be. This ties directly to Auction Market Theory, which views markets as auctions seeking balance between buyers and sellers. The profile highlights those balance areas and shows where volume thins out, helping distinguish between value areas and areas of rejection.
🔹How is the Session Volume Profile calculated and displayed:
At the start of each selected session window, the indicator creates a new volume profile and tracks every bar in that session. For each candle, it saves the high, low, open, close, volume, and time. When the HD (High Definition) setting is enabled, and your chart is between the 1-minute and 30-minute timeframes (recommended), the indicator requests lower-timeframe data and feeds the profile with 1-minute candlesticks for more detail. The running session high and low define the vertical bounds of the volume profile. That span is split into a fixed number of rows. Each row represents a price slice. For every bar and every price row, the indicator checks whether the bar’s high-low range touches that row. If it does, it adds part of the bar’s volume to that row. The allocation uses a step-to-bar-size ratio, so that narrow bars do not overload a tall row and tall bars contribute proportionally across all rows they cross. If the bar closes above its open, that row’s “up” volume bucket is incremented. If it closes below its open, the “down” bucket is incremented. After all bars are processed, the row with the highest total becomes the Point of Control (POC). Starting from that row, the indicator expands upward and downward, adding adjacent rows until the cumulative total reaches your Value Area percentage. The upper boundary is Value Area High (VAH), and the lower boundary is Value Area Low (VAL).
For rendering, each price row becomes a horizontal box drawn from the session start time to a length proportional to that row’s volume versus the session’s maximum row volume. If you choose “Up / Down” volume, the row is split into two adjoining boxes that show the up and down portions. If you choose “Total,” a single box is drawn to the total length. If you choose “Delta,” the length reflects the absolute difference between up and down. The POC is drawn as a line across the row midpoint. VAH and VAL are drawn at the exact prices of the top and bottom value rows. While a session is open the profile keeps updating as new bars form. When the session ends, the script fixes its start and end and stops changing that profile. To avoid any issues with drawing limits, the indicator only renders the two most recent session volume profiles.
Settings:
🔹Enabled
Turns the Session Volume Profile on or off. When disabled, no session profiles, lines, or volume boxes are displayed.
🔹HD
Stands for High Definition. When enabled, the indicator requests data from the 1-minute timeframe to build a smoother, more detailed volume profile. This produces finer row distribution and more accurate POC, VAH, and VAL positioning, especially on higher chart timeframes.
🔹POC Line
Toggles the visibility of the Point of Control line. The POC represents the price level with the highest traded volume in the session. It’s drawn horizontally across the chart at that price, and its color can be customized in settings.
🔹VAH
Controls the display of the Value Area High line. The VAH is the top boundary of the range that contains the specified percentage of total traded volume (default 70%). It marks where volume starts to thin out above fair value. Users can turn it on or off and customize its color.
🔹VAL
Controls the display of the Value Area Low line. The VAL is the lower boundary of the value area and marks where volume thins out below fair value. Its visibility and color can also be customized.
🔹Session
This setting allows users to define the start and end time of the trading session used to calculate the session volume profile. Only bars within this time window are included in the volume profile. When a session ends, the volume profile locks, and a new one begins automatically when the next session begins based on the user’s input.
🔹Volume
Controls how the histogram rows are displayed:
Up/Down: Splits each price row into two parts: one for bullish candles (Up volume) and one for bearish candles (Down volume). This helps visualize buying versus selling pressure at each price.
Total: Combines both Up and Down volume into a single-colored bar for each price level. Since direction isn’t separated, this view focuses purely on where trading activity was concentrated, regardless of which side was in control. A tall bar means strong participation and interest at that price.
Delta: Displays the difference between up and down volume (Up/Down) for each row, highlighting which side controlled that price area.
🔹Value Area Volume
The Value Area Volume setting defines how much of the total session volume is considered the “value area.” By default, it’s 70%, meaning the indicator finds the price range where 70% of all trading took place during that session. This area is where buyers and sellers agreed the most on price, also known as the fair value zone.
If you increase the percentage (for example, to 80%), the value area becomes wider and includes more of the session’s trading range. Lowering it (for example, to 60%) makes it narrower, focusing only on the prices with the heaviest activity.
🔹Row Size
The Row Size controls how detailed the volume profile looks. It decides how many price levels (rows) the profile is divided into. Smaller values make the profile smoother and easier to read but less precise. Larger values add more detail and show exactly where volume clustered, but they can make the profile look denser.
The maximum value is 450 rows, and the minimum value is 5 rows. Higher values (especially above 200) can make the volume profile appear more detailed but may also cause performance issues or partial rendering on TradingView charts due to the platform’s drawing object limits. For most users, values between 50–150 give a good balance between clarity and performance.
25 Rows vs. 200 Rows:
Composite Volume Profile:
The Composite Volume Profile shows how volume is distributed across a larger selected range instead of just one session. It helps traders see where the most trading activity has taken place over multiple days. This gives a picture of long-term balance areas and important price zones that have repeatedly attracted buyers and sellers.
The Composite Profile uses the same base logic and visual settings as the Session Volume Profile, including POC Line, VAH, VAL, Volume Type, Value Area Volume, Row Size, and Colors. Any customization applied to those settings also affects the Composite Profile, ensuring a consistent appearance across both features.
🔹Session Count Setting:
This setting controls how many past sessions are merged into one composite volume profile. For example, if the Session Count is set to 5, and each session represents one trading day, the profile combines data from the last 5 trading days. A “session” refers to the time window defined in the Session Volume Profile settings.
🔹How is the Composite Volume Profile used?
In Auction Market Theory, markets move through phases of balance and imbalance as traders agree on value before moving to explore new ones. The Composite Volume Profile shows where that long-term balance has formed. Large, wide areas on the profile indicate zones where multiple sessions agreed on value. Thin areas show prices that were quickly rejected, where less time and volume were traded. Combining short-term session profiles into a composite helps identify when the market is holding near established value or entering new price discovery, confirming transitions between balance and price discovery.
Low Volume Zones:
🔹What are Low Volume Zones?
Low Volume Zones (LVZs) are price areas where trading activity was minimal compared to surrounding levels. On a volume profile, they appear as thin “valleys” between two high-volume “peaks.” These valleys show where the market moved too quickly for significant two-way trade to occur. In Auction Market Theory, they represent inefficient areas, meaning the market didn’t find fair value, so price either skipped through or rejected those levels.
🔹How are Low Volume Zones found?
The indicator identifies Low Volume Zones (LVZs) directly from Session Volume Profiles (SVPs) by analyzing the shape of its volume distribution. Each SVP is built from a series of horizontal rows, where each row represents the total traded volume within a narrow price range. The longer the row, the higher the trading activity at that price.
The indicator first locates the two largest high-volume peaks on the profile. These peaks represent the strongest areas of market activity. Once these two main peaks are found, the indicator looks on both sides of each peak for the lowest-volume row in the surrounding area. Those small-volume dips define the boundaries of the Low Volume Zones.
Each high-volume peak can therefore generate two LVZs (one above and one below it), resulting in a maximum of four Low Volume Zones per volume profile. If two LVZs overlap or share the same price range, they are automatically merged into a single larger zone, which may reduce the total count to three or fewer.
🔹How are Low Volume Zones used?
Low Volume Zones (LVZs) mark areas where the market previously traded with little participation. In Auction Market Theory, these zones represent inefficient price areas where buyers and sellers failed to agree on value. When price returns to an LVZ, it may act as an area where price tends to react differently due to lower previous trading activity. If the market still sees that area as unfair, price will reject it and reverse quickly. If the market now accepts that price level, volume builds and price moves through it smoothly as the auction seeks new balance. Traders use LVZs to identify where price may react sharply or move quickly through thin areas. When price approaches a zone from above or below, it signals potential rejection or continuation.
🔹LVZ Breaks and Retests
The indicator automatically tracks how price interacts with every detected LVZ.
A Break occurs when price fully moves through the entire LVZ and closes past it. When this happens, the indicator plots a small blue triangle.
A Retest occurs when price touches an LVZ and reverses away, showing rejection. When price comes down to a level, taps it, and continues up, it’s considered a bullish retest, and a small green triangle is plotted. When price comes up to a level, taps it, and continues down, it’s considered a bearish retest, and a small red triangle is plotted.
🔹LVZ Settings
Enabled:
Toggles LVZ detection and visualization on or off.
Realtime:
Allows LVZs to form dynamically as the current session develops, updating live as volume builds or thins out. When disabled, zones only appear once the session closes.
Please note: When this setting is enabled, zones may update or shift while the current session is still forming. Because the Session Volume Profile is continuously recalculating with new data, both the volume distribution and detected zones can change until the session closes.
Row Pivot Length:
Controls how far above and below each price row the indicator looks when identifying the highest and lowest volume points that define each Low Volume Zone. Larger values make the indicator compare a wider range of rows, while smaller values keep the analysis closer to each row’s immediate area.
Last SVPs:
Defines how many recent Session Volume Profiles are used for LVZs. For example, setting it to 3 limits LVZ detection to the last three sessions only.
Retests and Breaks:
Enables or disables the display of the retest and break markers described above.
Checklist:
The Checklist is a manual on-chart dashboard that allows traders to keep track of specific market conditions before entering a trade. Each checklist item can be toggled on or off in the indicator’s settings. When enabled, a checkmark emoji appears next to that item on the dashboard. When disabled, an X emoji appears next to that item.
This feature is designed to help traders visually confirm important steps in their process, such as reviewing trend direction, VWAP alignment, or session context. The checklist can also be repositioned anywhere on the chart using the “Location” setting for better visibility and layout preference.
Watermark:
The Watermark feature displays key chart information directly in the background, including the current ticker symbol, selected timeframe, and date. The watermark’s size, color, and transparency can be adjusted in the settings.
UNIQUENESS:
The VWAP Wave System Toolkit is unique because it brings every part of Auction Market Theory to the chart. It shows how value builds and shifts by combining Initial Balance levels, multi-timeframe VWAPs, and volume profiles. The indicator automatically marks low-volume zones where the market moved too quickly, highlights breaks and retests, and tracks how price interacts with fair value across sessions, weeks, and months. Every feature works together to give a simple view of balance, imbalance, and value development as the auction unfolds.

Fair Value Gap Pro by Bifrost InstituteFair Value Gap Pro brings institutional-style FVGs to TradingView with the precision and controls traders actually need. It detects clean 3-candle gaps on any higher timeframe, projects them onto your active chart, and overlays precise buy/sell volume ratios so you can judge the quality of a gap at a glance. Everything is customizable—from colors and line styles to tag markers, and volume display—so the tool adapts to your workflow instead of the other way around.
🔭 Multi-Timeframe Engine
Higher Timeframe Detection: Choose any HTF (M5, H1, H4, D1, etc.) and view those gaps on any lower-TF chart
Smart Gap Detection: Strict 3-candle mode ensures only successive bars form gaps—automatically rejects weekend gaps and market closures
Configurable History: Scan back 1-500+ bars with intelligent processing
Extend Until Filled: Gaps dynamically extend forward until price fills them, or use fixed-width mode
Advanced Fill Logic: Fill Rules - Close only, wick only, or close/wick; Fill Depth: TouchAny (immediate edge touch) or TouchMid (requires 50% penetration)
TouchMid Margin: Fine-tune difficulty with -50% to +50% adjustment (e.g., -10% = easier fill at 40% depth)
Weekend Gap Protection: Prevents false fills from market gaps—only real price action counts
📊 HTF-Accurate Volumetrics
True HTF Volume: Uses higher timeframe bar data for accurate volume matching across all chart timeframes
Buy vs Sell Delta: Integrated volume analysis for every FVG shows institutional pressure
Display Formats: Decimal ratios, percentages, or raw values (with K/M/B suffixes)
Volume Modes: Bar Delta (fast & reliable, recommended), Tick Delta (optional, feed-dependent)
Clear "+" (buy) and "–" (sell) prefixes for instant reading
🎨 Fully Customizable Appearance
Color Control: Color pickers for Bullish/Bearish FVG fills & Filled state colors (different from active), Band lines, midlines, and text labels.
Formation and fill tag markers
Line Styling: Color & Width
🔔 Alerts
Toggle formation/fill alerts independently
🏷 Tags
Visual Tags: Show markers - Text / Icon per event type
Icon choices: Circle, Square, Diamond, Star, Up/Down Arrow
Independent colors for formation vs fill tags
Auto-remove "formed" tag when "filled" tag appears
Configurable size and positioning
🧩 Rendering & Fill Display
Triple-Band Display: Upper, mid, and lower boundary lines with configurable styles
Filled Rectangle: Semi-transparent fill between boundaries for clear visualization
Fill State Management: Hide filled gaps completely, or keep them visible with distinct "filled" colors.
"Use Filled Colours" option for easy state identification
Quality Filters: Minimum body size filter (in chart points) to exclude noise from low-volatility periods
⚙️ Quality-of-Life Features
Performance Optimized: Efficient HTF/LTF time mapping with binary search algorithms
Cross-Symbol Compatible: Robust handling across all symbols and data feeds
Sensible Defaults: Works beautifully out of the box—tweak only what you need
Minimal Chart Clutter: Designed to keep critical information visible without overwhelming your workspace
💡 Perfect For
Institutional gap traders who need precision and control
Multi-timeframe analysts requiring HTF context on LTF charts
Volume profile traders seeking buy/sell pressure confirmation
Traders who value clean, professional chart aesthetics
Anyone tired of indicators that force rigid workflows
Fair Value Gap Pro doesn't just show you gaps—it gives you the complete institutional picture with the flexibility to trade your way.

Order-Flow Proxy (VWAP Deviation Zones)Order-Flow Proxy (VWAP Deviation Zones) helps traders visualize when market price moves unusually far away from its Volume-Weighted Average Price (VWAP) — a key fair-value level used by institutional participants.
When price stretches too far above or below VWAP, it often signals temporary imbalance between buying and selling pressure.
This tool highlights those moments using simple color zones and an optional statistical Z-Score filter for deeper precision.
In short: it’s a clean, minimal mean-reversion indicator showing when price is statistically “too far” from fair value.
Red zone → Price extended above VWAP → possible buyer exhaustion or short setup.
Green zone → Price extended below VWAP → possible seller exhaustion or long setup.
VWAP line → Acts as a dynamic fair-value anchor.
Concept:
VWAP combines both price and traded volume to define where most transactions occurred.
Deviations from it — measured either by a fixed distance (1%) or by Z-Score — can reveal overvaluation or undervaluation zones used by professional traders for contrarian setups.
How to use:
Apply the indicator to any intraday chart (1m–1h recommended).
Watch for background color shifts — red or green.
Optionally enable the Z-Score filter to focus only on statistically extreme deviations.
Combine with volume spikes, liquidity sweeps, or your own order-flow tools for confirmation.
Tip:
Best used as a visual overlay for detecting stretched markets and potential reversals.

Volume composition / quantifytools (Kevin mod)Just needed some custom configs -- ALL credit goes to: quantifytools, the OG author and goat. cheers!

Holographic Market Microstructure | AlphaNattHolographic Market Microstructure | AlphaNatt
A multidimensional, holographically-rendered framework designed to expose the invisible forces shaping every candle — liquidity voids, smart money footprints, order flow imbalances, and structural evolution — in real time.
---
📘 Overview
The Holographic Market Microstructure (HMS) is not a traditional indicator. It’s a visual architecture built to interpret the true anatomy of the market — a living data structure that fuses price, volume, and liquidity into one coherent holographic layer.
Instead of reacting to candles, HMS visualizes the market’s underlying micro-dynamics : where liquidity hides, where volume flows, and how structure morphs as smart money accumulates or distributes.
Designed for system-based traders, volume analysts, and liquidity theorists who demand to see the unseen — the invisible grid driving every price movement.
---
🔬 Core Analytical Modules
Microstructure Analysis
Deconstructs each bar’s internal composition to identify imbalance between aggressive buying and selling. Using a configurable Imbalance Ratio and Liquidity Threshold , the algorithm marks low-liquidity zones and price inefficiencies as “liquidity voids.”
• Detects hidden supply/demand gaps.
• Quantifies micro-level absorption and exhaustion.
• Reveals flow compression and expansion phases.
Smart Money Tracking
Applies advanced volume-rate-of-change and price momentum relationships to map institutional activity.
• Accumulation Zones – Where price rises on expanding volume.
• Distribution Zones – Where price declines on rising volume.
• Automatically visualized as glowing boxes, layered through time to simulate footprint persistence.
Fractal Structure Mapping
Reveals the recursive nature of price formation. HMS detects fractal highs/lows, then connects them into an evolving structure.
• Defines nested market structure across multiple scales.
• Maps trend progression and transition points.
• Renders with adaptive glow lines to reflect depth and strength.
Volume Heat Map
Transforms historical volume data into a 3D holographic heat projection.
• Each band represents a volume-weighted price level.
• Gradient brightness = relative participation intensity.
• Helps identify volume nodes, voids, and liquidity corridors.
HUD Display System
Real-time analytical dashboard summarizing the system’s internal metrics directly on the chart.
• Flow, Structure, Smart$, Liquidity, and Divergence — all live.
• Designed for both scalpers and swing traders to assess micro-context instantly.
---
🧠 Smart Money Intelligence Layer
The Smart Money Index dynamically evaluates the harmony (or conflict) between price momentum and volume acceleration. When institutions accumulate or distribute discreetly, volume surges ahead of price. HMS detects this divergence and overlays it as glowing smart money zones.
◈ ACCUM → Institutional absorption, early uptrend formation.
◈ DISTRIB → Distribution and top-heavy conditions.
○ IDLE → Neutral flow equilibrium.
Divergences between price and volume are signaled using holographic alerts ( ⚠ ALERT ) to highlight exhaustion or trap conditions — often precursors to structural reversals.
---
🌀 Fractal Market Structure Engine
The fractal subsystem recursively identifies local pivot symmetry, connecting micro-structural highs and lows into a holographic skeleton.
• Bullish Structure — Higher highs & higher lows align (▲ BULLISH).
• Bearish Structure — Lower highs & lower lows dominate (▼ BEARISH).
• Ranging — Fractal symmetry balance (◆ RANGING).
Each transition is visually represented through adaptive glow intensity, producing a living contour of market evolution .
---
🔥 Volume Heat Map Projection
The heatmap acts as a volumetric X-ray of the recent 100–300 bars. Each horizontal segment reflects liquidity density, rendered with gradient opacity from cold (inactive) to hot (highly active).
• Detects hidden accumulation shelves and distribution ridges.
• Identifies imbalanced liquidity corridors (voids).
• Reveals the invisible scaffolding of the order book.
When combined with smart money zones and structure lines, it creates a multi-layered holographic perspective — allowing traders to see liquidity clusters and their interaction with evolving structure in real time.
---
💎 Holographic Visual Engine
Every element of HMS is dynamically color-mapped to its visual theme . Each theme carries a distinct personality:
Aeon — Neon blue plasma aesthetic; futuristic and fluid.
Cyber — High-contrast digital energy; circuit-like clarity.
Quantum — Deep space gradients; reflective of non-linear flow.
Neural — Organic transitions; biological intelligence simulation.
Plasma — Vapor-bright gradients; high-energy reactive feedback.
Crystal — Minimalist, transparent geometry; pristine data visibility.
Optional Glow Effects and Pulse Animations create a living hologram that responds to real-time market conditions.
---
🧭 HUD Analytics Table
A live data matrix placed anywhere on-screen (top, middle, or side). It summarizes five critical systems:
Flow: Order flow bias — ▲ BUYING / ▼ SELLING / ◆ NEUTRAL.
Struct: Microstructure direction — ▲ BULLISH / ▼ BEARISH / ◆ RANGING.
Smart$: Institutional behavior — ◈ ACCUM / ◈ DISTRIB / ○ IDLE.
Liquid: Market efficiency — ⚡ VOID / ● NORMAL.
Diverg: Price/Volume correlation — ⚠ ALERT / ✓ CLEAR.
Each metric’s color dynamically adjusts according to live readings, effectively serving as a neural HUD layer for rapid interpretation.
---
🚨 Alert Conditions
Stay informed in real time with built-in alerts that trigger under specific structural or liquidity conditions.
Liquidity Void Detected — Market inefficiency or thin volume region identified.
Strong Order Flow Detected — Aggressive buying or selling momentum shift.
Smart Money Activity — Institutional accumulation or distribution underway.
Price/Volume Divergence — Volume fails to confirm price trend.
Market Structure Shift — Fractal structure flips directional bias.
---
⚙️ Customization Parameters
Adjustable Microstructure Depth (20–200 bars).
Configurable Imbalance Ratio and Liquidity Threshold .
Adaptive Smart Money Sensitivity via Accumulation Threshold (%).
Multiple Fractal Depth Layers for precise structural analysis.
Scalable Heatmap Resolution (5–20 levels) and opacity control.
Selectable HUD Position to suit personal layout preferences.
Each parameter adjusts the balance between visual clarity and data density , ensuring optimal performance across intraday and macro timeframes alike.
---
🧩 Trading Application
Identify early signs of institutional activity before breakouts.
Track structure transitions with fractal precision.
Locate hidden liquidity voids and high-value areas.
Confirm strength of trends using order-flow bias.
Detect volume-based divergences that often precede reversals.
HMS is designed not just for observation — but for contextual understanding . Its purpose is to help traders anchor strategies in liquidity and flow dynamics rather than surface-level price action.
---
🪞 Philosophy
Markets are holographic. Each candle contains a reflection of every other candle — a fractal within a fractal, a structure within a structure. The HMS is built to reveal that reflection, allowing traders to see through the market’s multidimensional fabric.
---
Developed by: AlphaNatt
Version: v6
Category: Market Microstructure | Volume Intelligence
Framework: PineScript v6 | Holographic Visualization System
Not financial advice

RED-E Gamma Range DetectorRED-E Gamma Range Detector
Overview
The RED-E Gamma Range Detector identifies key support and resistance zones based on recent price action and volume distribution, combined with a simple momentum ribbon to help traders visualize trend direction. It's designed to highlight potential areas where price may react, inspired by the concept of gamma exposure levels in options trading.
How It Works
1. Support & Resistance Zones (Green & Red Boxes)
RED-E analyzes the recent price range over a customizable lookback period
It identifies high-probability support levels (green boxes) below current price
It identifies high-probability resistance levels (red boxes) above current price
These zones represent areas where price has historically shown increased activity
2. Gamma Flip Level (Yellow Dashed Line)
The yellow line represents the approximate "gamma flip" - the midpoint of the recent range
Above this line: Price tends to be more stable with range-bound behavior
Below this line: Price tends to be more volatile with trending behavior
This level acts as a key pivot point for market structure
3. Momentum Ribbon (Green/Red Fill)
A simple visual indicator using 9 and 21 period EMAs
Green ribbon: 9 EMA is above 21 EMA (bullish momentum)
Red ribbon: 9 EMA is below 21 EMA (bearish momentum)
Ribbon width shows strength of trend (wider = stronger trend)
How to Use
For Range Trading:
Look for buy signals near green support zones when above gamma flip
Look for sell signals near red resistance zones when above gamma flip
Price tends to bounce between zones in stable conditions
For Trend Trading:
Watch for breakouts above resistance or below support zones
Use the momentum ribbon to confirm trend direction
Wider ribbon gaps indicate stronger directional moves
For Risk Management:
Use support/resistance zones for stop-loss placement
Recognize increased volatility potential below the gamma flip
Adjust position sizing based on your proximity to key zones
Settings
Lookback Period: Number of bars to analyze (default: 20)
Lower values = more responsive to recent price action
Higher values = more stable, longer-term levels
Best Practices
Works best on liquid instruments (major stocks, indices, forex pairs)
Combine with other technical analysis tools for confirmation
Most effective on 1H, 4H, and daily timeframes
Always use proper risk management and stop losses
Why "RED-E"?
RED-E stands for being Ready to identify critical gamma levels, support/resistance zones, and momentum shifts - keeping you prepared for market moves before they happen.
Educational Note
This indicator approximates gamma exposure concepts using price and volume analysis. It does not use actual options data. The term "gamma" refers to the rate of change in options delta and how market makers hedge their positions, which can create support/resistance at certain price levels.
Disclaimer
This indicator is for educational and informational purposes only. It does not guarantee profitable trades. Past performance is not indicative of future results. Always conduct your own analysis and manage risk appropriately. Trading involves substantial risk of loss.
Recommended Categories
Primary Category:
✅ Support and Resistance
Secondary Categories:
✅ Momentum
✅ Trend Analysis
✅ Volatility

Daily ATR SL/TP Labels on ChartATR-Based Stop Loss & Take Profit Calculator
This script calculates 20% of the Average True Range (ATR) to determine optimal Stop Loss and Take Profit levels. Designed to assist traders in setting precise risk parameters when placing Buy/Sell orders based on daily market volatility.
Key Features:
Computes 20% of ATR value for proportional risk management
Provides dynamic SL/TP levels aligned to current market conditions
Optimised for Daily timeframe analysis to capture full trading day range
Recommended Usage:
Apply on Daily (1D) timeframe for most accurate results, as this captures the complete intraday price movement and provides reliable volatility measurements for position sizing and risk management decisions.

Volume HeatMap Divergence [BigBeluga]🔵 OVERVIEW
The Volume HeatMap Divergence is a smart volume visualization tool that overlays normalized volume data directly on the chart. Using a color heatmap from aqua to red, it transforms raw volume into an intuitive scale — highlighting areas of weak to intense market participation. Additionally, it detects volume-based divergences from price to signal potential reversals or exhaustion zones. Combined with clear visual labeling, this tool empowers traders with actionable volume insights.
🔵 CONCEPTS
Normalized Volume Heatmap : Volume is normalized to a 0–100% scale and visually represented as candles below the chart.
float vol = volume / ta.percentile_nearest_rank(volume, 1000, 100) * 100
Bar Coloring : Price candles are dynamically colored based on volume intensity.
Volume Divergence Logic :
Bullish Divergence : Price forms a lower low, but volume forms a higher low.
Bearish Divergence : Price forms a higher high, but volume forms a lower high.
Dynamic Detection Range : Customizable range ensures divergence signals are meaningful and not random.
Volume Labels : Additional info on divergence bars shows both the actual volume and its normalized % score.
🔵 FEATURES
Volume Heatmap Plot : Normalized volume values colored using a smooth gradient from aqua (low) to red (high).
Price Bar Coloring : Candlesticks on the main chart adopt the same heatmap color based on volume.
Divergence Detection :
Bullish divergence with label and low marker
Bearish divergence with label and high marker
Dual Divergence Labels :
On the volume plot : Direction (Bull/Bear), raw volume, and normalized %
On the price chart : Shape labels showing "Bull" or "Bear" at local highs/lows
Custom Inputs :
Divergence range (min & max), pivot detection distance (left/right)
Toggle to show/hide divergence labels, volume, and % text
Clear Bull/Bear Coloring : Fully customizable label and line colors for both bullish and bearish signals.
🔵 HOW TO USE
Use the indicator as an overlay to monitor real-time volume strength using the heatmap color.
Watch for divergence markers:
Bullish divergence: Candle shows higher volume while price makes a new low
Bearish divergence: Candle shows lower volume while price makes a new high
Use the volume info labels to verify the context of divergence:
Actual volume at divergence candle
Normalized % of that volume compared to past 1000 bars
Adjust pivot sensitivity using "Pivot Left" and "Pivot Right" to tune signal frequency and lag with a right pivot length.
Use divergence zones as early warnings for potential reversals or trend shifts.
Disable or customize labels in settings depending on your charting preferences.
🔵 CONCLUSION
Volume HeatMap Divergence merges heatmap-style volume visualization with intelligent divergence detection — giving traders a clean yet powerful edge. By revealing hidden disconnections between price and participation, it helps users spot exhaustion moves or hidden accumulation zones before the market reacts. Whether you’re a scalper, swing trader, or intraday strategist, this tool offers real-time clarity on who’s in control behind the candles.

IPO AVWAP with LabelThis indicator calculates the IPO Anchored Volume-Weighted Average Price (AVWAP) from the first bar of the chart and plots it as a line. It highlights when the price crosses above, crosses below, or touches the IPO VWAP with visual shapes and provides alert conditions for each event. Perfect for traders looking to track the initial trading benchmark of a stock and identify key intraday or swing trading levels.
Features:
Plots the IPO AVWAP line on the chart
Shows labels at the last bar with IPO AVWAP value
Detects price crosses and touches with markers
Supports custom alerts for cross/touch events

High/Low from Set Period with LabelsMark high and low from a set period.
I use it to mark Overnight Low and High of FDAX instrument, to achieve that :
- you need to use candle chart
- you need to use regular trading hours ( to include overnight trades )
- you need to set that on M2 timeframe
- you need to set time begin : 17:30
- you need to set time end : 08:58
- when it will be drawn in 09:02, then let extend it via a hand and then you can disable
Issues :
- it will be visible after finished miminum period time :
-- after 2 minutes on M2 ( 9:02 )
-- after 5 minutes on M5 ( 9:05 )
etc ...

Large Order DetectionHow It Works:
Green diamonds appear below bullish candles (close > open) when large volume is detected
Red diamonds appear above bearish candles (close < open) when large volume is detected
Diamond size scales based on how much larger the volume is compared to the average:
Smallest: 2-2.5x average volume
Medium: 2.5-4x average volume
Larger: 4-6x average volume
Largest: 6x+ average volume
Features:
Customizable threshold - Default is 2x average volume, but you can adjust this
Adjustable lookback - Default 50 bars for calculating average volume
Size range control - Set minimum and maximum diamond sizes
Subtle background highlight - Shows when large orders occur
Built-in alerts - Can notify you when large orders are detected
Usage Tips:
Lower timeframes (1-5min) will show more frequent large orders
Increase threshold multiplier (2.5-3.0x) on high-volume assets to reduce noise
Watch for clusters of same-colored diamonds = strong directional pressure
Red diamonds at resistance + bearish EMAs = strong sell signal
Green diamonds at support + bullish EMAs = strong buy signal

Big Orders Detector (Smart Cluster v4)The Big Orders Detector (Smart Cluster v4) is a trading indicator designed to highlight unusually large market orders and potential institutional activity directly on price charts. It identifies candles with volumes significantly above the recent average and can detect clusters of consecutive high-volume bars that may indicate accumulation or distribution by large players. The indicator visualizes these events using circles, labels with estimated monetary values, and a mini dashboard showing the current status of market activity.
Potential ways to use this indicator:
Spotting large market moves: Traders can use it to identify sudden spikes in volume that might precede significant price movements.
Monitoring institutional activity: The “Smart Cluster” feature highlights potential clusters of high-volume bars, which may suggest institutional accumulation or distribution.
Supporting trade decisions: It can serve as an additional layer of information alongside other technical analysis tools, helping traders gauge market interest and momentum.
Alert setup: Users can configure alerts for large orders or clusters to stay informed without constantly monitoring the chart.
Important considerations:
Nothing in trading is certain. This indicator highlights volume anomalies and potential clusters, but it does not guarantee profits or predict market direction.
Trading always involves risk, including the loss of capital. Use this indicator as a supplementary tool rather than a standalone strategy.
Proper risk management, position sizing, and confirmation from other analyses are essential when making trading decisions.
In essence, this tool is for information and insight, helping traders observe where significant market activity occurs, while emphasizing caution and the inherent uncertainty of financial markets.

Force DashboardScalping Dashboard - Complete User Guide
Overview
This scalping system consists of two complementary TradingView indicators designed for intraday trading with no overnight holds:
Force Dashboard - Single-row table showing real-time market bias and entry signals
Large Order Detection - Visual diamonds showing institutional order flow
Together, they provide a complete at-a-glance view of market conditions optimized for quick entries and exits.
Recommended Timeframes
Primary Scalping Timeframes
1-minute chart: Ultra-fast scalps (30 seconds - 3 minutes hold time)
2-minute chart: Quick scalps (2-5 minutes hold time)
5-minute chart: Standard scalps (5-15 minutes hold time)
Best Practices
Use 1-2 minute for highly liquid instruments (ES, NQ, major forex pairs)
Use 5-minute for less liquid markets or if you prefer fewer signals
Never hold past the last hour of trading to avoid overnight risk
Set hard stop times (e.g., exit all positions by 3:45 PM EST)
Dashboard Components Explained
Core Indicators (Circles ●)
MACD (5/13/5)
Green ● = Bullish momentum (MACD histogram positive)
Red ● = Bearish momentum (MACD histogram negative)
Gray ● = No clear momentum
Use: Confirms trend direction and momentum shifts
EMA (9/20/50)
Green ● = Price > EMA9 > EMA20 (uptrend)
Red ● = Price < EMA9 < EMA20 (downtrend)
Gray ● = Choppy/sideways
Use: Identifies the immediate micro-trend
Stoch (5-period Stochastic)
Green ● = Oversold (<20) - potential reversal up
Red ● = Overbought (>80) - potential reversal down
Gray ● = Neutral zone (20-80)
Use: Spots reversal opportunities at extremes
RSI (7-period)
Green ● = Oversold (<30)
Red ● = Overbought (>70)
Gray ● = Neutral
Use: Confirms overbought/oversold conditions
CVD (Cumulative Volume Delta)
Green ● = CVD above its moving average (buying pressure)
Red ● = CVD below its moving average (selling pressure)
Gray ● = Neutral
Use: Shows overall buying vs selling pressure
ΔCVD (Delta CVD - Rate of Change)
Green ● = CVD accelerating upward (buying acceleration)
Red ● = CVD accelerating downward (selling acceleration)
Gray ● = No acceleration
Use: Detects momentum shifts in order flow
Imbal (Order Flow Imbalance)
Green ● = Buy pressure >2x sell pressure
Red ● = Sell pressure >2x buy pressure
Gray ● = Balanced
Use: Identifies extreme one-sided order flow
Vol (Volume Strength)
Green ● = Volume >1.5x average (strong interest)
Red ● = Volume <0.7x average (low interest)
Gray ● = Normal volume
Yellow background = Volume surge (>2x average) - BIG MOVE ALERT
Use: Confirms conviction behind price moves
Tape (Tape Speed)
Green ● = Fast order flow (>1.3x normal)
Red ● = Slow order flow (<0.7x normal)
Gray ● = Normal speed
Yellow background = Very fast tape (>1.5x) - RAPID EXECUTION ALERT
Use: Measures urgency and speed of orders
Key Levels
Support (Supp)
Shows the nearest high-volume support level below current price
Bright Green background = Price is AT support (within 0.3%) - BOUNCE ZONE
Green background = Price above support (healthy)
Red background = Price below support (broken support, now resistance)
Resistance (Res)
Shows the nearest high-volume resistance level above current price
Bright Orange background = Price is AT resistance (within 0.3%) - REJECTION ZONE
Red background = Price below resistance (facing overhead supply)
Green background = Price above resistance (breakout)
These levels update automatically every 3 bars based on volume profile
Entry Signal Components
Score
Displays format: "6L" (6 long indicators) or "4S" (4 short indicators)
Bright Green = 6-7 indicators aligned for long
Light Green = 5 indicators aligned for long
Yellow = 4 indicators aligned (weaker setup)
Gray = No alignment
Red/Orange colors = Same scale for short setups
Score of 5+ indicates high-probability setup
SCALP (Main Entry Signal)
BRIGHT GREEN "LONG" = High-quality long scalp (Score 5+)
Green "LONG" = Decent long scalp (Score 4)
BRIGHT ORANGE "SHORT" = High-quality short scalp (Score 5+)
Red "SHORT" = Decent short scalp (Score 4)
Gray "WAIT" = No clear setup - STAY OUT
Entry Strategies
Strategy 1: High-Probability Scalps (Conservative)
When to Enter:
SCALP column shows BRIGHT GREEN "LONG" or BRIGHT ORANGE "SHORT"
Score is 5 or higher
Vol or Tape has yellow background (volume surge)
Example Long Setup:
SCALP = BRIGHT GREEN "LONG"
Score = 6L
Vol = Yellow background
Price AT Support (bright green Supp cell)
EMA, MACD, CVD, ΔCVD, Imbal all green
Entry: Enter immediately on next candle
Target: 0.5-1% move or resistance level
Stop: Below support or -0.3%
Hold Time: 2-10 minutes
Strategy 2: Momentum Scalps (Aggressive)
When to Enter:
Tape has yellow background (fast tape)
Vol has yellow background (volume surge)
ΔCVD is green (for longs) or red (for shorts)
Imbal shows strong imbalance in your direction
Score is 4+
Example Short Setup:
Tape & Vol = Yellow backgrounds
ΔCVD = Red, Imbal = Red
Price AT Resistance (bright orange)
Score = 5S
Entry: Enter immediately
Target: Quick 0.3-0.7% move
Stop: Tight -0.2%
Hold Time: 1-5 minutes
Strategy 3: Reversal Scalps (Mean Reversion)
When to Enter:
Stoch shows oversold (green) or overbought (red)
RSI confirms the extreme
Price is AT Support (for longs) or AT Resistance (for shorts)
ΔCVD and Imbal start reversing direction
Score is 4+
Example Long Setup:
Stoch = Green (oversold)
RSI = Green (oversold)
Supp = Bright green (at support)
ΔCVD turns green
Imbal turns green
Score = 4L or 5L
Entry: Wait for confirmation candle
Target: Move back to EMA9 or mid-range
Stop: Below the low
Hold Time: 3-8 minutes
Large Order Detection Usage
Diamond Signals
Green diamonds below bar = Large buy orders (institutional buying)
Red diamonds above bar = Large sell orders (institutional selling)
Size matters: Larger diamonds = larger order flow
How to Use with Dashboard
Confirmation Entries
Dashboard shows "LONG" signal
Green diamond appears
Enter immediately - institutions are buying
Divergence Alerts (CAUTION)
Dashboard shows "LONG" signal
RED diamond appears (institutions selling)
DO NOT ENTER - conflicting order flow
Cluster Patterns
Multiple green diamonds in row = Strong accumulation, stay long
Multiple red diamonds in row = Strong distribution, stay short
Alternating colors = Chop, avoid trading
Risk Management Rules
Position Sizing
Risk 0.5-1% of account per scalp
Maximum 3 concurrent positions
Reduce size after 2 consecutive losses
Stop Loss Guidelines
Tight stops: 0.2-0.3% for 1-2 min charts
Standard stops: 0.3-0.5% for 5 min charts
Always use stop loss - no exceptions
Place stops below support (longs) or above resistance (shorts)
Take Profit Targets
Target 1: 0.3-0.5% (take 50% off)
Target 2: 0.7-1% (take remaining 50%)
Move stop to breakeven after Target 1 hit
Trail stop if Score remains high
Time-Based Exits
Exit immediately if:
SCALP changes from LONG/SHORT to WAIT
Score drops below 3
Large diamond appears in opposite direction
Maximum hold time: 15 minutes (even if profitable)
Hard exit time: 30 minutes before market close
Trading Sessions
Best Times to Scalp
High-Liquidity Sessions
9:30-11:00 AM EST (Market open, highest volume)
2:00-3:30 PM EST (Afternoon session, good moves)
Avoid
11:30 AM-1:30 PM EST (Lunch, low volume)
Last 30 minutes (unpredictable, don't initiate new trades)
News releases (wait 5 minutes for volatility to settle)
Common Patterns & Setups
The Perfect Storm (Highest Probability)
Score = 6L or 7L
SCALP = BRIGHT GREEN
Vol + Tape = Yellow backgrounds
Green diamond appears
Price AT Support
Win rate: ~70-80%
The Fade Setup (Counter-Trend)
Price hits resistance (bright orange)
Stoch + RSI overbought (red)
Red diamond appears
CVD starts turning red
SCALP shows "SHORT"
Win rate: ~60-70%
The Breakout Continuation
Price breaks resistance (Res turns green)
EMA, MACD green
Vol surge (yellow)
Multiple green diamonds
SCALP = "LONG"
Win rate: ~65-75%
Warning Signs - DO NOT TRADE
Red Flags
❌ SCALP shows "WAIT"
❌ Score below 3
❌ Vol and Tape both gray (no volume)
❌ Conflicting signals (dashboard says LONG but red diamonds appearing)
❌ Alternating green/red circles (choppy market)
❌ Support and Resistance very close together (tight range)
Market Conditions to Avoid
Low volume periods
Major news releases (first 5 minutes after)
First 2 minutes after market open
Wide spreads
Consecutive losing trades (take a break after 2 losses)
Quick Reference Checklist
Before Taking ANY Trade:
☑ SCALP shows LONG or SHORT (not WAIT)
☑ Score is 4 or higher
☑ Vol or Tape shows activity
☑ No conflicting diamond signals
☑ Stop loss level identified
☑ Target profit level identified
☑ Not in restricted time periods
After Entering:
☑ Set stop loss immediately
☑ Set profit targets
☑ Watch SCALP column - exit if changes to WAIT
☑ Watch for opposite-colored diamonds
☑ Move stop to breakeven after first target
☑ Exit all by market close
Advanced Tips
Scalping Psychology
Be patient: Wait for Score 5+ setups
Be decisive: When signal appears, act immediately
Be disciplined: Follow your stop loss always
Be flexible: Exit quickly if dashboard reverses
Optimization
Backtest on your specific instrument
Adjust RSI/Stoch levels for your market
Fine-tune volume thresholds
Keep a trade journal to track which setups work best
Multi-Timeframe Confirmation
Use 5-min dashboard as "trend filter"
Take 1-min trades only in direction of 5-min SCALP signal
Increases win rate by ~10-15%
Troubleshooting
Q: Dashboard shows WAIT most of the time
Normal - scalping is about patience. Quality > Quantity
3-8 good setups per day is excellent
Q: Too many false signals
Increase minimum Score requirement to 5 or 6
Only trade with volume surge (yellow backgrounds)
Add large order detection confirmation
Q: Signals too slow
You may be on too high a timeframe
Try 1-minute chart for faster signals
Ensure real-time data feed is active
Q: Support/Resistance not updating
Normal - updates every 3 bars
If completely stuck, remove and re-add indicator
Summary
This scalping system works best when:
✅ Multiple indicators align (Score 5+)
✅ Volume and tape speed confirm the move
✅ Order flow (diamonds) confirms direction
✅ Price is at key levels (support/resistance)
✅ You manage risk strictly
✅ You exit before market close
The golden rule: When SCALP says WAIT, you WAIT. Discipline beats frequency.

Swing trade - Volume+EMAsHey G's, this is one of my live trading strategies for BTC on the 1H chart.
I am releasing it here as an indicator version:
How it works:
We need a 4H volume trigger.
The system starts watching for setups when a 4-hour candle closes with high volume and breaks above the recent range. That confirms a strong move and tells the indicator to start looking for 1H pullbacks to buy.
Then we wait for a pullback on the 1H chart.
Once the 4H trigger is active, the indicator waits for price to pull back into the EMA 12/21 zone. If we see a small consolidation there or a breakout above the recent high, you’ll see a “BUY 25%” signal.
Each “BUY 25%” adds a scale-in, up to 4 in total.
Exits.
All positions close when the 4H trend flips bearish (EMA 12 goes below EMA 21), or when the stop level from the 4H trigger candle gets hit.
That’s when you’ll see “SELL 100%”.
4H EMAs (look like stairs in the 1H chart) exit:
stoploss exit (as soon as price hits the red horizontal line we sell):
This indicator version is for visualization only, so it doesn’t execute trades.
The full strategy version exists but is not published here.
It’s made to be used together with my Advanced Volume Indicator, which helps confirm the 4H breakout volume.
You can find that indicator on my profile as well.
Works best during trending phases after big breakouts on BTCUSDT perps 1H chart.

NQ 55 LEVELSlevels to top and bottom tick
These levels top and bottom tick a lot of the times, use your own confluences to make them work

GCE 3:55 LEVELSlevels to top and bottom tick
These levels top and bottom tick a lot of the times, use your own confluences to make them work

The Butterfly Elephant EffectStrategy Overview: The Butterfly Elephant Effect
Concept & Philosophy:
Welcome to "The Butterfly Elephant Effect," a sophisticated multi-indicator strategy that operates on the principle that small, precise technical signals (the Butterfly) can trigger significant market moves (the Elephant Effect). This strategy is designed to identify high-probability reversal points by combining three powerful analytical systems into one cohesive framework. It seeks to catch major trend reversals at key support and resistance levels, using a confluence of volume, momentum, and overbought/oversold oscillators.
Core Components:
The strategy intelligently synthesizes three distinct systems:
Lucky Balls System (Volume & Trend):
Utilizes the Negative Volume Index (NVI) and Positive Volume Index (PVI) to understand smart money activity and trend strength.
Plots these indices on the price chart, scaled to the recent price range for actionable signals.
Generates signals when price interacts with a moving average envelope, identifying potential exhaustion points.
Momentum Confirmation System:
Combines RSI, CCI, and PPO momentum oscillators into a single, refined line.
This "Momentum Composite" line is used to confirm the strength of a reversal signal as it crosses the dynamic envelope bands.
Lucky Table System (Market Breadth & Confluence):
This is the heart of the strategy's filtering mechanism. It runs 36 different oscillator readings across 6 different timeframes for Stochastic, Williams %R, RSI, and MACD.
It counts the number of these oscillators that are in extreme overbought or oversold territory.
A "Lucky Table" signal is generated when the number of matching oscillators exceeds your customizable threshold (e.g., 30 out of 36), indicating a massive, multi-timeframe consensus on market exhaustion.
The Ultimate Signals:
The strategy's most powerful entries are the specially named signals that require a perfect storm of conditions:
🐘 Elephant Long Signal: Triggers when the Momentum System gives a buy, the Lucky Table shows extreme oversold consensus, AND the price is at or below the adjusted lower envelope band. This represents a potential major bullish reversal from a support zone.
🦋 Butterfly Short Signal: Triggers when the Momentum System gives a sell, the Lucky Table shows extreme overbought consensus, AND the price is at or above the adjusted upper envelope band. This represents a potential major bearish reversal from a resistance zone.
Key Features:
Visual Clarity: A rich set of plotshapes (🪜, 🐍, 🐸, ✈️, ⚽) makes it easy to identify the contributing signals from each subsystem on the chart.
Comprehensive Dashboard: A real-time table displays all 36 oscillator values from the Lucky Table, color-coded for quick assessment of market conditions.
Flexible Risk Management: Includes optional Profit Target and Stop Loss based on a percentage of entry price.
Highly Customizable: Every parameter—from lookback lengths and scale factors to the crucial match threshold—can be adjusted to fit your trading style and instrument.
How to Use:
Add the strategy to your chart.
Look for the primary Elephant (🐘) or Butterfly (🦋) signals near the envelope boundaries.
Use the Lucky Table on the top-right to confirm the strength of the oversold/overbought conditions.
Manage your trade using the built-in PT/SL or your own discretion.
Ideal For: Swing traders and position traders looking for high-conviction entries at potential market turning points.
Disclaimer: This is a complex strategy designed for educational and research purposes. Always test and forward-test any strategy in a simulated environment before committing real capital. Past performance is not indicative of future results.
PS Look out for the Frog :-)

War Room – Combined HUD v3.4 (Cap T+1, RTH+ON H/L)War Room Combined HUD — Futures / Flow Command Panel
Purpose:
A high-performance multi-layer heads-up display (HUD) designed for intraday futures trading (optimized for NQ/ES). It merges market flow, volume delta, session structure, and directional bias models into a single at-a-glance command panel.
Core Features:
Score / Bias Engine: Aggregates VWAP positioning, delta slope, and CVD structure to produce a live bias score (–5 → +5 scale) and simplified bias label (SBear → SBull).
State Monitor: Detects alignment or conflict between intraday bias and real-time flow. Highlights counter-trend conditions (“Use magnets / half size”) vs. aligned continuation.
Trap Detection (Dual):
Trap Short (shorts trapped, squeeze-up risk)
Trap Long (longs trapped, flush-down risk)
Color-coded strength meter indicates WATCH / TRAPPED / SQUEEZE.
Session CVD Table: Displays cumulative volume delta (CVD) and block delta by region — Asia / London / New York / Global — with auto-classified modes: Initiative Buy, Initiative Sell, Absorption, Distribution, or Neutral.
Flow Dominance Gauge: Tracks Global vs. Local momentum; signals when session flow diverges from the global CVD vector.
Price Anchors: Displays ON (overnight) high/low, RTH (regular trading hours) high/low, and prior session reference points (POC, VAH, VAL, HVN, LVN).
Capitulation T+1 Forecast: Computes early warning probability for next-day capitulation or squeeze events using volatility stretch, CVD intensity, control %, and score extremes. Direction marked with ↑ / ↓ arrow.
Futures / Flow Lower HUD (Optional): A cadence-based flow log showing Time, Px, VWAP, Δ, CVD, Bias, and Trap for the most recent 15-minute blocks — a micro-tape of intraday flow behavior.
Usage:
Primary HUD (top panel) → Real-time decision layer (bias, traps, state, cap-forecast).
Lower HUD (optional) → Historical flow context and confirmation.
Designed for use on 1m–15m charts, tuned for New York RTH bias detection.
Visual Key:
🟩 Green → Bullish continuation or trapped shorts
🟥 Red → Bearish continuation or trapped longs
🟧 Orange → Countertrend / Watch zone
⚫ Gray/Black → Neutral or no signal

Smart VWAP FVG SystemSmart VWAP FVG System - Professional Multi-Filter Trading Indicator
📊 OVERVIEW
The Smart VWAP FVG System is an advanced multi-layered trading indicator that combines institutional volume analysis, multi-timeframe VWAP trend confirmation, and Fair Value Gap detection to identify high-probability trade entries. This indicator uses a sophisticated filtering mechanism where signals appear only when multiple independent confirmation criteria align simultaneously.
Recommended Timeframe: 5-minute (M5) or higher. The indicator works best on M5, M15, and M30 charts for intraday trading.
🎯 ORIGINALITY & PURPOSE
This indicator is original because it combines three distinct analytical methods into a unified decision-making system:
Market Profile Volume Analysis - Identifies institutional accumulation/distribution zones
Dual VWAP Filtering - Confirms trend direction using two independent VWAP calculations
Fair Value Gap Detection - Validates institutional interest through price inefficiency zones
The key innovation is the directional filter system: the primary Market Profile generates BUY-ONLY or SELL-ONLY states based on higher timeframe value area reversals, which then controls which signals from the main system are displayed. This creates a multi-timeframe confluence that significantly reduces false signals.
Unlike simple indicator mashups, each component serves a specific purpose:
Market Profile → Direction bias (trend filter)
Primary VWAP (Session) → Short-term trend confirmation
Secondary VWAP (Week) → Medium-term trend confirmation
FVG Detection → Institutional activity validation
🔧 HOW IT WORKS
1. Primary Market Profile Filter (Higher Timeframe)
The indicator calculates Market Profile on a higher timeframe (default: 1 hour) to determine the overall market structure:
Value Area High (VAH): Top 70% of volume distribution
Value Area Low (VAL): Bottom 70% of volume distribution
Point of Control (POC): Price level with highest volume
When price reaches VAH and reverses down → SELL-ONLY mode activated
When price reaches VAL and reverses up → BUY-ONLY mode activated
This higher timeframe filter ensures you're trading in the direction of institutional flow.
2. Dual VWAP System
Two independent VWAP calculations provide multi-timeframe trend confirmation:
Primary VWAP (Session-based): Resets daily, tracks intraday momentum
Secondary VWAP (Week-based): Resets weekly, confirms longer-term trend
Filter Logic:
BUY signals require: Price > Primary VWAP AND Price > Secondary VWAP
SELL signals require: Price < Primary VWAP AND Price < Secondary VWAP
This dual confirmation prevents counter-trend trades during ranging conditions.
3. Fair Value Gap (FVG) Detection
FVG zones identify price inefficiencies where institutional orders were executed rapidly:
Bullish FVG: Gap between candle .high and candle .low (upward imbalance)
Bearish FVG: Gap between candle .high and candle .low (downward imbalance)
The indicator monitors recent FVG formation (lookback: 50 bars) and requires:
Bullish FVG present for BUY signals
Bearish FVG present for SELL signals
FVG zones are displayed as colored boxes and automatically marked as "mitigated" when price fills the gap.
4. Main Trading Signal Logic
The secondary Market Profile (default: 1 hour) generates the actual trading signals:
BUY Signal Conditions:
Price reaches Value Area Low
Reversal pattern confirmed (minimum 1 bar)
Price > Primary VWAP
Price > Secondary VWAP (if filter enabled)
Recent Bullish FVG detected (if filter enabled)
Primary MP Filter = BUY-ONLY or NEUTRAL
SELL Signal Conditions:
Price reaches Value Area High
Reversal pattern confirmed (minimum 1 bar)
Price < Primary VWAP
Price < Secondary VWAP (if filter enabled)
Recent Bearish FVG detected (if filter enabled)
Primary MP Filter = SELL-ONLY or NEUTRAL
All conditions must be TRUE simultaneously for a signal to appear.
📈 VISUAL ELEMENTS
On Chart:
🟢 Green Triangle (▲) = BUY Signal
🔴 Red Triangle (▼) = SELL Signal
🟦 Blue horizontal lines = Value Area zones
🟡 Yellow line = Point of Control (POC)
🟩 Green boxes = Bullish FVG zones
🟥 Red boxes = Bearish FVG zones
🔵 Blue line = Primary VWAP (Session)
⚪ White line = Secondary VWAP (Week)
Info Panel (Top Right):
Real-time status display showing:
Filter Direction (BUY ONLY / SELL ONLY / NEUTRAL)
Active timeframes for both MP filters
FVG filter status and count
VWAP positions (ABOVE/BELOW)
Signal enablement status
Alert status
⚙️ KEY SETTINGS
MP/TPO Filter Settings (Primary Indicator)
MP Filter Time Frame: 60 minutes (controls directional bias)
Filter Value Area %: 70% (standard Market Profile calculation)
Filter Alert Distance: 1 bar
Filter Min Bars for Reversal: 1 bar
Filter Alert Zone Margin: 0.01 (1%)
FVG Filter Settings
Use FVG Filter: Enabled (toggle on/off)
FVG Timeframe: 60 minutes (1 hour)
FVG Filter Mode: Both (require bullish FVG for BUY, bearish for SELL)
FVG Lookback Period: 50 bars (how far back to search)
Show FVG Formation Signals: Optional visual markers
Max FVG on Chart: 50 zones
Show Mitigated FVG: Display filled gaps
Market Profile Settings
Higher Time Frame: 60 minutes (for main signals)
Percent for Value Area: 70%
Show POC Line: Enabled
Keep Old MPs: Enabled (maintain historical profiles)
Primary VWAP Filter
Use Primary VWAP Filter: Enabled
Primary VWAP Anchor Period: Session (resets daily)
Primary VWAP Source: HLC3 (typical price)
Secondary VWAP Filter
Use Secondary VWAP Filter: Enabled
Secondary VWAP Anchor Period: Week (resets weekly)
Secondary VWAP Filter Mode: Both
Secondary VWAP Line Color: White
Trading Signals
Show Trading Signals on Chart: Enabled
Show SELL Signals: Enabled
Show BUY Signals: Enabled
Alert Distance: 1 bar
Min Bars for Reversal: 1 bar
Alert Zone Margin: 0.01 (1%)
Retest Search Period: 20 bars
Min Bars Between Retests: 5 bars
Show Only Retests: Disabled
Alert Settings
Enable Trading Notifications: Enabled
VAH Reversal Alert: Enabled (SELL signals)
VAL Reversal Alert: Enabled (BUY signals)
Time Filter Settings
Filter Alerts By Time: Optional (exclude specific hours)
⚠️ IMPORTANT WARNINGS & LIMITATIONS
1. Repainting Behavior
CRITICAL: This indicator uses lookahead=barmerge.lookahead_on to access higher timeframe data immediately for FVG detection. This is necessary to provide real-time FVG zone visualization but has the following implications:
FVG zones may shift slightly until the higher timeframe candle closes
FVG detection signals are preliminary until HTF bar confirmation
The main trading signals (triangles) appear on confirmed bars and do not repaint
Best Practice: Always wait for the current timeframe bar to close before acting on signals. The filter status and FVG zones are informational but may adjust as new data arrives.
2. Minimum Timeframe
Do NOT use on timeframes below 5 minutes (M5)
Recommended: M5, M15, M30 for intraday trading
Higher timeframes (H1, H4) can also be used but will generate fewer signals
3. Multiple Filters Can Block Signals
By design, this indicator is conservative. When all filters are enabled:
Signals appear ONLY when all conditions align
You may see extended periods with no signals
This is intentional to reduce false positives
If you see no signals:
Check the Info Panel to see which filters are failing
Consider adjusting FVG lookback period
Temporarily disable FVG filter to test
Verify VWAP filters match current market trend
4. Market Profile Limitations
Market Profile requires sufficient volume data
Low-volume instruments may produce unreliable profiles
Value Areas update only on higher timeframe bar close
Works best on liquid markets (major forex pairs, indices, crypto)
📖 HOW TO USE
Step 1: Add to Chart
Apply indicator to M5 or higher timeframe chart
Ensure chart shows volume data
Use standard candles (NOT Heikin Ashi, Renko, etc.)
Step 2: Configure Settings
Primary MP Filter TF: Set to 60 (1 hour) minimum, or 240 (4 hour) for swing trading
Main MP TF: Set to 60 (1 hour) for intraday signals
FVG Timeframe: Match or exceed main MP timeframe
Leave other settings at default initially
Step 3: Understand the Info Panel
Monitor the top-right panel:
FILTER STATUS: Shows current directional bias
NEUTRAL = Both signals allowed
BUY ONLY = Only green triangles will appear
SELL ONLY = Only red triangles will appear
FVG Filter: Shows if bullish/bearish gaps detected recently
VWAP positions: Confirms trend alignment
Step 4: Take Signals
For BUY Signal (Green Triangle ▲):
Wait for green triangle to appear
Check Info Panel shows ✓ for BUY signals
Confirm current bar has closed
Enter long position
Stop loss: Below recent VAL or swing low
Target: Previous Value Area High or 1.5-2× risk
For SELL Signal (Red Triangle ▼):
Wait for red triangle to appear
Check Info Panel shows ✓ for SELL signals
Confirm current bar has closed
Enter short position
Stop loss: Above recent VAH or swing high
Target: Previous Value Area Low or 1.5-2× risk
Step 5: Risk Management
Risk per trade: Maximum 1-2% of account equity
Position sizing: Adjust based on stop loss distance
Avoid trading: During major news events or time filter periods
Multiple confirmations: Look for confluence with price action (support/resistance, trendlines)
🎓 UNDERLYING CONCEPTS
Market Profile Theory
Developed by J. Peter Steidlmayer in the 1980s, Market Profile organizes price and volume data to identify:
Value Areas: Where 70% of trading activity occurred
POC: Price level with highest acceptance (most volume)
Imbalances: When price moves away from value quickly
This indicator uses TPO (Time Price Opportunity) calculation method to build the volume profile distribution.
VWAP (Volume Weighted Average Price)
VWAP represents the average price weighted by volume, showing where institutional traders are positioned:
Price above VWAP = Bullish (institutions accumulated lower)
Price below VWAP = Bearish (institutions distributed higher)
Using dual VWAP (Session + Week) creates multi-timeframe trend alignment.
Fair Value Gaps (FVG)
Also known as "imbalance" or "inefficiency," FVG occurs when:
Price moves so rapidly that a gap forms in the candlestick structure
Indicates institutional order flow (large market orders)
Price often returns to "fill" these gaps (rebalance)
The 3-candle FVG pattern (gap between candle and candle ) is widely used in ICT (Inner Circle Trader) methodology and Smart Money Concepts.
🔍 CREDITS & CODE ATTRIBUTION
This indicator builds upon established technical analysis concepts and combines multiple methodologies:
1. Market Profile / TPO Calculation
Concept Origin: J. Peter Steidlmayer (Chicago Board of Trade, 1980s)
Code Inspiration: TradingView's public domain Market Profile examples
Modifications: Custom filtering logic for directional bias, dual timeframe implementation
2. VWAP Calculation
Concept Origin: Standard financial instrument (widely used since 1980s)
Code Base: TradingView built-in ta.vwap() function (public domain)
Modifications: Dual VWAP system with independent anchor periods, custom filtering modes
3. Fair Value Gap Detection
Concept Origin: Inner Circle Trader (ICT) / Smart Money Concepts methodology
Code Implementation: Original implementation based on 3-candle gap pattern
Features: Multi-timeframe detection, automatic mitigation tracking, visual zone display
4. Pine Script Framework
Language: Pine Script v6 (TradingView)
Built-in Functions Used:
ta.vwap() - Volume weighted average price
request.security() - Higher timeframe data access
ta.change() - Period detection
ta.cum() - Cumulative volume
time() - Timestamp functions
Note: All code is original implementation. While concepts are based on established trading methodologies, the combination, filtering logic, and execution are unique to this indicator.
📊 RECOMMENDED INSTRUMENTS
Best Performance:
Major Forex Pairs (EURUSD, GBPUSD, USDJPY)
Stock Indices (ES, NQ, SPX, DAX)
Major Cryptocurrencies (BTCUSD, ETHUSD)
Liquid Stocks (high daily volume)
Avoid:
Low-volume altcoins
Illiquid stocks
Exotic forex pairs with wide spreads
⚡ PERFORMANCE TIPS
Start Conservative: Enable all filters initially
Reduce Filters Gradually: If too few signals, disable Secondary VWAP filter first
Match Timeframes: Keep MP Filter TF and FVG TF at same value
Backtest First: Review historical performance on your preferred instrument/timeframe
Combine with Price Action: Look for support/resistance confluence
Use Time Filter: Avoid low-liquidity hours (optional setting)
🚫 WHAT THIS INDICATOR DOES NOT DO
Does not guarantee profits - No trading system is 100% accurate
Does not predict the future - Based on historical patterns
Does not replace risk management - Always use stop losses
Does not work on all instruments - Requires volume data and liquidity
Does not provide exact entry/exit prices - Signals are zones, not precise levels
Does not account for fundamentals - Purely technical analysis
📜 DISCLAIMER
This indicator is provided for educational and informational purposes only. It is not financial advice, and past performance does not guarantee future results.
Trading Risk Warning:
All trading involves risk of loss
You can lose more than your initial investment (leverage products)
Only trade with capital you can afford to lose
Always use appropriate position sizing and risk management
Consider seeking advice from a licensed financial advisor
Technical Limitations:
Indicator may repaint FVG zones until HTF bar closes
Signals are based on historical patterns that may not repeat
Market conditions change and no system works in all environments
Volume data quality varies by exchange/broker
By using this indicator, you acknowledge these risks and agree that the author bears no responsibility for trading losses.
📞 SUPPORT & UPDATES
Questions? Comment on this publication
Issues? Describe the problem with chart screenshot
Feature Requests? Suggest improvements in comments
Updates: Will be published as new versions using TradingView's update feature
📝 VERSION HISTORY
Version 1.0 (Current)
Initial public release
Multi-filter system: MP + Dual VWAP + FVG
Directional bias filter
Real-time info panel
Comprehensive alert system
Time-based filtering
Thank you for using Smart VWAP FVG System!
Happy Trading! 📈

Twiggs Go Money Flow Enhanced [KingThies]█ OVERVIEW
The Twiggs Money Flow (TMF) is a volume-weighted momentum oscillator that
measures buying and sellistng pressure by analyzing where price closes within
each bar's true range. It's an enhanced version of Chaikin Money Flow that
uses Wilder's smoothing method, providing better trend persistence and
smoother signals.
The indicator oscillates around a zero listne:
Values above zero indicate accumulation (buying pressure)
Values below zero indicate distribution (sellistng pressure)
TMF was developed by Colistn Twiggs as an improvement over traditional money
flow indicators by incorporating true range calculations and Wilder's
exponential moving average.
█ CONCEPTS
True Range Boundaries
TMF calculates a modified true range for each bar by comparing the current
bar's high and low with the previous close:
True Range High = maximum of (previous close, current high)
True Range Low = minimum of (previous close, current low)
This accounts for overnight gaps and ensures price continuity between bars.
Average Daily Value (ADV)
The ADV represents the portion of volume attributable to buying versus sellistng:
ADV = Volume × ((Close - TR Low) - (TR High - Close)) / True Range
When price closes near the high of the true range, ADV is positive and large.
When price closes near the low, ADV is negative and large.
A close in the middle produces values near zero.
Wilder's Moving Average
Unlistke simple moving averages, Wilder's smoothing method gives more weight
to recent values while maintaining memory of historical data:
WMA = (Previous WMA × (Period - 1) + Current Value) / Period
This creates smoother trends that are less prone to whipsaws than standard
moving averages.
Final Calculation
TMF = Wilder's MA(ADV, Period) / Wilder's MA(Volume, Period)
By dividing smoothed ADV by smoothed volume, TMF normalistzes the reading and
makes it comparable across different securities and timeframes.
█ HOW TO USE
Zero listne Crossovers
The most straightforward trading signals:
A cross above zero suggests buyers are gaining control.
Consider this a bullistsh signal, especially when confirmed by price action.
A cross below zero suggests sellers are gaining control.
Consider this a bearish signal.
The longer TMF remains above or below zero, the stronger the trend.
Extreme Values
Strong positive or negative readings indicate intense buying or sellistng pressure:
Sustained high positive values (above +0.4) suggest strong accumulation
but may also indicate overbought conditions.
Sustained low negative values (below -0.4) suggest strong distribution
but may also indicate oversold conditions.
These extremes work best when used in conjunction with price levels and
support/resistance zones.
Divergences
Divergences between price and TMF often signal potential reversals:
Bearish divergence: Price makes a higher high but TMF makes a
lower high — suggests buying pressure is weakening despite rising prices.
Bullistsh divergence: Price makes a lower low but TMF makes a
higher low — suggests sellistng pressure is weakening despite fallistng prices.
Trend Confirmation
Use TMF to confirm the strength of existing trends:
In an uptrend, TMF should remain mostly positive with occasional dips below zero.
In a downtrend, TMF should remain mostly negative with occasional rises above zero.
If TMF contradicts the price trend, consider the trend weak or potentially ending.
█ FEATURES
Period (default: 21)
The lookback length for Wilder's moving average calculation:
Shorter periods (10–15) make TMF more responsive to recent changes but
increase noise and false signals.
Longer periods (30–50) create smoother readings but lag price action more
significantly.
The default 21-period setting balances responsiveness with relistabilistty.
Consider adjusting the period based on your trading timeframe and the
volatilistty of the security you're analyzing.
█ LIMITATIONS
TMF is a lagging indicator due to its smoothing method. Signals may occur
after optimal entry or exit points.
In low-volume or illistquid markets, TMF can produce erratic readings that
may not reflect true buying or sellistng pressure.
Ranging or choppy markets often generate frequent zero-listne crosses that
can lead to whipsaws.
listke all volume-based indicators, TMF's relistabilistty depends on accurate
volume data.
For securities with unrelistable volume reporting, consider using
price-based momentum indicators instead.
█ NOTES
This indicator uses area-style plotting in the original version to visualistze
the magnitude of buying and sellistng pressure. The filled area makes it easy
to see at a glance whether the market is in accumulation or distribution mode.
TMF works on any timeframe but tends to be most relistable on daily charts
where volume data is most accurate and meaningful.
█ CREDITS
Original indicator developed by
LazyBear .
Based on the Twiggs Money Flow concept from Incredible Charts:
Incredible Charts – Twiggs Money Flow .

BVC - Optimized Trend StrengthOverview
BVC-Optimized Trend Strength is a next-generation trend evaluation system designed specifically for the Casablanca Stock Exchange (BVC).
It measures the true strength of bullish and bearish pressure using a combination of advanced technical filters:
• Trend structure via MM20 & MM50
• Market momentum via RSI
• Breakout confirmation using Donchian levels
• Volume validation based on BVC liquidity characteristics
• Slope strength of the fast moving average
• Weighted scoring engine (0 → 100)
• Non-repainting BUY/SELL signals
• Background regime detection (Bull / Bear / Neutral)
It is engineered to be highly configurable, lightweight, and fully adapted to BVC market behavior, where liquidity, breakout reliability, and trend confirmation behave differently from US or European markets.
⸻
How It Works
At every bar, the script evaluates 6 categories of trend evidence.
Each category contributes a configurable weight to a final Bull Score and Bear Score, each ranging from 0 to 100.
Bull Score Components
• Price above MM20
• MM20 above MM50
• Positive MA slope
• RSI above bullish threshold
• Donchian bullish breakout (non-repainting)
• Volume confirmation
Bear Score Components
Exact mirror of the bullish setup.
The result is a quantitative trend strength meter that reflects the true pressure behind the market.
⸻
Non-Repainting BUY & SELL Signals
Signals only trigger when the calculated score crosses your minimum threshold (default: 60).
Labels fire once, at the close of the candle, using:
MM crossovers
RSI regime shifts
Donchian breakouts
Trend structure & volume validation
All signals are non-repainting, meaning what you see historically is exactly what was printed live.
Labels include:
BUY • Very Strong (85/100)
SELL • Strong (65/100)
⸻
Background Regime Detection
The chart background automatically adapts to market conditions:
• Green → confirmed bullish regime
• Red → confirmed bearish regime
• Gray → mixed or transition phase
You may customize transparency and behavior.
⸻
Top-Right Dashboard
A clean summary panel displays:
• Price
• MM20
• MM50
• RSI
• Bull/Bear scores
• Recommended Action: BUY / HOLD, SELL / AVOID or WAIT
This gives traders an instant, objective view of market conditions.
⸻
Alerts
Built-in TradingView alerts:
• BUY Signal
• SELL Signal
Customize them directly through the TradingView alerts panel.
⸻
Ideal For
Swing traders
Position traders
Portfolio managers
Trend-followers
BVC investors wanting objective confirmation
Traders who hate repainting signals
⸻
Why It Works on the BVC
The BVC behaves differently from high-frequency markets.
Breakouts often require confirmation, low volume distorts momentum, and many assets move in structured waves.
This script integrates all these insights into a single, powerful and unified indicator—built for Morocco, by someone who trades Morocco.
⸻
Disclaimer
This indicator does not guarantee profits and should be combined with market structure, liquidity evaluation, and proper risk management. Past performance does not guarantee future results.
