Weighted Moving Average Price (WMAP) BandWeighted Moving Average Price (WMAP) Band : As it's name here a 236 Period WMAP used with 1.46 StdDev Uper and Lower Bands, You need to select Indicator Timeframe as 1 minute for butter result. it work for all type of market stock where trading is possible.
Prosta średnia krocząca (SMA)

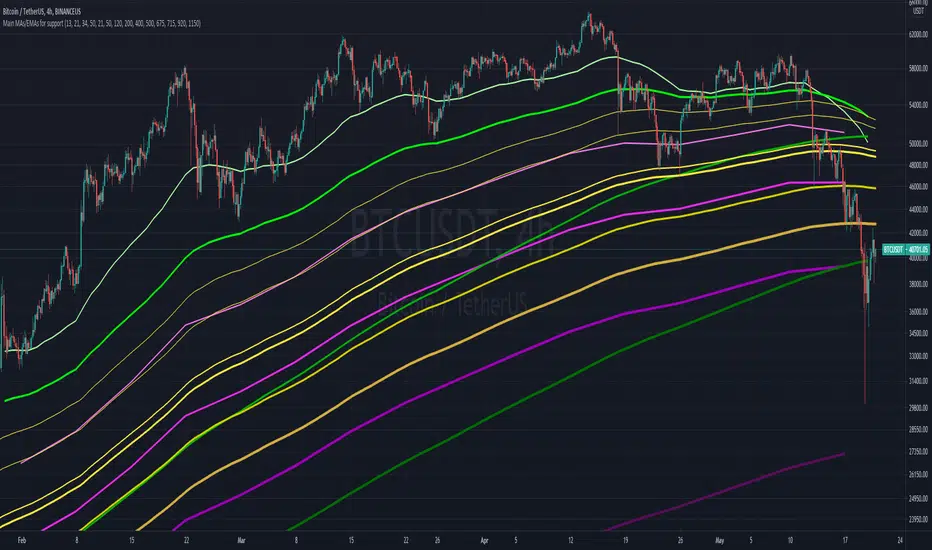
Main MAs and EMAs multi-timeframe for supportObjective is to map out different multi-timeframe support/resistance , all at once. Includes weekly, daily and 4H EMAs and MAs, as per the follow (allowing customization)
WEEKLY (in pink/purple variations):
- 13 EMA
- 21 EMA
- 34 EMA
- 50 M.A
DAILY (in green variations):
- 21 EMA
- 50 EMA
- 120 M.A.
- 200 M.A.
4H (in yellow/golden colors):
- 400 EMA
- 500 EMA
- 675 EMA
- 715 EMA
- 920 EMA
- 1150 EMA
Notes:
- Quite useful to all types of assets; crypto, commodities , stocks, etc...
- Ideally not to be visible all the time, as it can "pollute" the charts. But very helpful in moments of great volatility
Moving Average Buy/Sell IndicatorUsing a selected Exponential Moving Average (EMA)/Simple Moving Average (SMA) range, this indicator inserts a Long/Short (buy/sell) indicator overlaid on chart depending on the following conditions:
- LONG/BUY SIGNAL = if SMA value is less than EMA, and both the SMA and EMA are less than the current average price.
- SHORT/SELL SIGNAL = if SMA value is greater than EMA, and both the SMA and EMA are greater than the current average price.
**Intended for use with the 21 and 34 weekly moving average time range. Much more useful for long-term analysis rather than short-term analysis.**

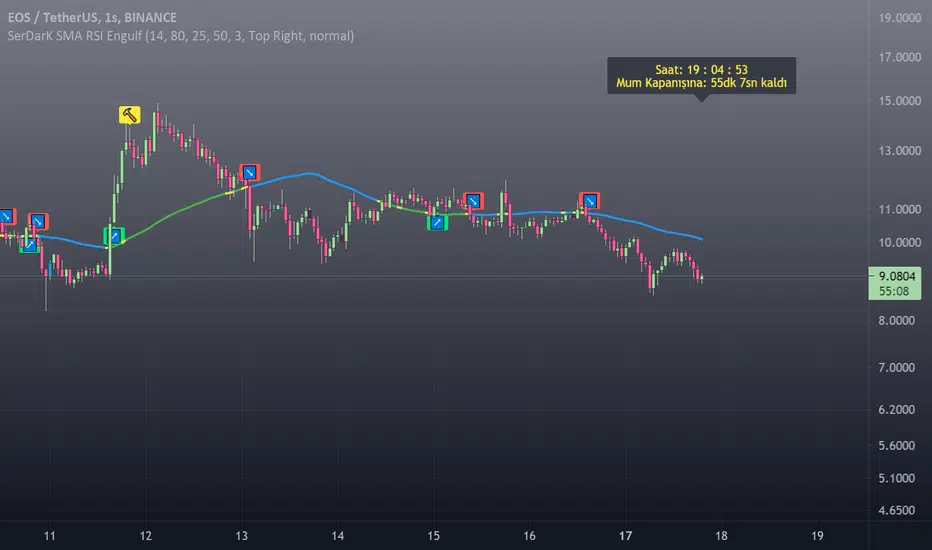
[SerDarK] SMA RSI Engulfing BarENG: This indicator includes the SMA line colored according to the price position, the RSI to identify the bearish or the bullish points, the Engulfing bars, the clock and the information panel showing the countdown to the candle closing.
SMA: default period is set to 50. It can change from the settings.
Definition of SMA line default colors: When the price is below the SMA line, its color is blue. It is green when the price is above the SMA line. It is yellow in RSI alerts and when the price hits the SMA line.
RSI: default period 14 is set. It can be changed in the settings.
🔨 Hammer Emoji: RSI is located at the overbought turnaround point. This sign does not mean that the trend will definitely return.
🚀Rocket Emoji: Tries to catch the "RSI oversold point turn".This sign does not mean that the trend will definitely return.
↗️↘️Up and Down arrows emojis. After the price crosses the SMA line, it indicates that it is closing a candle in that direction.
Engulfing candles: bullish engulfing candle is blue color. Bear engulfing candle is black in color.colors can be changed in settings.
Note that this indicator is only an indicator. It does not give advice on buying or selling.
Enjoy
TUR: Bu indikatör, fiyat konumuna göre renklendirilmiş SMA çizgisi, RSI ile düşüş veya yükseliş noktalarını belirleme, Engulfing (Yutan) barlar , saat ve mum kapanışı için geri sayım gösteren bilgi paneli içermektedir.
SMA: varsayılan periyodu 50 ayarlıdır. Ayarlardan değiştirebilir.
SMA çizgisi varsayılan renklerinin tanımı: Fiyat SMA çizgisi altında iken rengi mavidir. Fiyat SMA çizgisi üstünde iken yeşildir. RSI uyarılarında ve fiyat SMA çizgisine temas ettiğinde sarı renktedir.
RSI: varsayılan periyodu 14 ayarlanmıştır. Ayarlardan değiştirilebilir.
🔨 Çekiç Emojisi: RSI aşırı alım dönüş noktasında bulunur. Bu işaret trendin kesin döneceği anlamına gelmez.
🚀Roket Emojisi: "RSI aşırı satım noktası dönüşünü "yakalamaya çalışır. Bu işaret trendin kesin döneceği anlamına gelmez.
↗️↘️Yukarı ve Aşağı yönlü okl emojileri. Fiyat SMA çizgisini kestikten sonra, o yönde mum kapattığını gösterir.
Engulfing mumları: bullish engulfing (yutan boğa) mumu mavi renktir. Bear engulfing (yutan ayı) mumu siyah renktir. Renkler ayarlardan değiştirilebilir.
Not: Bu indikatörün yalnızca gösterge olduğunu unutmayın. Alma satma tavsiyesi vermez.
Kalan süre etiketi BIST gibi sınırlı süreli sembollerde, gün ve daha üstü periyotlarda doğru çalışmayabiliyor.
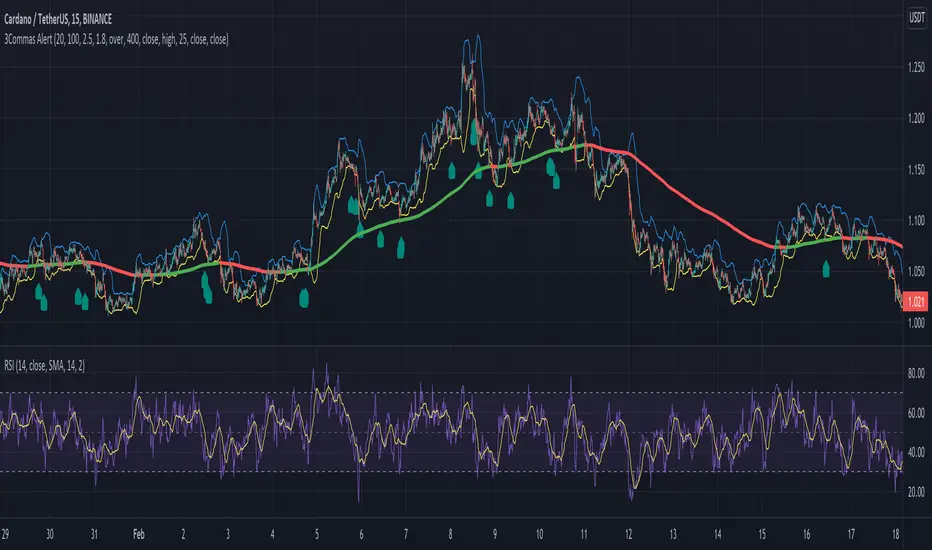
Alert for 3Commas Bollinger StrategyThis is just an alert for the 3Commas Bollinger Strategy written by tedwardd
CAPE (Shiller PE) RatioCalculating the Shiller PE Ratio (aka cyclically adjusted price to earnings ratio). The calculation is similar to the traditional PE ratio, however uses the simple average of the earnings over past 5 years (default is 5, can choose different) adjusted for inflation (default is the Australian CPI index however a different index can be used in the input).
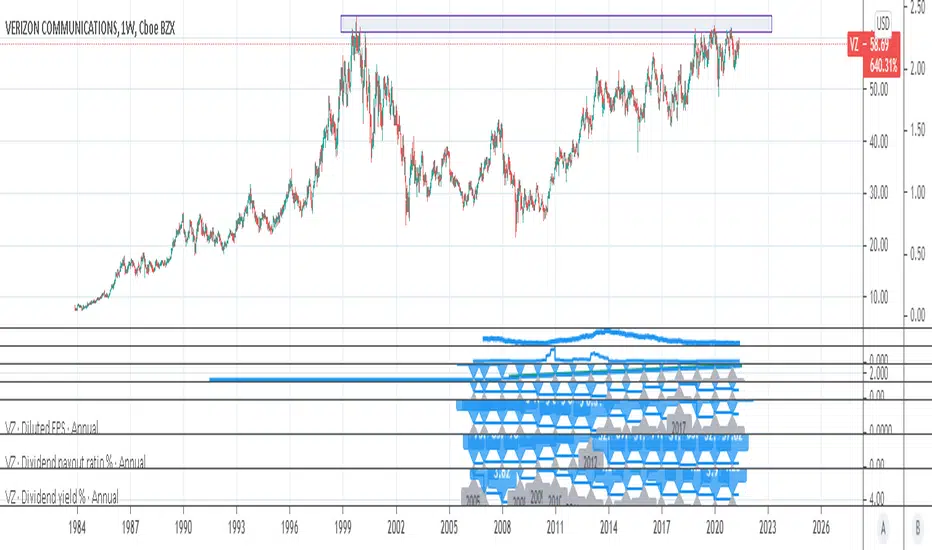
Stan Weinstein 30-week Moving AverageStan Weinstein's book 'Secrets for Profiting in Bull and Bear Markets' is without doubt one of the classics books traders read.
Weinstein said that at any one point in time, a stock (or an index) will be in one of four market "stages":
Stage 1 the Basing Area (also known as consolidation or accumulation phase)
Stage 2 the Advancing Stage
Stage 3 the Top Area (also known as the distribution phase), or
Stage 4 the Declining Stage
One of the concepts from the book that became classic is the definition of the four stages a stock can be in. These stages basically classify the different periods in the lifetime of a stock. An important thing to understand is that Weinstein uses weekly charts and identifies the current stage based on the direction on the 30 week moving average.
This script plots the 30 week moving average and the 150 day moving average.
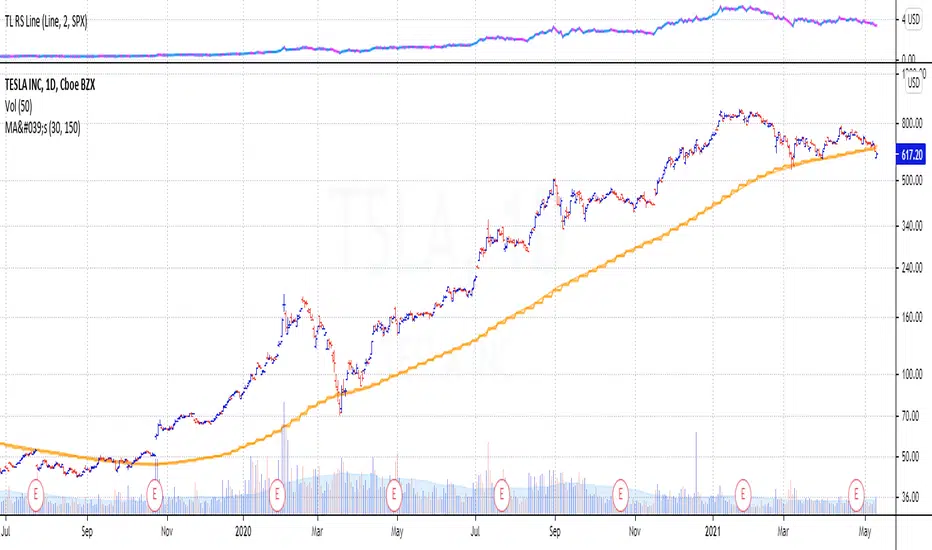
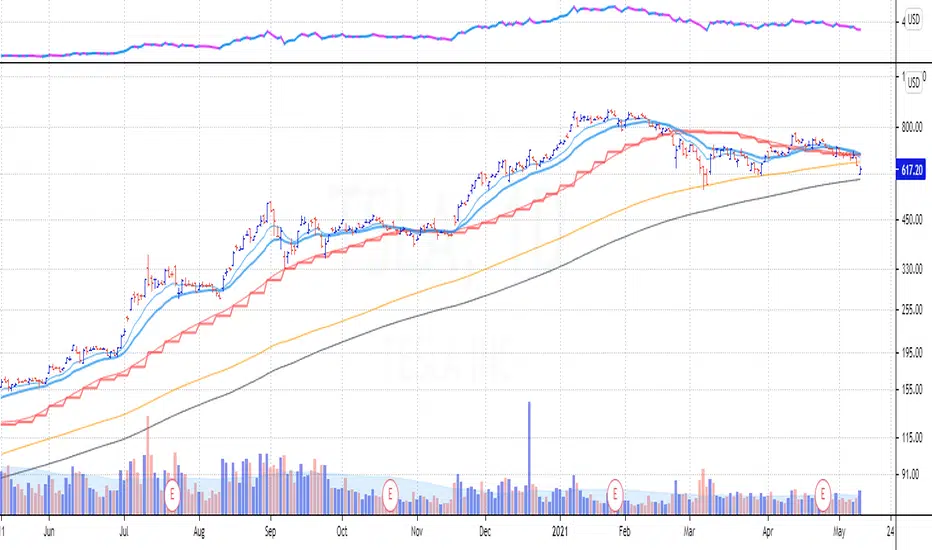
Daily and Weekly Moving Averages on Daily ChartFor the long term trend I use the 200 and 150 daily moving averages. The 200-day MA will be plotted as a black line. It is a no-go zone to buy anything trading below that.
The 150-day, or 30-week like Stan Weinstein uses, is plotted in orange.
Than I use the 50 day moving average but also the 10 week moving average. While those look similar there is a small difference which sometimes impacts the choice for selling a stock or holding on to it.
That slight difference is useful in different situations that’s why I want to have them both on my chart.
Both the 50-day and the 10-week are plotted as red lines on the chart. Since there’s only a small difference the same color gives a nicer view.
For shorter term trend I like to use the 20 and 10 day exponential moving averages. I tested these but also the commonly used 21, 9 and some other variations. But came to the conclusion that for me the 20EMA and 10EMA works best.
Both EMA’s are plotted in blue, where the 20EMA has a thicker line to easily see the difference.
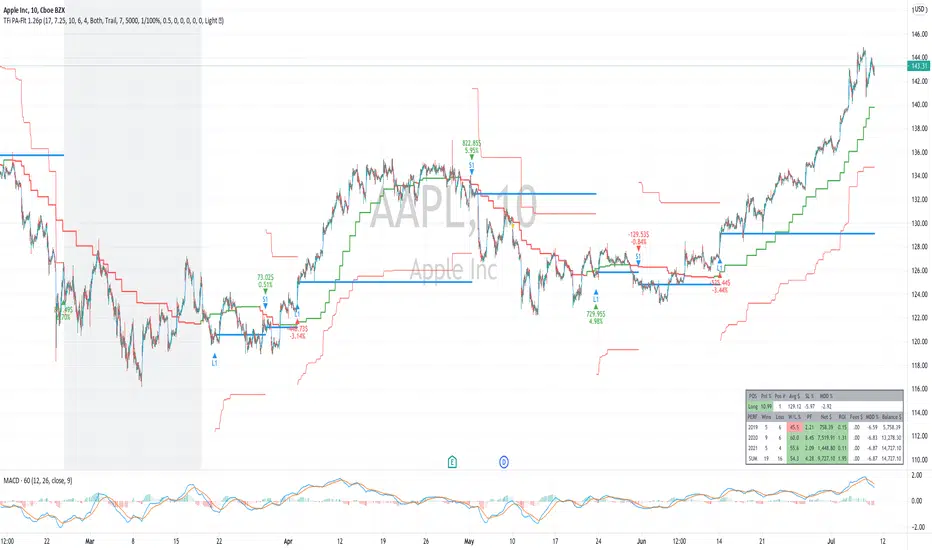
TFi Price Action Resampling Filter V1The script is resampling the price based on its range/price-action and creates an alternative filter to smoothen price movements.
Overview of features:
Optional stop-loss
Optional flags to control the position entry
Optional flags to control the position exit
Built-in backtesting engine with start balance, position size and pyramiding
Inputs for a percentage entry and exit slippage, entry/exit and daily funding fees
Configurable alerts, which follow the exact position of the entry/exit marker
Alert messages contain predefined trading instruction to execute orders via Alertatron or TradeFab's proprietary trading server
The script renders a status box at the last bar, which shows the current position status and result of the built-in trading simulation results.
It shows the following statistic values:
Current position PnL - also background turns green if position is in profit and red if in loss
Average entry price and number of positions
Current percentage distance to the optional stop-loss level
Current Maximum Draw Down
Overall number of wins and losses and the win/loss ratio
Overall profit and loss amount, paid fees
Overall profit-ratio and Maximum Draw Down
Overall balance and ROI
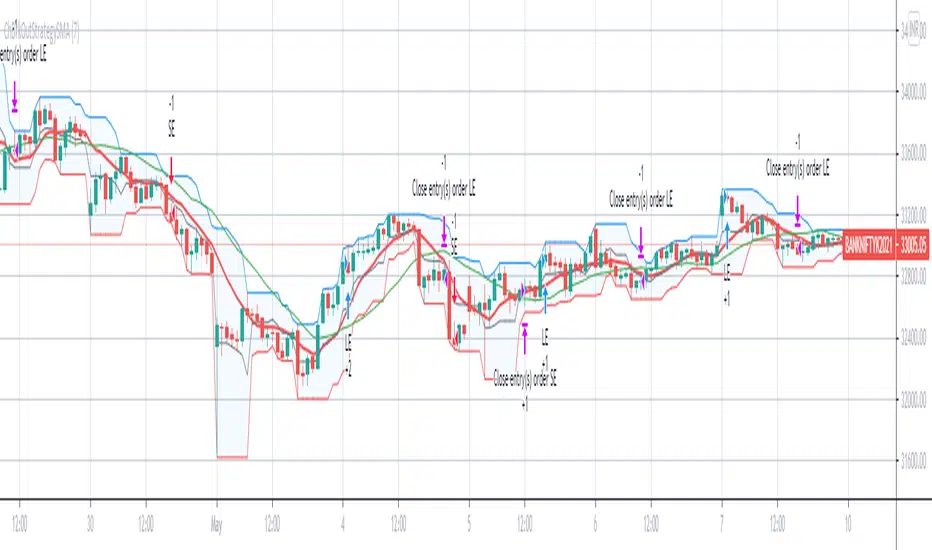
ChBrkOutStrategySMAThis script relies on channel breakout strategy and the exit condition is defined by the SMA crossover, this works well on futures and Indices
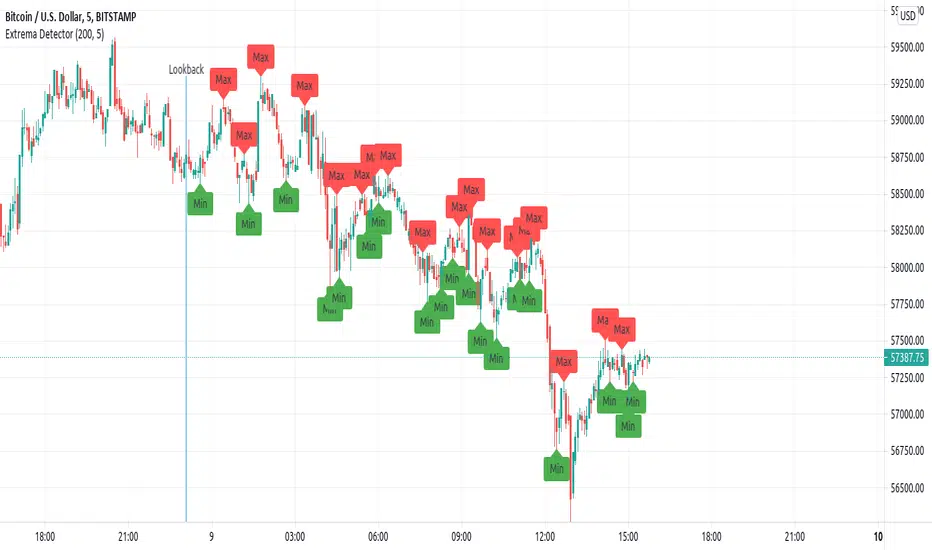
Extrema DetectorDetermines local maximums and minimums points in the chart.
Parameters:
lookback : number of candlesticks to look.
extrema_finder_sensivity : If lower, more extreme points will be found (may over-find).
Brief algorithm description:
Computes a Simple Moving Average (length= extrema_finder_sensivity ), and searches for its local extremes.
Given some SMA extreme, it looks the previous extrema_finder_sensivity candlesticks to find the highest (or lowest value).
Notes:
Is a lagged indicator: determining if the current candlestick have reach a maximum can be delayed to, at most extrema_finder_sensivity -further candlesticks.
4H Crypto RoycerThis indicator includes simple moving averages (21,50,200) and exponential moving averages (10,144) and has the ability to show this data on the chart with the approval of the user.
The indicator, which controls the intersections with the formulas it contains, can display the Golden Cross and Death Cross warnings to the user on the chart.
It draws a band on the chart with the support area calculations and in these band calculations; blends simple moving and exponential moving averages and smooths them by 1.5%.
It is used as a signal trigger in band overruns by replacing the lower and upper bands by calculation.
While one of our signal triggers is this band, our other variable is 50 simple moving averages.
Inspired by Kıvanç Özbilgiç's Supertrend indicator, the formula was updated using MA50 and 15% Stop-Loss instead of using atr multiplier.
Our chart has been tested in crypto currencies on 4 hour candles, so "4H" has been added to the beginning of the name.
We recommend using the indicator, buy / sell signals and the support band on the 4-hour charts.

EMA 8, 21 and SMA 50 from daily timeframe horizontal linesShow horizontal lines after the last point of EMA8, EMA21 and SMA50 from daily timeframe. Always shows the daily lines no matter the timeframe of your chart. It can be use as a reference in intraday time frames lower than 1 day.
Muestra líneas horizontales que continúan del último punto del EMA8, EMA21 y SMA50. Siempre muestra las líneas diarias sin importar el rango de tiempo que estés utilizando. Se puede usar como líneas de referencia para intradía.

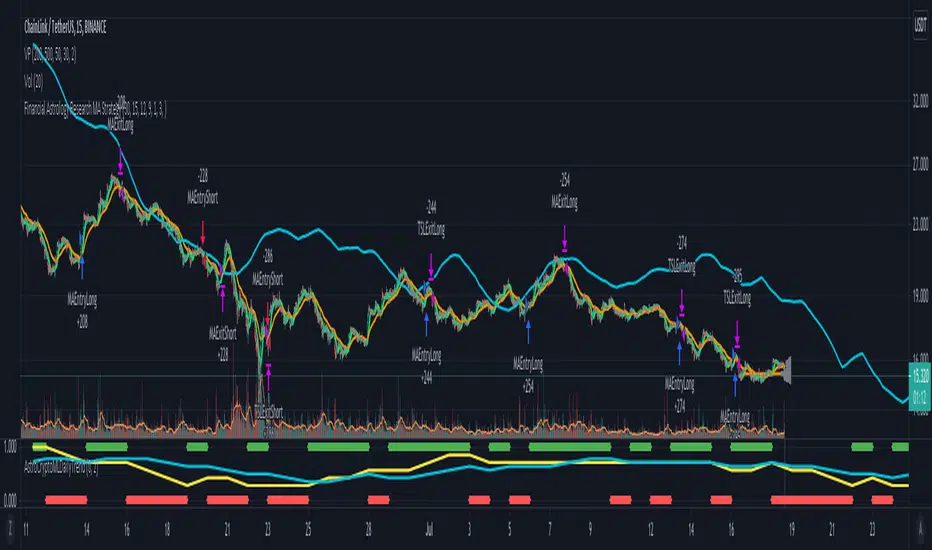
Morun Astro Trend MAs cross StrategyAstrology machine learning cycles indicator signals with technical MAs indicators strategy, based on signals index of Github project github.com
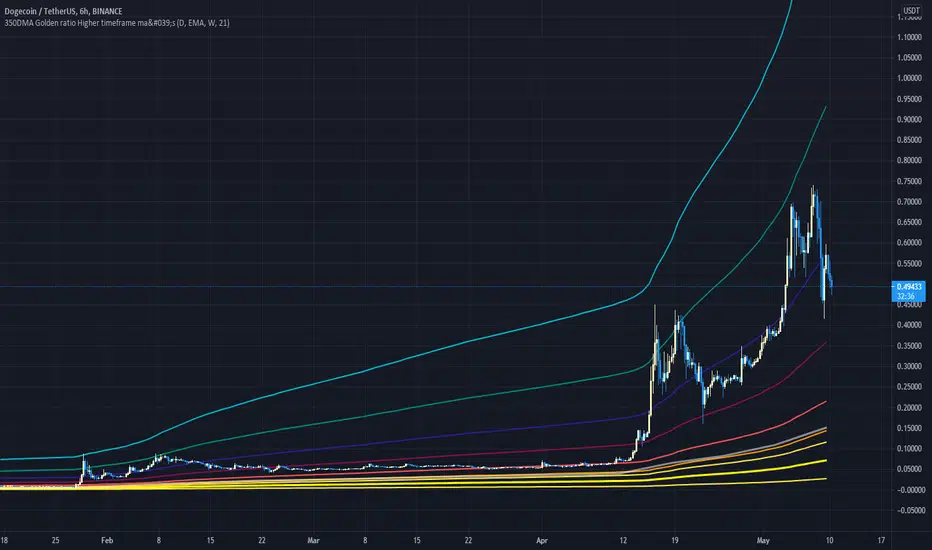
350DMA Golden ratio Higher timeframe ma'sThis Script take a 350 day moving average (bright yellow line) and multiplies it by the golden ratio 1.6... and by the Fibonacci sequence (0, 1, 2, 3, 5)
It is a great tool for finding tops and critical supports on higher timeframes.
The script also includes and higher timeframe ma (gray line) that can be set to your liking (default is 21 week).
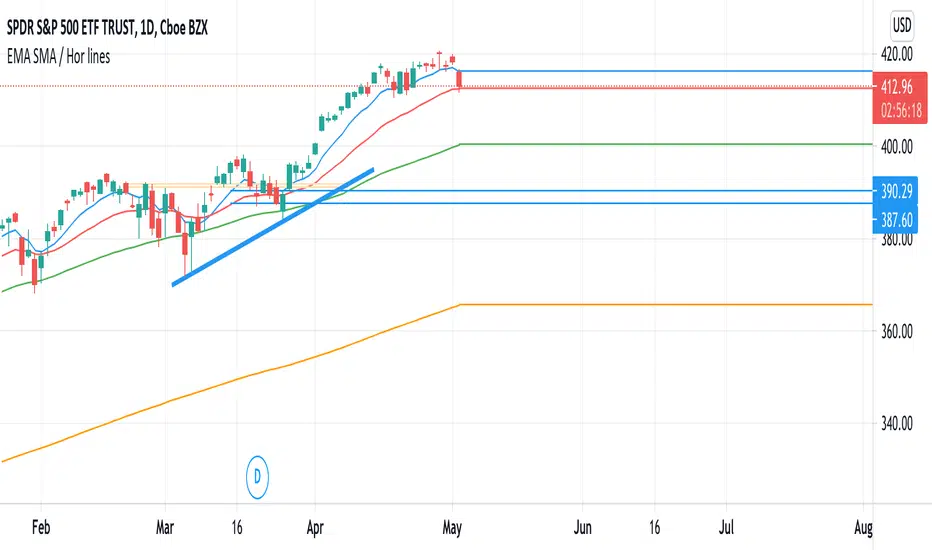
EMA 8,21 SMA 50,200 / Show horizontal linesShow horizontal lines after the last point of EMA8, EMA21, SMA50 and SMA200
Muestra líneas horizontales que continúan del último punto de la EMA8, EMA21, SMA50 y SMA200
Universal MA BandThis universal Moving Averages Band allows you to configure 2 independent MA with a tinted band between them. It is unique in that it allows you to configure each one separately: separate Resolution, Period and Type (SMA or EMA). Recommended bands for BTC:
50D SMA/EMA
100D SMA/EMA
20W SMA / 21W EMA

Fibodex TrapFibodex Trap indicator
this indicator designed by the Fibodex team
you will receive dump and bump singles buy using this indicator
also, you will receive buy and sell signals
indeed by using our indicator you won't need many technical analyses
The accuracy of the indicator with the correct settings is estimated to be more than 70%
also, we are trying to improve it to make it more accurate
notice that this indicator should be used as a secondary tool
By using this indicator, you also accept the risk of using it.
--------------------------------------------------------------------------------------------------------------------------------------------------------------------------------------------------------------------------------------------------------------------------------------------------------
اندیکاتور تله توسط مجموعه فیبودکس ایده پردازی و کد نویسی شده است.
شما با این اندیکاتور قادر خواهید بود تا سیگنال های پامپ و دامپ و همچنین خرید و فروش را دریافت نمایید.
دقت اندیکاتور با تنظیمات صحیح بیش از 70 درصد تخمین زده شده است که مجموعه فیبودکس در جهت بهبود و افزایش دقت آن تلاش خواهد کرد.
به یاد داشته باشید که از این اندیکاتور به عنوان کمکی و دریافت تاییده کمک بگیرید .
شما با استفاده از این اندیکاتور ریسک استفاده از آن را هم می پذیرید

Average Trading Range Percentage
Average high/low trading range for the current timeframe.
Daily high/low trading range.

Moving Average BandsUse this script to find buy and sell zones for BTC based on momentum of the move relative to the average asset price over a given period. The script plots a series of offset bands above and below the Simple Moving Average. When price crosses another band further from the SMA, the background is rendered brighter. The brighter the background, the stronger the buy and sell signal is, as the expectation is that price wants to return to the SMA. Settings are adjustable to fine tune to various time frames and assets. Good settings for BTC Daily are length 30, layers at 10, 20, 30, and 40.
On 1H BTC/USD I use length 200, layers at 5, 10, 15, 20 to find decent swing trading opportunities.
On BTC/USD 1D chart, combine with Bitcoin Logarithmic Growth Curve from @mabonyi (original by @quantadelic )for confluence of very reliable signals.

Bot go_up strategyHello. This strategy is based on go_up alerts.
Our task is to find the local minimum. The trade is entered on the basis of RSI and SMA according to a specific formula, which is embedded in the code. When the RSI crosses the SMA upside down, a long position is entered. You can change the length of the RSI . The longer the length, the less frequent, but more accurate the entrance, and vice versa. You can use a different time frame.
The settings have:
1) RSI length, the lower the length, the more often the entry.
2) Testing results for any period of time
3) Take profit for any percentage
4) Stop order for any percentage
5) If there is a check mark ✅, then purchases will always be made, and if not, then purchases will be made, BUT, if the next payback is lower than the previous one, it does not matter by what percentage.
6) If there is a check mark ✅, then each trace of the purchase will be made provided that it is lower by the percentage specified, even if the conditions of the purchase are triggered.
7) The filled area is made for visual display of consolidation zones
Default settings:
RSI length 15, step 1.5, take profit 15, stop order 30.
Also in the settings there is a pyramid of the order, keep this in mind. Enter a deal for a small part of the deposit, and not for all the money at once! You can remove pyramiding and see the results with one entry.
For a more visual understanding, overlay the go_up script.
You can choose a strategy for yourself based on history! If you need examples of strategies, then write to me, my contacts are in the column: instructions from the author.
Successful trades, dear friends, I am glad that you trust me!

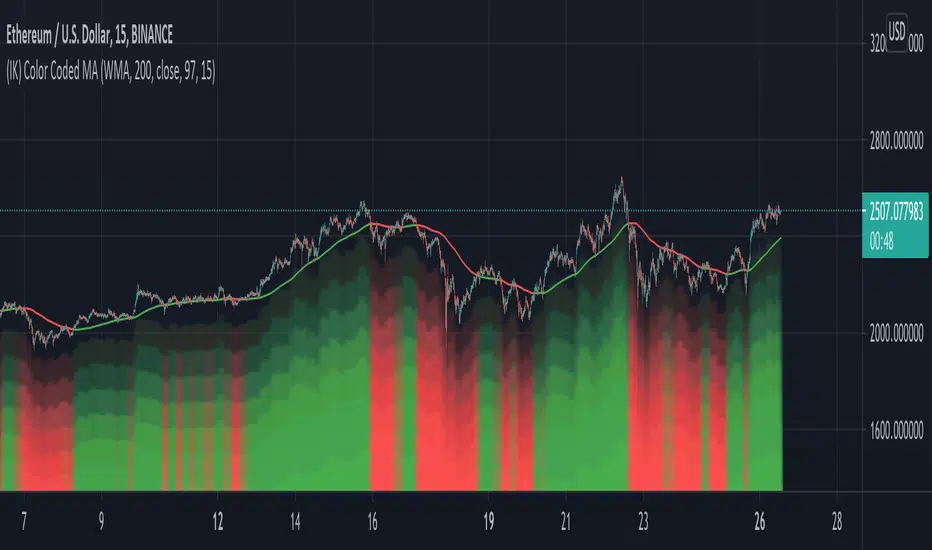
(IK) Color Coded MAJust a simple Moving Average indicator. Choose between SMA, EMA, and WMA, set the length and the source. There are 3 color indicators that represent whether price is above or below the moving average:
- the moving average line itself
- the background of the chart (optional)
- the 'underglow' of price action (optional - set 'underglow strength' to 0 to turn off)
You can customize the colors
I wasn't planning on publishing this, because, again, it doesn't really do anything special, but I've been using it for a little bit now in place of regular MAs, and I really dig the visual effect of the underglow, so I thought I'd share.
Feel free to steal/modify this.
Candle Percent Volatility by AllenlkThis indicator gives you the percentage movement of each candle. Measurements are taken between the candle High point and Low point, and also between the Open and Close and calculated in percent %. From there it smooths out the data with a moving average. This gives you an idea of how much volatility is within each candle given the time resolution of the chart.
I like to use this information as a way to turn off a strategy, or select a proper time resolution for a strategy. If each candle has less than 2.5% Volatility most strategies will typically buy and sell rapidly at prices that are too close together, potentially losing money. During those times it seems best to either temporarily turn off the strategy, change the time resolution or switch to another strategy.
