OPEN-SOURCE SCRIPT
Zaktualizowano Exponential Regression
In Tradingview it is not possible to actually display arbitrary non-linear functions retrospectively.
Series objects can only depend on the current or past bars
Thus, while regression is possible, display of a non-linear curve into the past is not possible
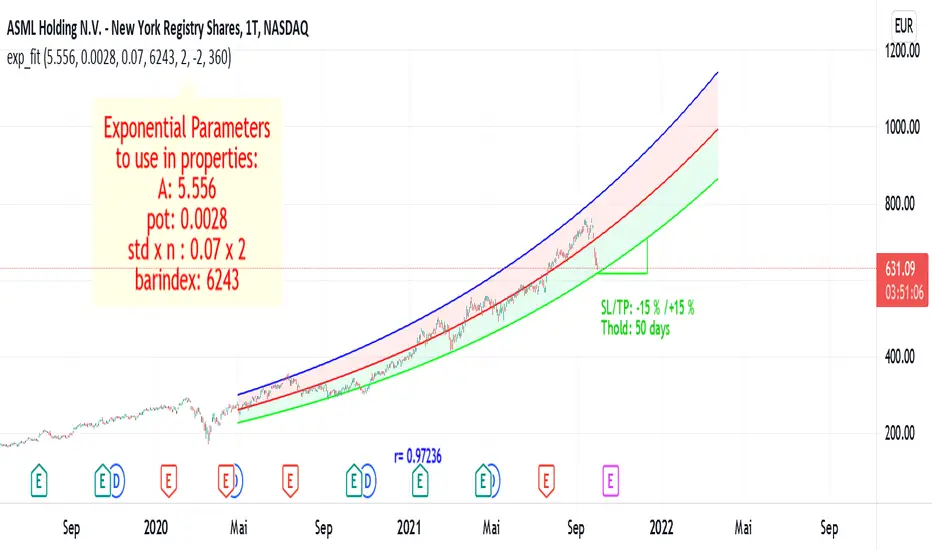
This script is a workaround to be able to still display an exponential fit of the last n bars.
It is based on a linear regression of the log(close). The parameters of this regression are printed in the label.
To create the correct plot, these parameters have to be written into the properties of the indicator.
The functions displayed follow the expression exp(A)* exp(pot*t+d)
where d =0 for the center line, and d = +-std * upperMult for the upper and lower line respectiveley.
The parameters of the function are:
This code is a version of the built-in "linear regression" script of Tradingview alztered by Forza so it can be plotted correctly on logarithmic charts
The code of Forza was further adjusted by altustro to be able to plot the full exponential curve also in regular scale
Series objects can only depend on the current or past bars
Thus, while regression is possible, display of a non-linear curve into the past is not possible
This script is a workaround to be able to still display an exponential fit of the last n bars.
It is based on a linear regression of the log(close). The parameters of this regression are printed in the label.
To create the correct plot, these parameters have to be written into the properties of the indicator.
The functions displayed follow the expression exp(A)* exp(pot*t+d)
where d =0 for the center line, and d = +-std * upperMult for the upper and lower line respectiveley.
The parameters of the function are:
- amplitude in log scale A
- exponent of the exponential function pot
- standard deviation of the linear regression std
- number of bars of the current chart bindex
- multiplicator of the std of the upper and lower exponential line upperMult and lowerMult +
This code is a version of the built-in "linear regression" script of Tradingview alztered by Forza so it can be plotted correctly on logarithmic charts
The code of Forza was further adjusted by altustro to be able to plot the full exponential curve also in regular scale
Informacje o Wersji
removed other indicators to give clear view.moved stop loss (SL) / take profit (TP) and holding time tHold a little lower for better view
Informacje o Wersji
removed other indicators in chartInformacje o Wersji
renamed and default length now 360Skrypt open-source
W zgodzie z duchem TradingView twórca tego skryptu udostępnił go jako open-source, aby użytkownicy mogli przejrzeć i zweryfikować jego działanie. Ukłony dla autora. Korzystanie jest bezpłatne, jednak ponowna publikacja kodu podlega naszym Zasadom serwisu.
Wyłączenie odpowiedzialności
Informacje i publikacje nie stanowią i nie powinny być traktowane jako porady finansowe, inwestycyjne, tradingowe ani jakiekolwiek inne rekomendacje dostarczane lub zatwierdzone przez TradingView. Więcej informacji znajduje się w Warunkach użytkowania.
Skrypt open-source
W zgodzie z duchem TradingView twórca tego skryptu udostępnił go jako open-source, aby użytkownicy mogli przejrzeć i zweryfikować jego działanie. Ukłony dla autora. Korzystanie jest bezpłatne, jednak ponowna publikacja kodu podlega naszym Zasadom serwisu.
Wyłączenie odpowiedzialności
Informacje i publikacje nie stanowią i nie powinny być traktowane jako porady finansowe, inwestycyjne, tradingowe ani jakiekolwiek inne rekomendacje dostarczane lub zatwierdzone przez TradingView. Więcej informacji znajduje się w Warunkach użytkowania.