OPEN-SOURCE SCRIPT
Zaktualizowano Squeeze Momentum Signal Overlay [GN]

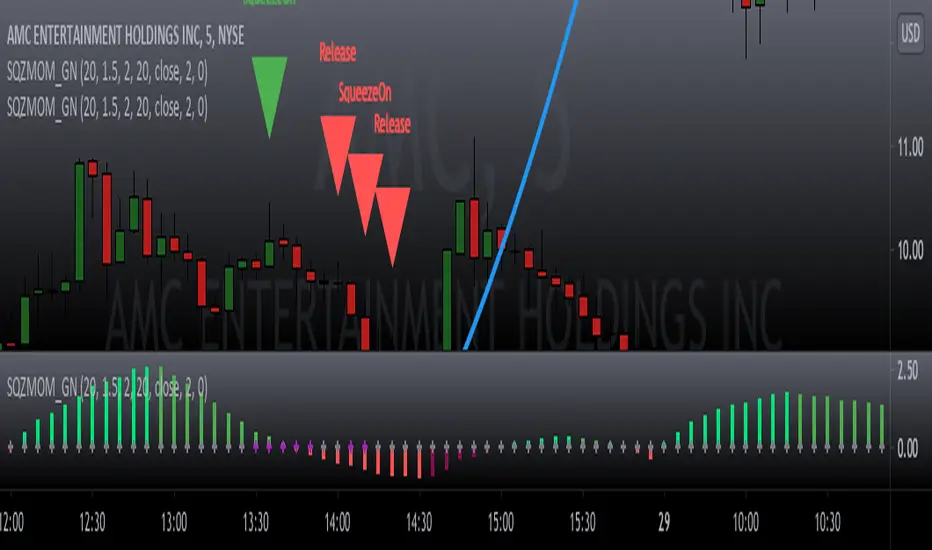
Companion script for Squeeze Momentum Indicator that plots the signal on chart.
Informacje o Wersji
Squeeze Momentum Indicator shows when Bollinger Bands squeeze into the Keltner Channel. When this condition is met, price consolidation is typically followed by a move up or down. The histogram in the indicator helps predict direction of the price action breakout. If the histogram is flipping from red to green, the signal is bullish. If the histogram is flipping from green to red, the signal is bearish.This is a companion script that overlays the squeeze signals onto a chart.
Informacje o Wersji
This script includes the direction of momentum using Red-Green triangles. A bullish signal occurs when the SqueezeOn triangle is Red and the Release triangle is Green; a bearish signal occurs when the SqueezOn triangle is Green and the Release triangle is red. Skrypt open-source
W zgodzie z duchem TradingView twórca tego skryptu udostępnił go jako open-source, aby użytkownicy mogli przejrzeć i zweryfikować jego działanie. Ukłony dla autora. Korzystanie jest bezpłatne, jednak ponowna publikacja kodu podlega naszym Zasadom serwisu.
Wyłączenie odpowiedzialności
Informacje i publikacje nie stanowią i nie powinny być traktowane jako porady finansowe, inwestycyjne, tradingowe ani jakiekolwiek inne rekomendacje dostarczane lub zatwierdzone przez TradingView. Więcej informacji znajduje się w Warunkach użytkowania.
Skrypt open-source
W zgodzie z duchem TradingView twórca tego skryptu udostępnił go jako open-source, aby użytkownicy mogli przejrzeć i zweryfikować jego działanie. Ukłony dla autora. Korzystanie jest bezpłatne, jednak ponowna publikacja kodu podlega naszym Zasadom serwisu.
Wyłączenie odpowiedzialności
Informacje i publikacje nie stanowią i nie powinny być traktowane jako porady finansowe, inwestycyjne, tradingowe ani jakiekolwiek inne rekomendacje dostarczane lub zatwierdzone przez TradingView. Więcej informacji znajduje się w Warunkach użytkowania.