VWAP TrendSignalVWAP TrendSignal
VWAP (Volume-Weighted Average Price) is the market’s true fair value — the benchmark institutions use to see when price is balanced, extended, or trending with real intent.
Price often snaps back when it moves too far (mean reversion), and only shows genuine strength when it holds above or below VWAP.
VWAP TrendSignal makes this insight effortless by color-coding VWAP direction:
Yellow = VWAP rising → bullish pressure
Red = VWAP falling → bearish pressure
No bands. No noise. Just pure directional clarity.
Anchor VWAP to the Session, Week, Month, Quarter, or Year, and tailor the Slope Smoothing Filter to your timeframe:
1–2 smoothing → fast & reactive (1–5m scalping)
3–5 smoothing → clean & stable (5–15m intraday)
6–10 smoothing → slow flips (1H–4H swings)
10–15 smoothing → macro bias only (Daily/Weekly)
The line adapts to how you trade.
How to Use It
Mean Reversion
When price stretches far from VWAP, expect pullbacks or snapbacks.
Trend Direction
Yellow supports long bias, red supports short bias.
Simple, reliable, instantly visible.
Balance Zones
Price sitting near VWAP = compression, buildup, or chop.
A perfect signal to wait or prepare for a breakout.
Why It Works
VWAP TrendSignal distills institutional logic into a clean, single-line tool.
It shows fair value, trend slope, and balance all at once — making your chart clearer and your decisions faster.
Once you get used to reading it, trading without it feels blind.
Średnia Cena Ważona Wolumenem (VWAP)

Nifty SMC S&R MA and All Indicator[SumitQuants]🇮🇳🔥 **Nifty SMC S&R + MA + VWAP + Order Flow Suite
**
Built for Indian Markets • Tuned for NIFTY, BANKNIFTY & NSE Stocks
A complete institutional-grade trading system crafted for Indian traders who want a serious edge using Smart Money Concepts, Market Structure, Support–Resistance Strength, VWAP, Breakout Logic & Trend Tools — all combined into ONE ultra-optimized indicator.
🧠 Why This Indicator Stands Out
Most indicators only show price.
This one shows intent — clear, confident, and easy to read.
It reveals:
➡ where institutions are active
➡ where liquidity is sitting
➡ where real strength is building
➡ and who is actually in control — buyers or sellers
This is how professional desks read the markets — and now you can too.
🔥 What’s Inside (Complete Feature Stack)
🟧 1. Support–Resistance Strength Engine (Buyer/Seller Strength %)
Your built-in market power meter:
🟦 Auto S/R zones
🟩 Buyer vs Seller Strength %
🟨 Strength boxes with clean visuals
🔁 Live reactions when price taps strong or weak zones
Perfect for timing entries, reversals, retests and trap-detections in NIFTY & BANKNIFTY.
🟩 2. Smart Money Concepts (Full SMC Suite)
A complete institutional SMC system:
✔ BOS / CHoCH (Internal + Swing)
✔ Market Structure in real time
✔ Internal & Swing Order Blocks
✔ Strong / Weak Highs & Lows
✔ Equal High / Equal Low (EQH/EQL)
✔ Fair Value Gaps (FVG)
✔ Trend Bias Coloring
✔ Premium / Discount Zones
Every element is built for clarity — high-quality visuals without chart clutter.
📈 3. Moving Average Suite (5 Fully Custom MAs)
Elegant MA system for trend confirmation:
✨ EMA
✨ SMA
✨ SMMA
✨ WMA
✨ VWMA
Beautiful colors, clean visibility, and completely optional — enable only what you need.
⚡ 4. Enhanced Supertrend System
A modern Supertrend built for actual usability:
🎨 3 display styles (Line / Histogram / Ghost Mode)
🔄 Clear trend-change signals
🌗 Background trend zones
⚡ No repaint
⏰ Alerts for every reversal
Ideal for intraday momentum and bias confirmation.
📉 5. Breakouts with Volume Confirmation
Stops you from getting trapped in fakeouts:
🔥 Support Break
🔥 Resistance Break
🟦 Bullish Rejection
🟥 Bearish Rejection
📈 Volume-validated breakouts
📊 Smooth visual labels for clean execution
Ultra useful for NIFTY/BANKNIFTY’s typical stophunt → reversal patterns.
🎯 6. VWAP System with Multi-Band Zones
Professional VWAP for Indian markets:
✔ Session VWAP
✔ Weekly VWAP
✔ Monthly VWAP
✔ Premium–Discount Zones
✔ Expansion vs Mean-Reversion levels
✔ Clean visual bands
Perfect for intraday scalping & morning session planning.
🔔 7. Full Alerts Framework Included
Get notified for all key institutional events:
🚨 BOS / CHoCH
🚨 Order Block Breakouts
🚨 Equal High/Low
🚨 Fair Value Gaps
🚨 Trend Changes
🚨 Breakouts
🚨 Swing / Internal Structure Events
Never miss a major shift again — even when away from charts.
🧽 8. Clean UI + Auto Watermark
🖤 Dark/Light mode optimized
🧊 Smooth spacing
✨ Minimalistic visuals
🔍 Zero chart clutter
⚡ High-performance
A premium interface built for Indian index trading.
🧪 Who Is This Built For?
✔ Intraday F&O Traders
✔ NIFTY & BANKNIFTY Scalpers
✔ Swing Traders
✔ Price Action + SMC Traders
✔ VWAP-Based Scalpers
✔ Anyone wanting a complete premium system in a single indicator
⚡ Why Indian Traders Love It
⚡ Captures Nifty morning trap zones
⚡ Predicts London session expansions
⚡ Warns about NY reversal pressure
⚡ Identifies true institutional footprints
⚡ Shows real strength behind S/R zones
⚡ Eliminates false breakouts
⚡ Gives bias, structure & context instantly
This is not just an indicator —
It’s a full institutional trading framework.
🛒 Get Full Access
This indicator is available exclusively inside the Courses section on the official website.
👉 Purchase & Access:
www.ironmindtrader.com
Inside the course:
🔧 Installation Steps
⚙️ Recommended Settings
📘 Trading Logic
🔄 Lifetime Updates Included

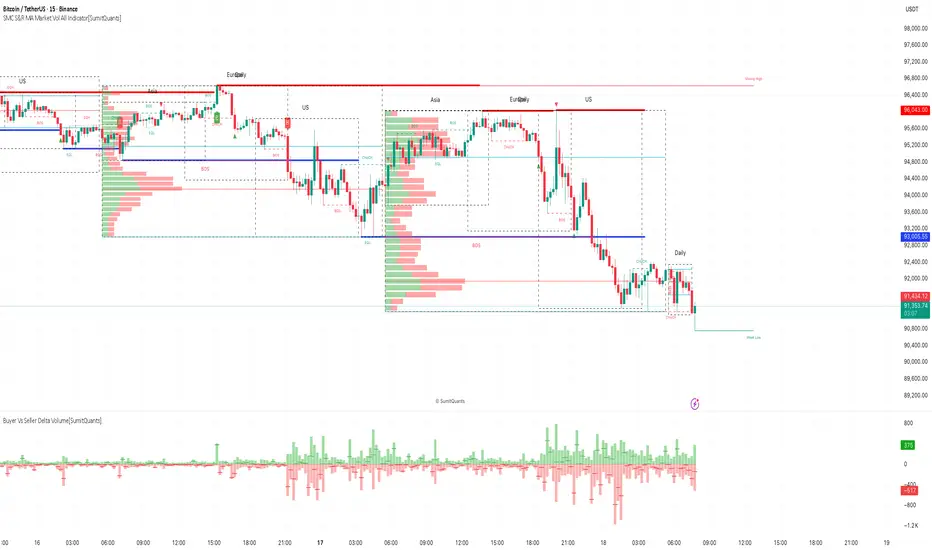
SMC S&R MA Market Vol All Indicator[SumitQuants]🚀 SMC S&R + Market Sessions + Volume Profile + Order Flow Suite
The Only All-In-One Institutional Trading System You’ll Ever Need.
Looking for an indicator that actually brings clarity to chaotic markets?
Meet the SMC S&R MA Market Volume & Sessions Order Flow System — a powerhouse that fuses Smart Money Concepts, Session Profiles, and Dynamic Volume Flow into one ultra-optimized institutional toolkit.
This is not “just another SMC indicator.”
This is your complete trading ecosystem.
💠 What This Indicator Does (In Simple Terms)
It automatically reads the market the way institutions do — and displays it cleanly on your chart with zero clutter.
Below is everything packed inside 👇
🔥 1. Market Sessions + Volume Profile (Real Institutional Map)
✔ Tokyo- Asia | London- Europe | New York- US sessions auto-detected ⏱️
✔ Each session gets its own Volume Profile 📊
✔ See POC, VAH, VAL, Value Area Box for each session
✔ Live Developing Profile in real-time
✔ Wick-based and body-volume distribution for ultra-accurate auctions
✔ Session Boxes that highlight imbalance zones
✔ Perfect for:
High-volume Asia breaks
London volatility expansion
NY reversal traps
👉 Think of it as having pro-level TPO/Volume Profile inside TradingView.
🎯 2. Advanced S&R Strength Engine (Buyer vs Seller Power Meter)
✔ Detects strongest Support & Resistance zones
✔ Measures Buyer Strength & Seller Strength (% based)
✔ Auto-plots S/R Lines + S/R Zones
✔ Detects Bounce signals, Rejection points, Pressure shifts
✔ Zero repaint logic
You get institutional footprints directly on your chart.
📈 3. Smart Money Concepts (Full Automation)
✔ BOS / CHoCH detection
✔ Internal + Swing Structure
✔ Order Blocks (Internal + Swing)
✔ Equal Highs & Equal Lows
✔ Fair Value Gaps (FVG)
✔ Strong/Weak Highs + Lows labeling
✔ Trend coloring (optional)
✔ Premium / Discount Zones
All plotted with precision.
All customizable.
All built to remove guesswork.
💹 4. Multi-MA Engine (5 Fully Configurable MAs)
✔ EMA, SMA, WMA, VWMA, SMMA
✔ Choose length, color, and source
✔ Ideal for trend confirmation + dynamic S/R
Smooth. Clean. Non-laggy.
📊 5. Enhanced Supertrend (Toggles + Filters)
✔ Switch between Line / Histogram / Hidden
✔ Optional background trend coloring
✔ Buy/Sell signals with trend-change alerts
✔ No repaint
Perfect for directional bias.
⚡ 6. Breakout Detection + Volume Confirmation
✔ Auto-detects Support/Resistance Breaks
✔ Confirms breaks through Volume Surge % Oscillator
✔ Detects:
Bullish Breaks
Bearish Breaks
Bullish Rejections
Bearish Rejections
You instantly know when a breakout is real or fake.
📍 7. VWAP System with Multi-Band Zones
✔ Session-based VWAP
✔ Bands via Std Deviation or %
✔ Clean pullback zones
✔ Perfect for intraday institutions-style precision
🧠 8. Fully Integrated Alerts
Alerts for:
✔ BOS / CHoCH (Internal + Swing)
✔ Order Block Breakouts
✔ Equal Highs / Equal Lows
✔ Fair Value Gaps
✔ S/R Zone Interactions
✔ Trend Shifts
✔ Breakouts with Volume Confirmation
✔ Supertrend Reversals
And more.
Never miss major price shifts again.
🎨 9. Clean UI + Auto-Adaptive Watermark
✔ Auto-contrast watermark
✔ Minimalistic but premium
✔ Chart-friendly colors
✔ Built to match dark or light themes
🌍 Who This Indicator Is For?
✔ Intraday traders
✔ Swing traders
✔ SMC traders
✔ Volume/Order Flow traders
✔ Forex, Crypto, Index & Stocks
✔ Anyone wanting a single all-in-one trading system
🔥 Why 90% Traders Love This System
Because it gives you:
🔥 Session Bias
🔥 Volume-backed Zones
🔥 Clean Market Structure
🔥 Trend Bias + Liquidity Areas
🔥 Institutional S/R with Strength Meter
🔥 Accurate Order Flow Reactions
Everything you need to trade like top-tier professionals — without needing 10 indicators.
🛒 Get Full Access
This premium institutional system is available as part of the Courses Section on the official website.
👉 Purchase the indicator as a Course at:
www.ironmindtrader.com
Inside the course, you'll get:
✔ Access instructions
✔ Setup guide
✔ Trading rules
✔ Updates included
Institutional Sessions Volume Order Flow [SumitQuants]Institutional Sessions Volume Order Flow
🔥 Institutional Sessions Volume Order Flow — The all-in-one Pine v6 toolkit that reveals institutional volume order blocks, session structure, VWAP bands and trend ribbon so you can trade with professional conviction.
🎯 See where smart money is active. Institutional Sessions Volume Order Flow surfaces high-volume order blocks, session boxes, VWAP bands, MA ribbon and Supertrend alerts — a single overlay that turns market noise into tradable structure. ⚡📈
✨ Key Features
📦 Institutional Volume Order Blocks: Detects bullish & bearish order blocks by aggregating volume around local highs/lows and plots filled zones with volume-percent labels.
🕒 Session Boxes & Timeline: Auto session boxes for Asia/ Europe / NewYork / Sydney with merge options, open/close lines, pip/% labels and optional candle coloring.
📉 VWAP with Bands: Multi-anchor VWAP (Session/Week/Month/Quarter/Year/Earnings/Dividends/Splits) plus up to 3 configurable bands (SD or % mode) and fills.
🧭 Moving Average Ribbon: 4-MA ribbon (SMA/EMA/SMMA/WMA/VWMA) for trend structure and dynamic S/R.
⚡ Supertrend Overlay: Optional Supertrend with conditional background fill and built-in trend-change alert hooks.
🔔 Prebuilt Alerts: Supertrend flips, session opens, session new highs/lows — ready for automation or notifications.
⚙️ Deep Customization: Colors, styles, lookback, merge behaviors, band multipliers, anchor periods, session times, label sizes, and more.
🛠 Pine v6 Optimized: Modern, overlay-ready Pine Script v6 implementation suitable for intraday and multi-timeframe use.
🧠 Why Traders Buy It
🔍 Institutional context: Volume-weighted order blocks reveal where large participants acted — crucial for high-probability trade planning.
✅ Stacked confirmation: Ribbon → VWAP → order block filters noise and aligns entries with institutional flow.
🌐 Session clarity: Quickly identify which market session is driving price and volatility.
📣 Actionable alerts: Be notified exactly when setups trigger so you don’t miss transitions.
🧩 Versatile: Great for scalpers, intraday momentum traders, swing traders, prop desks and system developers.
🚀 Quick Start (3 steps)
Add Institutional Sessions Volume Order Flow to your chart (Pine v6).
Enable Order Blocks + VWAP + Supertrend to begin.
Tune session times and band/MA settings for your instrument and timeframe. Use Supertrend + ribbon alignment + zone retest for higher-probability entries. 🎛️
🧾 Technical Notes & Compatibility
📜 Pine Script v6 — compatible with TradingView’s current scripting environment.
📌 Overlay indicator — draws directly on price chart.
🔔 Alerts use alertcondition hooks for TradingView notifications.
👤 Author: Created and maintained by SumitQuants.
⚠️ Risk Disclaimer
This tool provides context and signals — not guarantees. Backtest, paper trade, and use responsible risk management. Past performance is not indicative of future results. 📉
🛒 Call to Action (CTA)
Ready to trade with institutional clarity?
👉 Buy Institutional Sessions Volume Order Flow now — or message for a demo, custom tweaks, or a bundle including backtest/strategy code. Quick support and configuration help included. 💬
Reach out to the website and Buy This Indicator in the Courses Section www.ironmindtrader.com

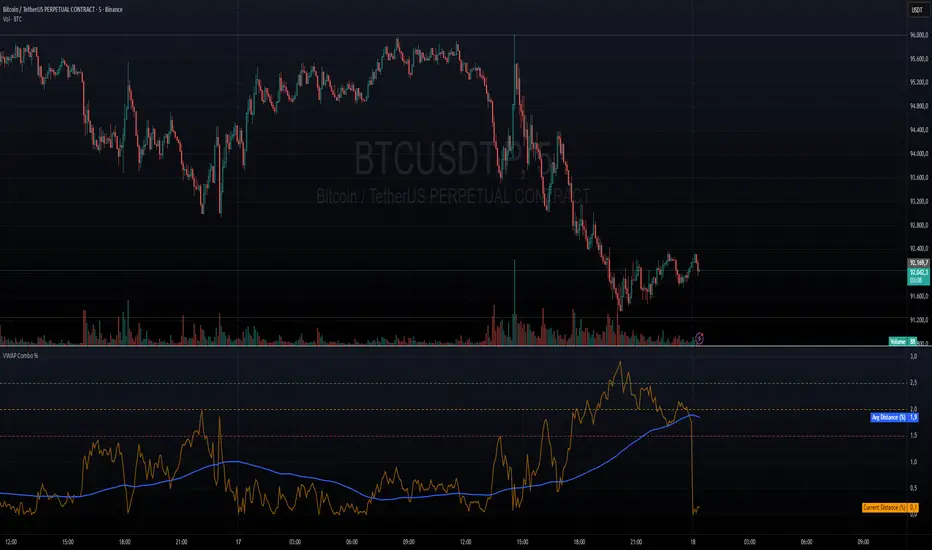
VWAP + VWAP Distance Avg + Alert Lines (%)VWAP Distance & Average Distance Indicator – Detailed Description
The VWAP + VWAP Distance Avg + Alert Lines (%) indicator is designed to measure the distance of the current price from the VWAP (Volume Weighted Average Price), as well as the average distance over a specified period. This tool is particularly useful for traders who use the VWAP as a magnet for price, helping to identify potential trend changes and areas where price may revert toward the VWAP.
Key Features
Current Distance (%)
Calculates the absolute percentage difference between the current price and the VWAP
This line shows how far the price has moved away from the VWAP at any given moment.
Average Distance (%)
Calculates a simple moving average (SMA) of the distance over a specified lookback period.
This provides a reference for typical price deviations from the VWAP, helping traders assess whether the current distance is unusually high or low.
Alert Lines (%)
Allows up to three customizable horizontal alert lines, which can be turned on or off individually.
Each line can be configured with:
Value in percent.
Color.
Line thickness.
These lines serve as visual thresholds, helping traders detect extreme deviations from the VWAP that may precede trend reversals.
Use Case – Detecting Potential Trend Changes
Traders often treat the VWAP as a price magnet, where price tends to revert after significant deviations.
When the current distance exceeds typical average levels or crosses an alert line, it can signal that the price may revert toward the VWAP, potentially indicating a shift in trend or a high-probability mean-reversion scenario.
Disclaimer
This indicator is provided for educational and analytical purposes only. It does not constitute financial advice, and trading decisions are always the sole responsibility of the individual trader. Users should carefully evaluate market conditions and their own risk tolerance before taking any trade.
Better used with VWAP on chart , and be careful around the end of session, for now this works just for session...
still improving on this....
Advanced Intraday Darvas BoxThis indicator applies a modern Darvas Box strategy for intraday traders, using non-repainting pivot detection combined with strong filters to reduce chart noise:
Confirmed swing highs and lows: Boxes only form when genuine swing pivots appear, ensuring fully non-repainting signals.
Minimum box height: Small, "noise" boxes are filtered out using ATR multiples for meaningful zones.
Trend filter: Choose EMA, SMA, or VWAP to lock boxes and breakouts to market direction.
Volume confirmation: Boxes are only confirmed when volume is above a user-defined threshold, highlighting high-participation moves.
Breakout filter: Signals trigger only if the breakout candle closes substantially beyond the box, reducing false breakouts.
Limited box display: Recent boxes only, keeping your chart clean and readable.
Features & Inputs
Pivot sensitivity: Set the number of bars for swing calculation.
Box filtering: Specify the minimum ATR multiple for box size.
Trend selection: EMA, SMA, VWAP, or None.
Volume filter & threshold: Activate for greater breakout confidence.
Breakout/Breakdown strength: Set how far price must close beyond the box to signal power.
Maximum boxes: Control the number of active boxes to keep the chart clear.
How to Add and Use
Add to Chart:
Click the “Add to Favorite Scripts” star to mark this indicator.
Open your desired intraday chart (1m–30m works best).
Click “Indicators,” search for “Advanced Intraday Darvas Box,” and add to your chart.
Customize Inputs:
Use the settings gear ⚙️ to adjust pivot sensitivity, trend logic, box filtering, and volume confirmation.
Lower minimum box height or pivot length for more frequent signals. Raise them for sparser, higher conviction setups.
Reading Darvas Boxes:
Box Edges: Horizontal lines mark resistance (top) and support (bottom) of detected zones.
Shaded regions: Highlight the most relevant trading zones and where price could coil before breakout.
Breakout labels (↑/↓): These appear only when price makes a powerful, confirmed move beyond the box edge—aligned with trend.
Alerts: Turn on chart alerts using the “Strong Bullish Breakout” or “Strong Bearish Breakdown” alert conditions for automated signal monitoring.
Best Practices:
Use Darvas boxes to complement price action analysis. Combine with candlestick patterns, volume spikes, and other price structure.
Only trade strong breakout signals confirmed by volume and market direction.
Avoid excessive boxes—adjust "Max Boxes" and filters for your instrument and timeframe.
Important
This indicator is non-repainting and built for display clarity and clean signals.
No brokerage automation, no external linking, and pure price/volume logic—fully compliant with TradingView House Rules.
Always test settings and confirmations before using for live decision-making.

Custom MTF VWAP 4x with IBI put this indicator together to have my main VWAP levels displayed on the chart easily with shaded areas when price is over extended. The IB I added to have the option to change futures based on an initial balance strategy combined with the daily and NY VWAP.

Smoothed VWAP Bands + EMAsSmoothed VWAP bands
With my script, you take the raw standard deviation and apply an EMA (exponential moving
Advantages:
1. Less noise:
* The bands don’t jump around with every tiny price spike.
* Makes it easier to judge real price extremes.
2. Better zone visualization:
* Inner and outer bands are smoother and more visually “stable.”
* Easier to see meaningful trends, support/resistance, and breakout zones.
3. Fewer fakeouts:
* Traders can filter out small false signals because smoothed bands only move when volatility actually changes.
4. Dynamic to volatility:
* EMA smoothing keeps the bands adaptive:
* In quiet periods, bands tighten.
* In volatile periods, bands expand.
* But it avoids extreme jitter caused by every micro-move.
Safe Zone Rules
1. Long entries (green zone):
* Price above VWAP (trend bullish).
* Price inside inner band ±1σ (not touching outer extremes).
* Optional: candle close confirmation (price fully above inner band).
2. Short entries (red zone):
* Price below VWAP (trend bearish).
* Price inside inner band ±1σ.
* Optional: candle close confirmation.
3. Outer bands (±2σ):
* Considered overextended zones → avoid entries to reduce fakeouts.
4. Visual cues:
* Safe zones shaded lightly green/red inside inner band.
* Outer bands remain unshaded (for context).
Here’s a cheat sheet for trading the Smoothed VWAP Bands + EMAs that shows safe entry zones and trend alignment clearly.
Smoothed VWAP Bands + EMAs Cheat Sheet
Price Action Relative to Bands & EMAs
+2σ (Outer Upper Band)
----------------
Extreme volatility zone
Avoid entries here
+1σ (Inner Upper Band)
----------------
Safe zone limit for longs
Consider profit taking here
VWAP Line (Green = Bullish, Red = Bearish)
==================
Core trend indicator
Only trade in VWAP trend direction
-1σ (Inner Lower Band)
----------------
Safe zone limit for shorts
Good for entries in trend direction
-2σ (Outer Lower Band)
----------------
Extreme volatility zone
Avoid entries here
1️⃣ Trend Direction with VWAP & EMAs
* VWAP → shows the overall session trend.
* Price above VWAP → bullish
* Price below VWAP → bearish
* EMA 5 (blue) → short-term momentum
* EMA 20 (orange) → medium-term trend
Rule: Only take trades in the direction of the trend:
* Long trades → price > VWAP and EMA 5 > EMA 20
* Short trades → price < VWAP and EMA 5 < EMA 20
This prevents chasing trades against the trend and reduces fakeouts.
2️⃣ Entry Zones Using Smoothed VWAP Bands
* Inner band (±1σ) → “safe entry zone”
* Outer band (±2σ) → volatility extremes → avoid entries here
Rule: Enter longs inside the inner band above VWAP and shorts inside the inner band below VWAP.
Best used on intraday timeframes.
15, 5, 2, 1 min charts.

Smoothed VWAP Bands🎯 Best Smoothing Setting for Scalping (What You Should Use)
Style σ Smoothing Result
Fast scalping (1min) EMA 14 Very responsive, still filters noise
Balanced intraday (1–5min) EMA 20 Best overall reliability
Slow confirmation (5–15min) EMA 30 Eliminates nearly all fakeouts
✅ What We Are Actually Smoothing
You are NOT smoothing VWAP itself.
You are smoothing the standard deviation (σ) that creates the VWAP bands:
✔ What this does:
* Computes the raw standard deviation (σ) of price relative to VWAP
* Smooths that σ using EMA smoothing
* Builds ±1 and ±2 bands using the smoothed σ
* You get clean, stable bands that filter fakeouts
✔ Result:
* Bands do NOT twitch in chop
* Fakeouts are filtered
* Real breakouts show obvious expansion

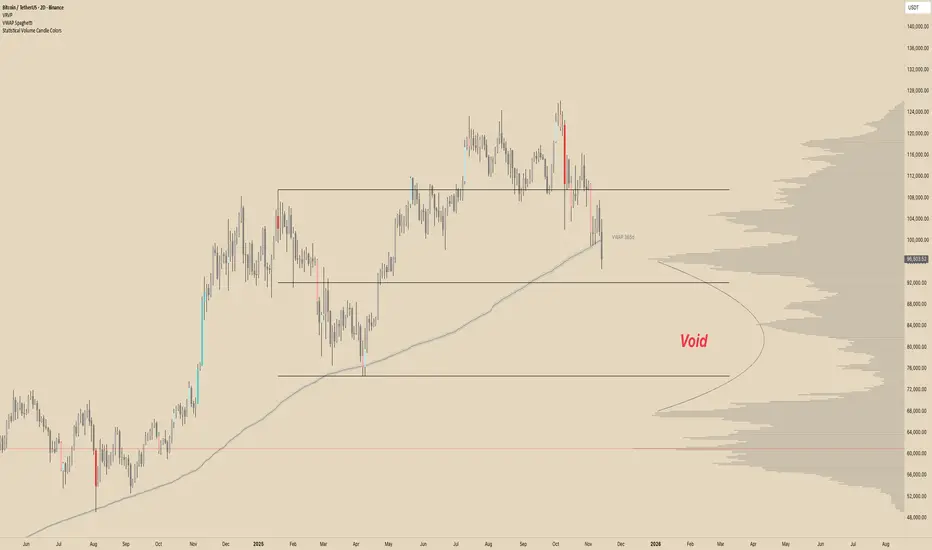
VWAP SpaghettiVWAP Spaghetti is a multi-timeframe VWAP overlay designed to show where price is trading relative to its volume-weighted “fair value” across several horizons at once.
The script plots up to five separate VWAPs (default: 30, 60, 90, 180, and 365) directly on your chart, each with its own color, bands, and labels. You can use it to see short, medium, and long-term VWAP structure in one view and quickly spot areas of support/resistance, mean-reversion zones, and where price is trading at a premium or discount.
⸻
Core Idea
• VWAP (Volume-Weighted Average Price) shows the average price paid, weighted by volume.
• This script stacks multiple rolling VWAPs together (your “spaghetti”) so you can see how price interacts with different time horizons instead of just one.
⸻
Two Modes: Candles vs. Days
• Candles mode
• Each VWAP is calculated over the last N candles on your current timeframe.
• Example: On a 1h chart with period = 30, you’re seeing a 30-candle VWAP (30hours).
• Days mode
• Treats the input as N days and automatically chooses higher timeframes (60/120/240/360 min or Daily) to keep the lines smooth and extend history.
• Great for things like “30-day VWAP” or “365-day VWAP” regardless of your chart timeframe.
• In this mode, labels add a “d” suffix (e.g., VWAP 30d).
You can switch between these with the “Timeframe Type” setting: Candles or Days.
⸻
What Each VWAP Line Includes
For each of the 5 VWAPs you can independently control:
• Period
• Default examples: 30 / 60 / 90 / 180 / 365 (candles or days, depending on mode).
• Style & Visibility
• Line color and width.
• Toggle on/off for each VWAP.
• Labels
• Optional label on the far right of the chart showing the period (e.g., VWAP 60 or VWAP 60d).
• Adjustable label size and horizontal offset.
• Percent Deviation Cloud
• Upper and lower bands at +/- X% from the VWAP (default 0.4%).
• Fills a soft “cloud” around the VWAP to visualize premium/discount zones.
• Standard Deviation Bands (optional)
• Toggle standard deviation bands on/off for each VWAP.
• Uses a volume-weighted standard deviation and a configurable multiplier (e.g., 1.0, 1.5, 2.0).
• Plots an additional cloud around the VWAP based on volatility instead of a fixed percentage.
⸻
How Traders Might Use It
• Mean reversion:
Look for price stretching far outside a VWAP cloud and snapping back toward it.
• Trend structure:
Multiple VWAPs stacked and sloping in the same direction can help visualize trend strength across different horizons.
• Dynamic support/resistance:
VWAP lines and their bands often act as reaction levels where price consolidates or reverses.
• Multi-horizon context:
See short-term and long-term “fair value” at the same time (e.g., intraday vs. 30-day vs. 365-day VWAP).
This script is meant to be visual, flexible, and simple to use: turn on the VWAPs you care about, choose Candles or Days mode, and let the “spaghetti” show you where price sits relative to volume-weighted value across time.
Multi Rolling VWAPMulti Rolling VWAP Indicator
Displays 4 volume-weighted average price (VWAP) levels on your chart:
7D VWAP - Weekly rolling average
30D VWAP - Monthly rolling average
90D VWAP - Quarterly rolling average
365D VWAP - Yearly rolling average
Each VWAP shows where the average price is, weighted by volume. Institutional traders often use these levels as support/resistance.
Optional Features:
Bands show volatility zones (Value Area High/Low)
Anchor modes: Reset weekly, monthly, quarterly, or yearly instead of rolling
Crypto volume aggregation from 15+ exchanges for accurate calculations
Clean, minimal design for white background charts.

SureTradeFX VWAP VWAP (Volume Weighted Average Price) is a volume-weighted average price over a specific period. Traders and institutions use it to see the “true” price based on both price and traded volume, not just price alone.

Multi-Session VWAP (NY, London, Asia) + HOD/LOD BandsMulti-Session VWAP (NY, London, Asia) + HOD/LOD Bands

VWAP / MA + Average Candle Size [MaximizedTrading]VWAP / MA + Average Candle Size
Bring structure and precision to your trading with the VWAP / MA + Average Candle Size indicator, a comprehensive tool that combines every major Moving Average and VWAP variation in one adaptive system. Built for traders who want flexibility, accuracy, and a clear view of market volatility, this indicator gives you full control over your preferred averaging method and visualizes dynamic ACS-based bands that adjust automatically to changing conditions.
🧠 Why I Created This Indicator
Every trader has a favorite moving average or VWAP setup, but switching between them, recalibrating settings, and adding volatility bands can be a hassle. I built this indicator to unify all those features into a single, streamlined tool. Whether you’re a scalper using anchored VWAPs or a swing trader relying on EMAs, this indicator adapts to your workflow instantly.
I also integrated the Average Candle Size (ACS) concept to bring volatility into the equation. By combining VWAP or MA with ACS-based bands, you can instantly visualize how volatile the market is — and use those bands as dynamic zones for stop-loss or take-profit placement. This way, your strategy adapts naturally to real-time market conditions instead of relying on fixed levels.
🔧 Key Features:
All-in-One VWAP & MA Selection:
Choose between VWAP, SMA, EMA, SMMA (RMA), WMA, or VWMA — all within a single indicator.
Switch seamlessly without adding multiple tools to your chart.
Full VWAP Flexibility:
Customize your VWAP with adjustable anchor points such as Session, Week, Month, or Year — ideal for both intraday and swing trading setups.
Dynamic ACS Bands:
Up to three adaptive bands are automatically calculated based on the Average Candle Size.
Each band expands or contracts with volatility, allowing you to gauge market rhythm at a glance.
Stop-Loss & Take-Profit Guidance:
Use ACS bands as natural dynamic levels — a practical way to set stop-losses or take-profits that move with volatility rather than against it.
Visual Volatility Insights:
Quickly see when the market is quiet or active. During low volatility, the bands tighten; during strong movements, they widen — making volatility visually intuitive.
Clean and Minimal Layout:
Optimized for clarity and performance. All elements are easy to toggle on or off depending on your trading style.
📸 Example!
In this example, VWAP is anchored to the session while ACS bands (×1 and ×3) dynamically expand and contract with market volatility. Notice how price often finds resistance near the outer bands — a perfect visual guide for potential take-profit or re-entry zones.
In another setup, the 50 EMA serves as the main trend filter, with ACS bands framing price movement. During quiet periods, bands stay close to price, while during volatility spikes, they widen — clearly showing changing market conditions.
💬 I am dedicated to making this indicator as practical and user-friendly as possible. Feedback is always welcome — feel free to leave a comment or suggestion for future improvements!

Order-Flow Proxy (VWAP Deviation Zones)Order-Flow Proxy (VWAP Deviation Zones) helps traders visualize when market price moves unusually far away from its Volume-Weighted Average Price (VWAP) — a key fair-value level used by institutional participants.
When price stretches too far above or below VWAP, it often signals temporary imbalance between buying and selling pressure.
This tool highlights those moments using simple color zones and an optional statistical Z-Score filter for deeper precision.
In short: it’s a clean, minimal mean-reversion indicator showing when price is statistically “too far” from fair value.
Red zone → Price extended above VWAP → possible buyer exhaustion or short setup.
Green zone → Price extended below VWAP → possible seller exhaustion or long setup.
VWAP line → Acts as a dynamic fair-value anchor.
Concept:
VWAP combines both price and traded volume to define where most transactions occurred.
Deviations from it — measured either by a fixed distance (1%) or by Z-Score — can reveal overvaluation or undervaluation zones used by professional traders for contrarian setups.
How to use:
Apply the indicator to any intraday chart (1m–1h recommended).
Watch for background color shifts — red or green.
Optionally enable the Z-Score filter to focus only on statistically extreme deviations.
Combine with volume spikes, liquidity sweeps, or your own order-flow tools for confirmation.
Tip:
Best used as a visual overlay for detecting stretched markets and potential reversals.

Smart VWAP FVG SystemSmart VWAP FVG System - Professional Multi-Filter Trading Indicator
📊 OVERVIEW
The Smart VWAP FVG System is an advanced multi-layered trading indicator that combines institutional volume analysis, multi-timeframe VWAP trend confirmation, and Fair Value Gap detection to identify high-probability trade entries. This indicator uses a sophisticated filtering mechanism where signals appear only when multiple independent confirmation criteria align simultaneously.
Recommended Timeframe: 5-minute (M5) or higher. The indicator works best on M5, M15, and M30 charts for intraday trading.
🎯 ORIGINALITY & PURPOSE
This indicator is original because it combines three distinct analytical methods into a unified decision-making system:
Market Profile Volume Analysis - Identifies institutional accumulation/distribution zones
Dual VWAP Filtering - Confirms trend direction using two independent VWAP calculations
Fair Value Gap Detection - Validates institutional interest through price inefficiency zones
The key innovation is the directional filter system: the primary Market Profile generates BUY-ONLY or SELL-ONLY states based on higher timeframe value area reversals, which then controls which signals from the main system are displayed. This creates a multi-timeframe confluence that significantly reduces false signals.
Unlike simple indicator mashups, each component serves a specific purpose:
Market Profile → Direction bias (trend filter)
Primary VWAP (Session) → Short-term trend confirmation
Secondary VWAP (Week) → Medium-term trend confirmation
FVG Detection → Institutional activity validation
🔧 HOW IT WORKS
1. Primary Market Profile Filter (Higher Timeframe)
The indicator calculates Market Profile on a higher timeframe (default: 1 hour) to determine the overall market structure:
Value Area High (VAH): Top 70% of volume distribution
Value Area Low (VAL): Bottom 70% of volume distribution
Point of Control (POC): Price level with highest volume
When price reaches VAH and reverses down → SELL-ONLY mode activated
When price reaches VAL and reverses up → BUY-ONLY mode activated
This higher timeframe filter ensures you're trading in the direction of institutional flow.
2. Dual VWAP System
Two independent VWAP calculations provide multi-timeframe trend confirmation:
Primary VWAP (Session-based): Resets daily, tracks intraday momentum
Secondary VWAP (Week-based): Resets weekly, confirms longer-term trend
Filter Logic:
BUY signals require: Price > Primary VWAP AND Price > Secondary VWAP
SELL signals require: Price < Primary VWAP AND Price < Secondary VWAP
This dual confirmation prevents counter-trend trades during ranging conditions.
3. Fair Value Gap (FVG) Detection
FVG zones identify price inefficiencies where institutional orders were executed rapidly:
Bullish FVG: Gap between candle .high and candle .low (upward imbalance)
Bearish FVG: Gap between candle .high and candle .low (downward imbalance)
The indicator monitors recent FVG formation (lookback: 50 bars) and requires:
Bullish FVG present for BUY signals
Bearish FVG present for SELL signals
FVG zones are displayed as colored boxes and automatically marked as "mitigated" when price fills the gap.
4. Main Trading Signal Logic
The secondary Market Profile (default: 1 hour) generates the actual trading signals:
BUY Signal Conditions:
Price reaches Value Area Low
Reversal pattern confirmed (minimum 1 bar)
Price > Primary VWAP
Price > Secondary VWAP (if filter enabled)
Recent Bullish FVG detected (if filter enabled)
Primary MP Filter = BUY-ONLY or NEUTRAL
SELL Signal Conditions:
Price reaches Value Area High
Reversal pattern confirmed (minimum 1 bar)
Price < Primary VWAP
Price < Secondary VWAP (if filter enabled)
Recent Bearish FVG detected (if filter enabled)
Primary MP Filter = SELL-ONLY or NEUTRAL
All conditions must be TRUE simultaneously for a signal to appear.
📈 VISUAL ELEMENTS
On Chart:
🟢 Green Triangle (▲) = BUY Signal
🔴 Red Triangle (▼) = SELL Signal
🟦 Blue horizontal lines = Value Area zones
🟡 Yellow line = Point of Control (POC)
🟩 Green boxes = Bullish FVG zones
🟥 Red boxes = Bearish FVG zones
🔵 Blue line = Primary VWAP (Session)
⚪ White line = Secondary VWAP (Week)
Info Panel (Top Right):
Real-time status display showing:
Filter Direction (BUY ONLY / SELL ONLY / NEUTRAL)
Active timeframes for both MP filters
FVG filter status and count
VWAP positions (ABOVE/BELOW)
Signal enablement status
Alert status
⚙️ KEY SETTINGS
MP/TPO Filter Settings (Primary Indicator)
MP Filter Time Frame: 60 minutes (controls directional bias)
Filter Value Area %: 70% (standard Market Profile calculation)
Filter Alert Distance: 1 bar
Filter Min Bars for Reversal: 1 bar
Filter Alert Zone Margin: 0.01 (1%)
FVG Filter Settings
Use FVG Filter: Enabled (toggle on/off)
FVG Timeframe: 60 minutes (1 hour)
FVG Filter Mode: Both (require bullish FVG for BUY, bearish for SELL)
FVG Lookback Period: 50 bars (how far back to search)
Show FVG Formation Signals: Optional visual markers
Max FVG on Chart: 50 zones
Show Mitigated FVG: Display filled gaps
Market Profile Settings
Higher Time Frame: 60 minutes (for main signals)
Percent for Value Area: 70%
Show POC Line: Enabled
Keep Old MPs: Enabled (maintain historical profiles)
Primary VWAP Filter
Use Primary VWAP Filter: Enabled
Primary VWAP Anchor Period: Session (resets daily)
Primary VWAP Source: HLC3 (typical price)
Secondary VWAP Filter
Use Secondary VWAP Filter: Enabled
Secondary VWAP Anchor Period: Week (resets weekly)
Secondary VWAP Filter Mode: Both
Secondary VWAP Line Color: White
Trading Signals
Show Trading Signals on Chart: Enabled
Show SELL Signals: Enabled
Show BUY Signals: Enabled
Alert Distance: 1 bar
Min Bars for Reversal: 1 bar
Alert Zone Margin: 0.01 (1%)
Retest Search Period: 20 bars
Min Bars Between Retests: 5 bars
Show Only Retests: Disabled
Alert Settings
Enable Trading Notifications: Enabled
VAH Reversal Alert: Enabled (SELL signals)
VAL Reversal Alert: Enabled (BUY signals)
Time Filter Settings
Filter Alerts By Time: Optional (exclude specific hours)
⚠️ IMPORTANT WARNINGS & LIMITATIONS
1. Repainting Behavior
CRITICAL: This indicator uses lookahead=barmerge.lookahead_on to access higher timeframe data immediately for FVG detection. This is necessary to provide real-time FVG zone visualization but has the following implications:
FVG zones may shift slightly until the higher timeframe candle closes
FVG detection signals are preliminary until HTF bar confirmation
The main trading signals (triangles) appear on confirmed bars and do not repaint
Best Practice: Always wait for the current timeframe bar to close before acting on signals. The filter status and FVG zones are informational but may adjust as new data arrives.
2. Minimum Timeframe
Do NOT use on timeframes below 5 minutes (M5)
Recommended: M5, M15, M30 for intraday trading
Higher timeframes (H1, H4) can also be used but will generate fewer signals
3. Multiple Filters Can Block Signals
By design, this indicator is conservative. When all filters are enabled:
Signals appear ONLY when all conditions align
You may see extended periods with no signals
This is intentional to reduce false positives
If you see no signals:
Check the Info Panel to see which filters are failing
Consider adjusting FVG lookback period
Temporarily disable FVG filter to test
Verify VWAP filters match current market trend
4. Market Profile Limitations
Market Profile requires sufficient volume data
Low-volume instruments may produce unreliable profiles
Value Areas update only on higher timeframe bar close
Works best on liquid markets (major forex pairs, indices, crypto)
📖 HOW TO USE
Step 1: Add to Chart
Apply indicator to M5 or higher timeframe chart
Ensure chart shows volume data
Use standard candles (NOT Heikin Ashi, Renko, etc.)
Step 2: Configure Settings
Primary MP Filter TF: Set to 60 (1 hour) minimum, or 240 (4 hour) for swing trading
Main MP TF: Set to 60 (1 hour) for intraday signals
FVG Timeframe: Match or exceed main MP timeframe
Leave other settings at default initially
Step 3: Understand the Info Panel
Monitor the top-right panel:
FILTER STATUS: Shows current directional bias
NEUTRAL = Both signals allowed
BUY ONLY = Only green triangles will appear
SELL ONLY = Only red triangles will appear
FVG Filter: Shows if bullish/bearish gaps detected recently
VWAP positions: Confirms trend alignment
Step 4: Take Signals
For BUY Signal (Green Triangle ▲):
Wait for green triangle to appear
Check Info Panel shows ✓ for BUY signals
Confirm current bar has closed
Enter long position
Stop loss: Below recent VAL or swing low
Target: Previous Value Area High or 1.5-2× risk
For SELL Signal (Red Triangle ▼):
Wait for red triangle to appear
Check Info Panel shows ✓ for SELL signals
Confirm current bar has closed
Enter short position
Stop loss: Above recent VAH or swing high
Target: Previous Value Area Low or 1.5-2× risk
Step 5: Risk Management
Risk per trade: Maximum 1-2% of account equity
Position sizing: Adjust based on stop loss distance
Avoid trading: During major news events or time filter periods
Multiple confirmations: Look for confluence with price action (support/resistance, trendlines)
🎓 UNDERLYING CONCEPTS
Market Profile Theory
Developed by J. Peter Steidlmayer in the 1980s, Market Profile organizes price and volume data to identify:
Value Areas: Where 70% of trading activity occurred
POC: Price level with highest acceptance (most volume)
Imbalances: When price moves away from value quickly
This indicator uses TPO (Time Price Opportunity) calculation method to build the volume profile distribution.
VWAP (Volume Weighted Average Price)
VWAP represents the average price weighted by volume, showing where institutional traders are positioned:
Price above VWAP = Bullish (institutions accumulated lower)
Price below VWAP = Bearish (institutions distributed higher)
Using dual VWAP (Session + Week) creates multi-timeframe trend alignment.
Fair Value Gaps (FVG)
Also known as "imbalance" or "inefficiency," FVG occurs when:
Price moves so rapidly that a gap forms in the candlestick structure
Indicates institutional order flow (large market orders)
Price often returns to "fill" these gaps (rebalance)
The 3-candle FVG pattern (gap between candle and candle ) is widely used in ICT (Inner Circle Trader) methodology and Smart Money Concepts.
🔍 CREDITS & CODE ATTRIBUTION
This indicator builds upon established technical analysis concepts and combines multiple methodologies:
1. Market Profile / TPO Calculation
Concept Origin: J. Peter Steidlmayer (Chicago Board of Trade, 1980s)
Code Inspiration: TradingView's public domain Market Profile examples
Modifications: Custom filtering logic for directional bias, dual timeframe implementation
2. VWAP Calculation
Concept Origin: Standard financial instrument (widely used since 1980s)
Code Base: TradingView built-in ta.vwap() function (public domain)
Modifications: Dual VWAP system with independent anchor periods, custom filtering modes
3. Fair Value Gap Detection
Concept Origin: Inner Circle Trader (ICT) / Smart Money Concepts methodology
Code Implementation: Original implementation based on 3-candle gap pattern
Features: Multi-timeframe detection, automatic mitigation tracking, visual zone display
4. Pine Script Framework
Language: Pine Script v6 (TradingView)
Built-in Functions Used:
ta.vwap() - Volume weighted average price
request.security() - Higher timeframe data access
ta.change() - Period detection
ta.cum() - Cumulative volume
time() - Timestamp functions
Note: All code is original implementation. While concepts are based on established trading methodologies, the combination, filtering logic, and execution are unique to this indicator.
📊 RECOMMENDED INSTRUMENTS
Best Performance:
Major Forex Pairs (EURUSD, GBPUSD, USDJPY)
Stock Indices (ES, NQ, SPX, DAX)
Major Cryptocurrencies (BTCUSD, ETHUSD)
Liquid Stocks (high daily volume)
Avoid:
Low-volume altcoins
Illiquid stocks
Exotic forex pairs with wide spreads
⚡ PERFORMANCE TIPS
Start Conservative: Enable all filters initially
Reduce Filters Gradually: If too few signals, disable Secondary VWAP filter first
Match Timeframes: Keep MP Filter TF and FVG TF at same value
Backtest First: Review historical performance on your preferred instrument/timeframe
Combine with Price Action: Look for support/resistance confluence
Use Time Filter: Avoid low-liquidity hours (optional setting)
🚫 WHAT THIS INDICATOR DOES NOT DO
Does not guarantee profits - No trading system is 100% accurate
Does not predict the future - Based on historical patterns
Does not replace risk management - Always use stop losses
Does not work on all instruments - Requires volume data and liquidity
Does not provide exact entry/exit prices - Signals are zones, not precise levels
Does not account for fundamentals - Purely technical analysis
📜 DISCLAIMER
This indicator is provided for educational and informational purposes only. It is not financial advice, and past performance does not guarantee future results.
Trading Risk Warning:
All trading involves risk of loss
You can lose more than your initial investment (leverage products)
Only trade with capital you can afford to lose
Always use appropriate position sizing and risk management
Consider seeking advice from a licensed financial advisor
Technical Limitations:
Indicator may repaint FVG zones until HTF bar closes
Signals are based on historical patterns that may not repeat
Market conditions change and no system works in all environments
Volume data quality varies by exchange/broker
By using this indicator, you acknowledge these risks and agree that the author bears no responsibility for trading losses.
📞 SUPPORT & UPDATES
Questions? Comment on this publication
Issues? Describe the problem with chart screenshot
Feature Requests? Suggest improvements in comments
Updates: Will be published as new versions using TradingView's update feature
📝 VERSION HISTORY
Version 1.0 (Current)
Initial public release
Multi-filter system: MP + Dual VWAP + FVG
Directional bias filter
Real-time info panel
Comprehensive alert system
Time-based filtering
Thank you for using Smart VWAP FVG System!
Happy Trading! 📈

VWAP (SIYL) Stdev Bands v2v2 indicator to allow for reversion-to-mean trading via the Stay In Your Lane approach.

Trading Blueprint v7 Pro — VWAP-CVD, cPOC Trend MomentumTBv7 Pro is the advanced release of the Trading Blueprint framework — engineered for institutional-style intraday analysis that fuses VWAP location, CVD orderflow, composite profile bias, and momentum curvature into one cohesive system.
Core Framework
VWAP Structure → Adaptive mean anchored to session VWAP with ±1σ / ±2σ deviation envelopes for dynamic equilibrium detection.
vPOC per bar by ruckard ()
Anchored Volume Profile by DGT ()
CVD Orderflow Divergence → Smoothed delta histogram with fractal pivots identifying hidden absorption and exhaustion (patterns (Bull / Bear Div). Cumulative Volume Delta by AustrianTradingMachine )
cPOC Integration (2-Day Composite) by poopsnag (me :)→ Confirms true acceptance or rejection zones across sessions for precision bias alignment.
TMI (Trend Momentum Indicator by TradingRiot()) → Quantifies slope + mean crossover strength, providing actionable momentum confirmation (bullish / bearish support / divergence).
Bias Dashboard → Displays VWAP bias, numerical score, and dynamic color feedback for at-a-glance trade orientation.
Usage Context
Designed for professionals trading 15 m execution inside 1 h / 4 h context. Ideal for VWAP-cPOC location setups, reversion / continuation scalps, and orderflow confirmation using cumulative delta behavior.
🔧 Modules such as RSI / AO are pre-wired and easily activated for full Trading Blueprint confluence mapping.

OutsiderEdge - Adaptive Node Efficiency Function (ANEF)Overview - What is ANEF?
ANEF is a zero-centered oscillator that blends price efficiency, effective volume around VWAP (node proximity), order-flow imbalance (uptick/downtick proxy), and returns volatility into a single, normalized score. The goal is to help you spot efficient breakouts and inefficient mean-reversions in a way that’s transparent, systematic, and easy to align with your own analysis.
Users can combine ANEF’s components to build rules such as: “ Only consider short breakout signals when trend context is bearish and the ANEF score pushes into the Efficient Zone ,” or “ Look for mean-reversion setups when the ANEF score sinks into the Inefficient Zone while trend context remains bullish. ”
While ANEF can stand on its own, it also works well as a secondary confirmation layer to a user’s primary process (volume profile, price action, S/R, market structure, or your preferred overlays).
🔹 FEATURES
Below is each ANEF component/feature in the order that typically leads to the most confluence.
ANEF Core (Normalized Score)
Combines a price change term with effective volume near VWAP and order-flow imbalance, scaled by volatility and normalized into a zero-centered oscillator.
Read it like a pressure gauge: high positive values = efficient upside impulse risk; deep negative values = inefficient pressure that often reverts.
Efficient & Inefficient Zones (Thresholds)
Two user-set levels (default ≥ +4.6 and ≤ −4.6) to quickly see when ANEF pushes into efficient breakout territory (top zone) or inefficient territory (bottom zone).
Thresholds are not overbought/oversold; they’re contextual “efficiency bands.”
2nd-Signal Confirmation (Optional)
An opt-in rule to ignore the first signal of a type and only print the second occurrence within X bars (default 6).
Reduces one-off noise without repainting or lookahead.
Trend Context (EMA-based Wave, Optional)
A lightweight EMA context that lets you filter signals (e.g., only show ▼ in downtrend, only show ▲ in uptrend).
The context is plotted as a sub-pane wave centered around zero so it doesn’t fight for price-panel space.
Clean Alerts (Raw & Confirmed)
Raw alerts fire at zone interactions.
Confirmed alerts respect the 2nd-signal rule and (optionally) the trend filter.
Price-Panel Markers (through force_overlay)
Even with the oscillator in a separate pane, ANEF can print mini markers on the main chart.
Useful to correlate impulses/reversions with structure, S/R, or higher-TF levels.
🔹 USAGE
In the examples below, you see chart snapshot with five labeled points of (in)efficiency breakouts.
ICMARKETS:UK100
Point 1 — Efficient Downside Breakout (▼)
ANEF surges into the Efficient Zone, indicating downside momentum that’s aligned with node volume/imbalance and volatility. Typical use: trend-following continuation, takeprofit on existing long or tightening risk on existing shorts (invalidations above recent structure).
Point 2 — Inefficient Upside Reversion (▲)
First rebound after the selloff with ANEF deep in the Inefficient Zone. Not an ideal long entry on its own, but a good management cue: take partial profits on shorts or tighten stops as an early confirmation that the drop may be exhausting.
Point 3, 4 and 5 — Inefficient Upside Reversion (▲)
Another 3x ▲ appears as price forms a higher low and ANEF prints a less extreme negative reading. With the “second-signal within X bars” option enabled, this becomes a more credible mean-reversion attempt. Possible long entries or takeprofits on existing shorts.
Trading involves substantial risk. This tool is for educational purposes only and is not financial advice. Past performance does not guarantee future results. You are solely responsible for your trading decisions and risk management.
🔹 NAVIGATING MARKET CONDITIONS
Trending phases:
Expect more time in or near the zones in the trend direction.
Consider allowing only trend-aligned signals (filter ON) and using counter zone exits for trail/partials rather than counter-trend trades.
Ranging phases:
Expect frequent dips and surges into the (In)efficient Zones and back.
Counter-moves (▲ in range downs, ▼ in range ups) can be productive with tight invalidation and the 2nd-signal rule to reduce noise.
Regime shifts:
Watch for repeated failures of one side’s signals plus cross-pane confluence (e.g., context flips while ANEF re-anchors around zero).
That sequence often marks transitions where your rules should adapt (e.g., disable the trend filter temporarily or widen your 2nd-signal window).
🔹 SETTINGS SUMMARY
ANEF Core: lengthPrice, lengthVol, lengthVolat, imbalanceCap
Zones: Efficient (≥), Inefficient (≤)
Confirmation: Require 2nd signal, Lookahead bars
Trend Filter: Enable, EMA length, optional smoothing & “only show ▲/▼ with trend”
Chart Markers: Also show on main chart (force_overlay)
Alerts: Raw vs Confirmed (pick what suits your workflow)
🔹 GOOD PRACTICES
Treat signals as context cues, not as mechanical buy/sell calls. You can align ANEF with structure (S/R, HTF bias, LVN, HVN or POC) and risk management (partials on zone exit, invalidation beyond recent swing). Start with defaults; tweak parameters to match your market/TF.
🔹 LIMITATIONS / DISCLAIMER
ANEF does not use lookahead and does not repaint, but no indicator guarantees outcomes.
Thresholds are heuristics; markets can remain efficient/inefficient longer than expected.
Use appropriate position sizing and independent validation.
Trading involves substantial risk. This tool is for educational purposes only and is not financial advice. Past performance does not guarantee future results. You are solely responsible for your trading decisions and risk management.
Release Notes
v1.0 — Initial invite-only release with: normalized ANEF core, Efficient/Inefficient zones, optional EMA trend context, 2nd-signal confirmation, raw & confirmed alerts, and optional price-panel markers via force_overlay.

QuantumFlowTraderQuantumFlowTrader
Adaptive Flow Visualizer with Multi-ATR Volatility Engine and Multi-EMA Clouds
Overview
QuantumFlowTrader is an adaptive market flow visualizer that integrates multiple EMA clouds, a session VWAP framework, and a tested multi-ATR volatility engine.
It is built to help traders interpret directional strength, institutional balance, and volatility synchronization across any asset and timeframe available on TradingView.
How It Works
1. Multi-EMA Clouds — Trend Structure and Flow Context
QuantumFlowTrader employs several EMA-based cloud layers to represent short-, medium-, and long-term structure simultaneously.
Each cloud adapts dynamically to price movement, revealing trend alignment and momentum stacking across depths of the market.
When all EMA clouds align in the same direction, the color gradient intensifies (green for bullish, red for bearish).
When structure conflicts, transparency increases, signaling mixed or transitional phases.
This multi-cloud approach allows traders to see structure, flow, and trend shifts at a glance, eliminating guesswork and highlighting transitions between trend and consolidation.
2. Session VWAP — Institutional Equilibrium and Reaction Zones
The Session VWAP represents the real-time mean price that institutional participants often reference.
QuantumFlowTrader enhances it with tested adaptive deviation envelopes, which highlight zones where price frequently reacts or pauses.
These deviation zones dynamically expand or contract with volatility, defining institutional fair-value regions and potential continuation or mean-reversion boundaries.
VWAP color automatically changes based on whether price trades above or below the equilibrium, giving immediate visual feedback on session bias.
3. QuantumFlow ATR Engine — Core Innovation
At the heart of QuantumFlowTrader is its proprietary multi-ATR engine, a deeply tested system that runs multiple ATR calculations and deviation layers at the same time.
Unlike single-metric approaches, this composite engine merges several ATRs with different sensitivities and deviations to identify synchronized volatility alignment.
When all ATR layers align bullish, a green up-arrow appears below the bar.
When all align bearish, a red down-arrow appears above the bar.
This configuration has been tested for many years across market types and volatility regimes.
Its goal is to detect moments when price action, volatility, and structure converge, which historically coincide with the start or continuation of strong directional flows.
This multi-ATR architecture is what makes QuantumFlowTrader genuinely unique among volatility-based systems.
Adaptability Across Assets and Timeframes
QuantumFlowTrader is universally adaptable:
Works effectively on any timeframe, from scalping to swing or position trading.
Performs consistently across Forex, Stocks, Indices, Commodities, and Crypto.
The internal algorithms automatically adjust their sensitivity and scaling to the selected chart’s behavior, ensuring smooth adaptation to different volatility environments.
This makes it suitable for traders who want a consistent analytical framework adaptable to both short-term and long-term contexts.
Customization and Alerts
EMA Clouds: adjust colors, transparency, and visibility for each structural layer.
VWAP Zones: toggle the equilibrium line and deviation visualization.
ATR Arrows: control arrow appearance and size for bullish/bearish events.
Dynamic Scaling: built-in adaptive multiplier auto-balances volatility response.
Built-in alerts:
Buy Condition: all ATR layers bullish and price above VWAP.
Sell Condition: all ATR layers bearish and price below VWAP.
These alerts identify situations where both directional flow and volatility alignment agree.
Originality and Value
QuantumFlowTrader is not a mash-up of public indicators.
Its originality lies in how it integrates:
Multiple EMA clouds for layered structural analysis.
Session VWAP with adaptive deviation zones to reveal institutional equilibrium and price reactions.
A proprietary multi-ATR engine that combines several ATR and deviation configurations simultaneously for volatility confirmation.
Together, these systems produce a unified, adaptive visualization of market structure, volatility, and flow — helping traders stay aligned with dynamic directional conditions while filtering out low-efficiency noise.
Example — Multi-Timeframe Integration (Optional Use)
While QuantumFlowTrader works effectively on any single chart, many traders use a three-screen workflow to synchronize trend, momentum, and execution:
1 Screen: 15-minute, Defines dominant trend direction (multi-EMA cloud + VWAP bias).
2 Screen: 5-minute, Confirms flow alignment and momentum coherence.
3 Screen: 1-minute, Executes entries when ATR arrows appear in the same direction as the 15-minute trend.
Example workflow:
1. Identify overall direction from 15m cloud and VWAP structure.
2. Wait for 5m confirmation.
3. Time entries on 1m using ATR arrows aligned with the higher timeframe.
This structure enhances precision and reduces counter-trend exposure.
Best Practices and Limitations
Always use proper risk management and forward testing before applying live.
Author’s Instructions:
To request access, please contact the author through the TradingView profile.

VWAP Reversion (Sequential Stats + Profit/Loss Points)First time posting. This is my attempt to evaluate the effectiveness of VWAP reversion. I decided to make this an indicator with its own integrated stats.
If you set the session length to lets say 100, but choose a 1 minute timeframe, it will only load as many sessions as the chart will allow for that timeframe. increasing the timeframe will allow you to go back further with more sessions.
I plan to implement more and more as I refine it. I just wanted to get my working copy out into the universe. I'd like to add some method of "scaling in". Perhaps if the price goes further and further away from the original entry, say for each additional std. deviation band further, it could add another entry signal.
My trading journey is just beginning, I've never coded before, and this was made entirely through the fusion of my attempt to communicate the ideas in my head for ChatGPT to turn into code!

Rolling VWAP Indicator🧭 Rolling VWAP Indicator
Overview
The Rolling VWAP Signals indicator offers a clean, real-time view of price behavior relative to its volume-weighted fair value.
It extends the traditional VWAP concept by introducing a Rolling VWAP that continuously adapts over a dynamic window of recent bars, allowing traders to visualize evolving equilibrium zones without being limited to daily or session resets.
Additionally, it includes a Multi-Timeframe (MTF) Trend Bias Filter — designed not to recalculate VWAP across timeframes, but to confirm directional alignment with higher-timeframe momentum. This ensures that short-term signals are traded only when the broader bias agrees, reducing false reversals and improving signal quality.
VWAP vs Rolling VWAP
The Volume-Weighted Average Price (VWAP) is one of the most widely used institutional benchmarks.
It represents the average traded price weighted by volume — effectively the market’s “fair value.”
However, standard VWAP resets each day or session, losing continuity across time and ignoring cumulative order flow beyond that session.
The Rolling VWAP used here continuously recalculates over a moving window of the most recent bars:
• It adapts naturally to 24×7 markets such as crypto and indices.
• It reflects the current consensus of price and volume rather than starting from zero each morning.
• It acts as a dynamic fair-value magnet, showing when price deviates too far from equilibrium.
In short:
• Standard VWAP → resets daily, suited for intraday benchmarks.
• Rolling VWAP → continuous measure of short-term market balance and sentiment.
How It Works
1. Rolling VWAP Calculation
Uses the last N bars (auto-adjusted by timeframe: e.g., 288 for 5-min, 96 for 15-min, 24 for 1-hour) to compute the continuously weighted mean price:
RVWAP = \frac{\sum(Price \times Volume)}{\sum(Volume)}
2. VWAP Bands
Three deviation envelopes are plotted above and below RVWAP at user-defined percentages — visual zones of overbought/oversold or expansion/compression.
3. Signal Logic
• Buy Signal: price closes above the Rolling VWAP after being below (bullish reclaim).
• Sell Signal: price closes below the Rolling VWAP after being above (bearish rejection).
• Cooldown Period: blocks repeated signals within a set bar interval to avoid whipsaws.
4. MTF Trend Bias
• Pulls higher-timeframe trend direction (e.g., from 1-hour while trading 5-min).
• Signals are confirmed only when short-term cross aligns with higher-timeframe bias.
• This filter does not modify or recalculate the VWAP — it purely acts as a directional validator.
5. Session Filter
Restrict signal generation to defined trading hours and timezone (e.g., 09:30–13:00 NY). Its for US market positional traders.
6. Dashboard Panel
Displays system states: data sufficiency, session activity, VWAP bias, cooldown status, and Buy/Sell signal triggers.
Why It’s Useful
• Provides a real-time adaptive fair-value anchor instead of static daily VWAP.
• Highlights both trend continuation and mean-reversion zones.
• Integrates MTF bias confirmation to trade only in line with higher-timeframe flow.
• Eliminates clutter — no oscillators or complex models, just price vs volume behavior.
How to Use
1. Apply on any timeframe (5M–4H).
2. Observe Buy (green) and Sell (red) signals relative to the blue Rolling VWAP line.
3. Enable MTF Trend Bias to confirm signals with higher-timeframe direction.
4. Use deviation bands for identifying overextended conditions or pullback opportunities.
5. Monitor the dashboard for live system feedback.
Customization
• Auto or manual Rolling VWAP window.
• Adjustable band multipliers.
• MTF bias confirmation toggle.
• Session and timezone settings.
• Dashboard size and placement.
Conceptual Takeaway
The Rolling VWAP Simple Signals indicator combines the strength of volume-weighted mean reversion with higher-timeframe directional filtering, producing clear, context-aware entries and exits.
It answers two critical trader questions:
“Where is the real, volume-based fair value right now?”
“Does my signal align with the larger trend?”
⚠️ Disclaimer
This indicator is designed s olely for educational and analytical purposes . It does not constitute financial advice, investment recommendation, or trading signal service. Trading involves substantial risk and may not be suitable for all investors. Always perform your own analysis and use proper risk management before taking any trade. The author assumes no liability for financial losses resulting from the use or interpretation of this tool.

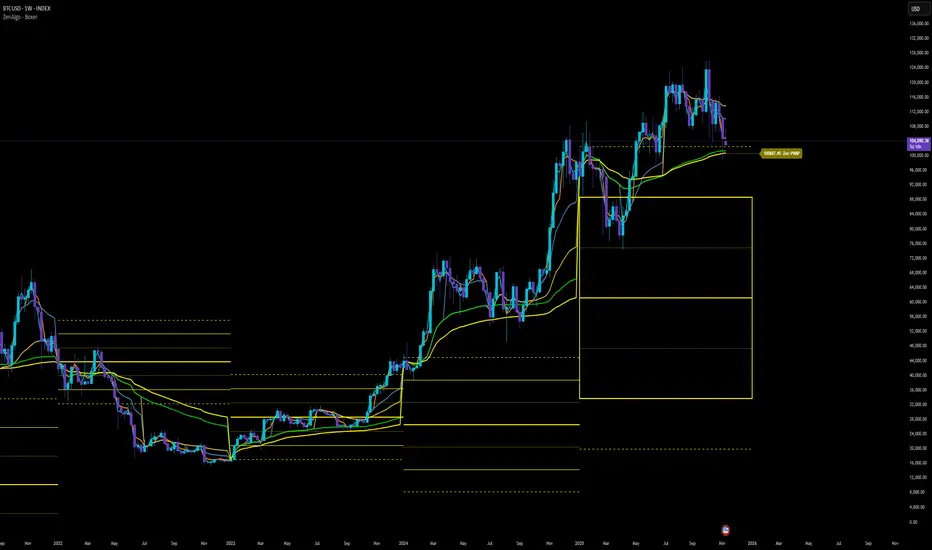
ZenAlgo - BoxerThis indicator plots multi-period Volume-Weighted Average Price (VWAP) ranges and deviation bands across several timeframes — specifically weekly, monthly, quarterly, semi-annual, and yearly. It is designed to visualize how price evolves relative to statistically weighted value areas within each period, based on both traded price and volume distribution.
Each timeframe layer is drawn independently, using its own cumulative VWAP and standard deviation calculation, and displayed as horizontal ranges aligned precisely with calendar periods. This structure allows the chart to show where price currently trades relative to past value zones and how each higher-timeframe VWAP acts as a dynamic reference for mean reversion or continuation.
Calculation Logic
1. Source and Base Inputs
The indicator uses the average of high, low, and close as its price source.
Stocks reset daily at session open.
2. VWAP and Deviation Computation
For each active timeframe, it accumulates the product of price and volume and divides it by cumulative volume, forming a continuously updated VWAP within that period.
The dispersion of price around VWAP is measured through a volume-weighted variance, converted to standard deviation.
These values form symmetrical bands around the VWAP (±1σ, ±2σ, etc.), describing the statistically typical price spread.
3. Range Drawing and Persistence
When a new period begins (e.g., a new week or month), the script finalizes the previous VWAP and deviation values, fixes them to time coordinates representing the full duration of that completed period, and draws corresponding lines or boxes across the entire range.
The user can control how many historical periods remain visible, ensuring performance and clarity even on high-frequency charts.
Each band can be toggled independently (for example ±1, ±2, ±3 deviations), and colors are adjustable per timeframe.
4. Adaptive Time Anchors
The start of each timeframe is aligned with calendar boundaries.
For stocks, the start time aligns with 9:30 New York time to coincide with market open for NYSE.
Each new anchor triggers a reset of cumulative data and creation of a new VWAP range.
5. Visualization Structure
The weekly layer is drawn first and can optionally display live VWAP bands extending backward for a user-defined number of weeks.
Monthly, quarterly, semi-annual, and yearly layers use the same computation principle but with independent accumulation windows.
The central VWAP line is dashed, while outer deviation levels are drawn as dotted or solid lines depending on their multiplier.
Boxes are rendered for key deviation intervals (e.g., ±2σ) to highlight broader value zones.
Interpretation
The VWAP represents the mean price weighted by traded volume for the given period.
Deviation bands describe statistically typical distance from that mean; outer bands mark less frequent extremes.
When price remains within ±1σ or ±2σ, it suggests balance around fair value.
Repeated touches or breaks beyond outer deviations indicate expansion or compression of volatility relative to prior periods.
Overlaps of VWAPs from multiple timeframes reveal multi-period confluence zones, useful for observing where long-term and short-term value agree or diverge.
Recommended Timeframes by Range Type
Weekly Range
Recommended timeframe: 30m to 12h
Suggested options: 30m, 1h, 2h, 3h, 4h, 6h, 8h, 12h
Using lower timeframes (like 5m) is technically possible, but higher ones provide smoother visualization and better readability.
Monthly Range
Recommended timeframe: 1h to 1D
Suggested options: 1h, 2h, 3h, 4h, 6h, 8h, 12h, 1D
Lower timeframes such as 30m may not display the full monthly range due to TradingView’s bar limits, so use higher TFs for complete coverage.
Quarterly Range
Recommended timeframe: 4h to 1W
Suggested options: 4h, 6h, 8h, 12h, 1D, 1W
Quarterly ranges benefit from higher timeframes to ensure that enough historical data is visible without exceeding chart limits.
Semi-Annual Range
Recommended timeframe: 12h to 1M
Suggested options: 12h, 1D, 1W, 1M
Lower timeframes would require too many bars to load a full six-month range; higher TFs offer a clearer overview.
Yearly Range
Recommended timeframe: 1D to 1M or higher
Suggested options: 1D, 1W, 1M
Yearly ranges often cannot display correctly on low timeframes (e.g. 1h) because of TradingView’s maximum bar limits — for instance, five years of 1h data exceeds 40,000 bars. Use higher TFs for accurate rendering.
Added Value Compared to Common Free VWAP Indicators
Incorporates five independent timeframes simultaneously (week, month, quarter, half-year, year) with exact calendar anchoring and timezone handling.
Calculates volume-weighted deviation for each layer, maintaining consistent statistical scale across assets.
Provides historical box persistence , allowing comparison of completed VWAP structures instead of only current running lines.
Enables selective visibility, bandwidth control, and precise visual differentiation through adjustable colors and line weights.
Limitations and Notes
The indicator does not generate trading signals. It is purely analytical and descriptive.
On very low timeframes or illiquid assets, deviation values may fluctuate if volume data is inconsistent.
Historical boxes are approximate in length for months with fewer than 31 days; this simplification has negligible effect on interpretation.
High visual density may occur when enabling many deviations or timeframes at once; users should limit visible history for performance.
Best Usage Practices
Apply on intraday charts (5–240 min) to study how price interacts with weekly or higher-timeframe VWAP zones.
Observe convergence of VWAPs from multiple periods to locate significant equilibrium levels.
Use outer deviations to frame potential exhaustion or re-entry zones rather than directional predictions.
Combine with independent volume- or structure-based analysis for context.