MA-EMA Crossover LTJust a simple strategy based on dynamic zones by Allenster. Still a work in progress.
Trendfollowing
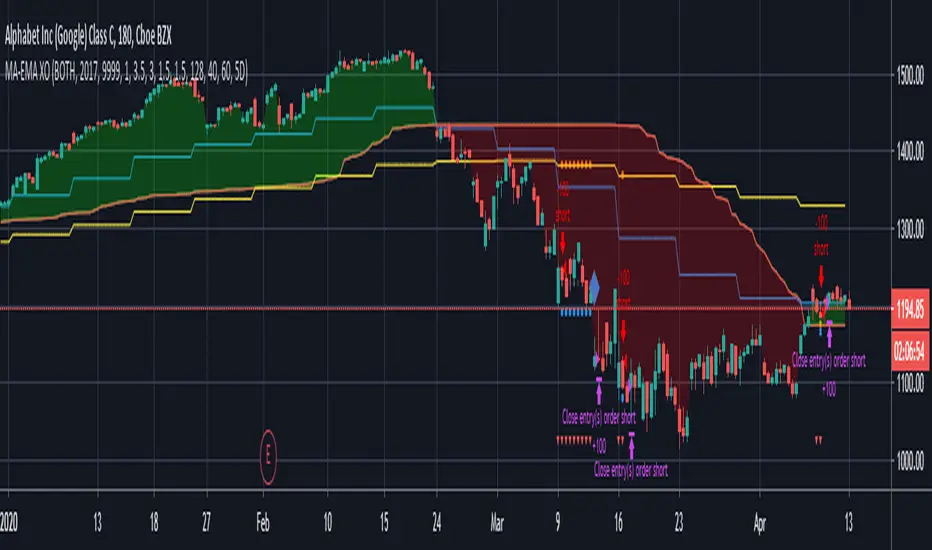
ScalpyScalpy is made up of a 2 main parts.
- The cloud comprising of a 10 period SMA and a 30 period SMA.
- When the cloud is green you should be looking for long entries.
- When the cloud is red you should be looking for short entries.
- Price is most bullish above a green cloud and most bearish below a red cloud.
- Being within the cloud indicates indecision.
The blue and white lines on the indicator show the relationship between price and momentum.
They can be used to spot reversals in two ways:
- The first is a divergence between price (blue line) and RSI (white line)
- If the price makes a lower low but the RSI makes a higher low this shows the trend is weakening and may be reversing soon (as can be seen by the two yellow lines on the chart).
The second is a simple crossover:
- When the white line crosses the blue line to the upside this signals a long entry.
- When the white line crosses the blue line to the downside this signals a short entry.

ViPro Trend v3.0This indicator is based on few combination of indicators as listed below:
a. volume indicator
b. ATR indicator (Supertrend)
Two signal will be shown in the chart i.e. cross sign as uptrend and circle sign as down trend.
How the indicator works?
a. It filters candles below 2 supertrend lines and shows the cross or circle sign as output
b. The volume filter also included where it filter the cross and circle sign based on the rise of the volume.
The trend factors and no of candles for volume can be adjusted in the user interface.
This indicator repaints, so long or short position should be based on the signal on second candle.
Please share your comments as message directly to me, thanks.

Trend Following MAs 3DHello All,
This is Moving Averages Trend Following 3D indicator. The idea is based on direction of MAs and relation between 20 moving averages (5 to 100 period).
Option to show different type of MAs: EMA, SMA, RMA, WMA, VWMA.
As I haved tested it looks succesful at calculating trend direction and trend strength.
For a better look I tried to make it 3D, it looks good I think, waiting comments ;)
Some screenshots:
By using RMA type:
When it gets tiny it means there is no trend:
An example for down trend:
ENJOY!

Trend Lines for RSI, CCI, Momentum, OBVHello Traders!
After publishing Trend Lines for RSI yesterday, I realized that Trend Lines for more indicators needed by the traders. so I decided to make it for four different indicators: RSI, CCI, OBV, Momentum
In the indicator options you can choose the indicator from pull-down menu.
How it works?
- On each bar it finds last 10 higher and lower Pivot Points (PP) for the indicator.
- from first bar to 10. Pivot Point it searchs if a trend line is possible
- for each PP it starts searching from the last PP .
- it checks if drawing a trend line possible or not and also it's broken or not
- if it's broken then optionally it shows broken trend lines as dotted (or you can option not to see broken lines)
- if it finds a continues trend line then it stops searhing more and draw trend line, this is done by checking angles (I did this to make the script faster, otherwise you may get error because of it needs time more than .2sec)
- the script makes this process for each PP
- then shows the trend lines
P.S. it may need 3-10 seconds when you added the script to the chart at first (because of calculations)
Trend lines for CCI:
Trend Lines for OBV
Trend Lines for Momentum:
You may want to watch how Trend Lines script works (that was made for RSI)
s3.tradingview.com
If you still didn't see Trend Lines v2 then visit:
All Comments are welcome..
Enjoy!

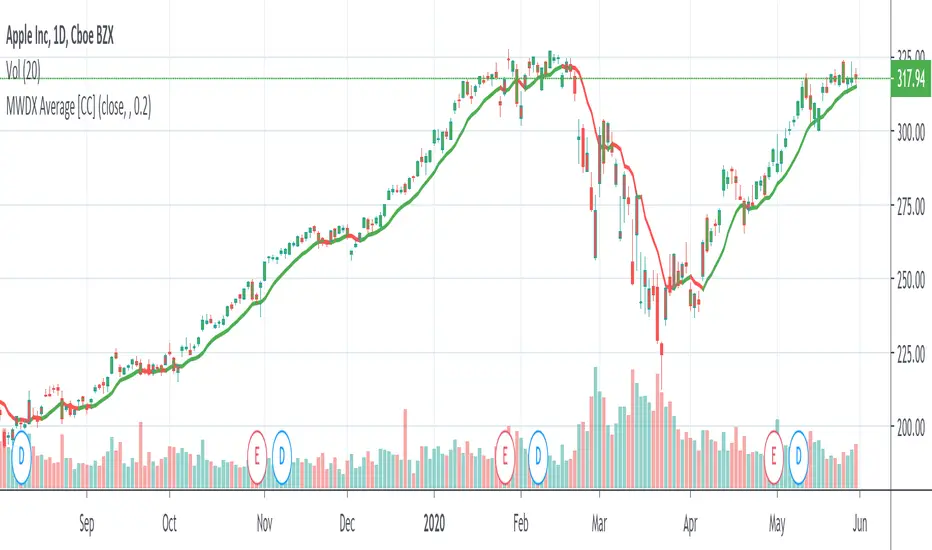
MWDX AverageThis is a variation of an exponential moving average which follows the price pretty smoothly. Feel free to change the factor to adjust how closely it follows the price. I set the default to 0.2
Let me know if you want me to write code for any other indicators!
Trend FollowerHello Traders!
While analysing the charts, one of the biggest problem is to see if there is trend or not, or is it in a congestion zone/area? While thinking about it, I found the idea to analyse moving averages in channel and their momentum according to channel width.
How it calculates and works?
On each bar it creates a channel by highest/lowest point of a MA. highest point is upper point and lowest point is lower point of the MA channel,
It gets highest and lowest point of last 300 bars, (say Price Channel )
If the width of MA channel is greater than certain rate of price channel then it decides there is trend
After it decided there is trend, it calculates the rate between channel and MA. Bigger result means stronger trend.
According to rate of MA channel and the price channel , bar color becomes lighter/darker. so when you look at the bar color you can see the trend strength.
Short explanation on the chart:
Also by changing channel or size other options (such MA length etc) you can see congestion zones/areas:
Another one, about trend direction and its strength:
Options:
You can choose following MA types as source: EMA, SMA , RMA, WMA , VWMA
"Period to Check Trend" is the period to create MA channel. Bigger period cause more sensitivity.
MA Period is the Length of the MA that will be checked
"Trend Channel Rate %" is rate of price channel . Price channel created by using highest/lowest of last 300 bars. I did this to make the script works on all time frames correctly.
"Use Linear Regression" is used to get rid of noise. it may cause 1-2 bars latency. (I use it)
The idea was created by LonesomeTheBlue.
Enjoy!

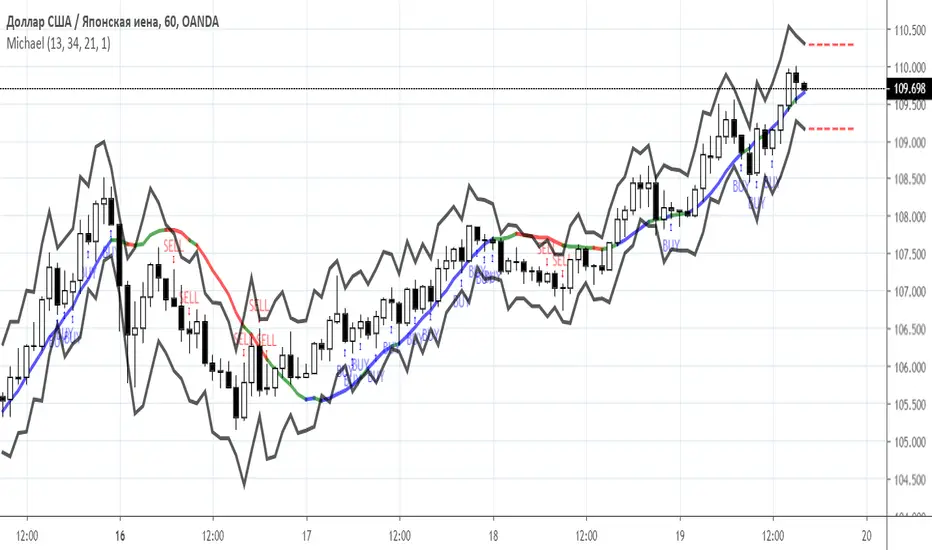
MichaelIndicator «Michael»
Class : trend indicator
Trading type : intraday trading / mid-term trading
Time frame : 15 min -1 day
Purpose : trend trading, reversal points identification,
Level of aggressiveness : standard
Indicator “ Michael ” indicator is designed to identify a local trend and generate signals for trading in the direction of the current trend. It can be used to trade at time intervals from 15 minutes to 1 day. The frequency of the signals depends on the selected time interval, as well as the indicator settings. For example, on an interval of 15 minutes and standard settings, the number of trades will be about 5-10 per day.
The indicator combines the advantages of average analysis, as well as regression analysis, which allow you to decrease unnecessary noise in price dynamics and concentrate on the overall picture of price movement.
The main feature of the Michael indicator is an attempt to partially offset the main drawback of the analysis of averages - the delay of signals. Averages, by their nature, show what was, and not what will be. As a result, often the predicative abilities of this method of technical analysis are questioned. In order to improve the quality of the signals, auto-regression model is used in the indicator. As the result “Michael” shows not what was, but what will be. That is, the delayed signals of the moving averages are balanced by the auto-regression model. Overall, a trader gets a picture that optimally describes the current reality.
In “ Michael ”, two autoregressive models with different lags are used, which allows monitoring not only general, but also current moods in the market.
Indicator “ Michael ” checks for the presence of price deviations from equilibrium values. If such deviations are detected, the indicator generates signals in the direction of the local trend.
Structure of indicator
The indicator consists of the following elements:
- trend line (center line) - shows the current trend in the market using a special color display. Red is a downward trend, blue is an upward trend, green is a flat;
- volatility lines - black channel lines that monitor the level of volatility in the market. Their divergence is a signal of an increase in market volatility. Convergence - decrease in volatility;
- stop lines - show the calculated value of the stop / profit value for the position in case of signal generation at a specific moment in time.
Parameters of the indicator
To configure the indicator, the following parameters are provided:
- periodFAR (default value is 13) - period for determining a short-term trend. The higher it is, the more conservative will be the perception of an indicator of a trend.
- periodSAR (default value is 34) - period for determining the current trend. Responsible for the level of trade aggressiveness. The lower the value of this parameter, the more signals the indicator will generate and vice versa.
- Stop_period (default value is 21) - period for calculating stop lines.
- Stop_agressor (default value is 1) - the parameter responsible for the aggressiveness of stop losses. The higher it is, the wider the lines of stops are.
Rules of trading
The main purpose of the indicator is to determine the prevailing market sentiments: bullish (the trend line is colored blue), bearish (the trend line is colored red) or neutral (the trend line is colored green). Accordingly, with dominance in the bull market, only buy transactions are allowed, and in a bear market, sells are allowed.
Signals to enter positions are displayed on the chart. Stops are set below (for purchases) or above (for sales) the red lines.
Trend Lines v2Hello Everyone. After working on new and better trend lines script for couple of weeks, finally I am proud to publish Trend Lines v2.
How it works?
- On each bar it finds last 10 higher and lower Pivot Points (PP).
- from first bar to 10. PP it search if a trend line is possible
- for each it starts searching from the last PP.
- it check if drawing a trend line possible or not and also it's broken or not
- if it's broken then optionally it shows broken trend lines as dotted
- if it finds a continues trend line and stop searhing more and draw trend line (I did this to make the script faster, otherwise you may get error because of it needs time more than .2sec)
- the script makes this process for each PP
optionally trend lines may be Solid or Dashed
optionally you may get rid of broken trend lines if you think it's crowded
and sometimes you may not see any trend line on the chart. this means you need to adjust the period for Pivot Points accordingly
also I made a video. if you watch this video you can see how the script works.
Important! after you add this tool to the chart you may need zoom-in and zoom-out to see all lines!
I thought a lot to make it free or not then I decided make it free and open source. you should know there is a lot of effort for this script, so if you think this is usefull please consider a donation ;)
Enjoy!

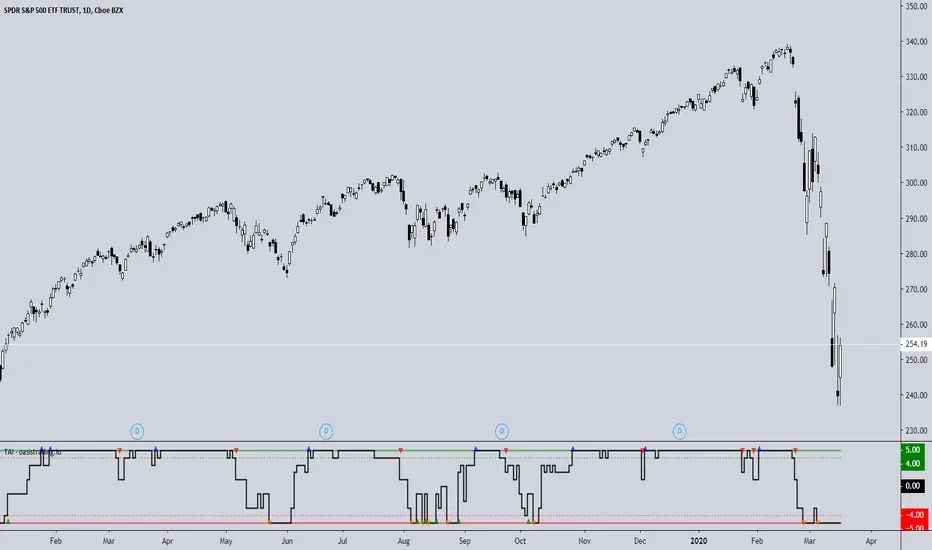
TAI - Trend Agreement IndexThe TAI is an experimental indicator we created to begin working on a automated trading algorithm. It takes five signals from our indicators and gives a +1 or -1 for each signal depending on if the signal is bullish or bearish.
This indicator should not be used for direct signals, but for confluence in trend. Long periods of flatness at 5 or -5 will indicate a very strong trend in that direction.
The TAI gives 4 different arrows depending on what the trend is doing.
Blue = Uptrend
Red = Uptrend Lost
Orange = Downtrend
Green = Downtrend Lost
This is a free add-on indicator for traders with access to the DBT MoMo and the Oasis Trading Suite and Bundle Package.
For Access or Questions: Private message us. Thank you.
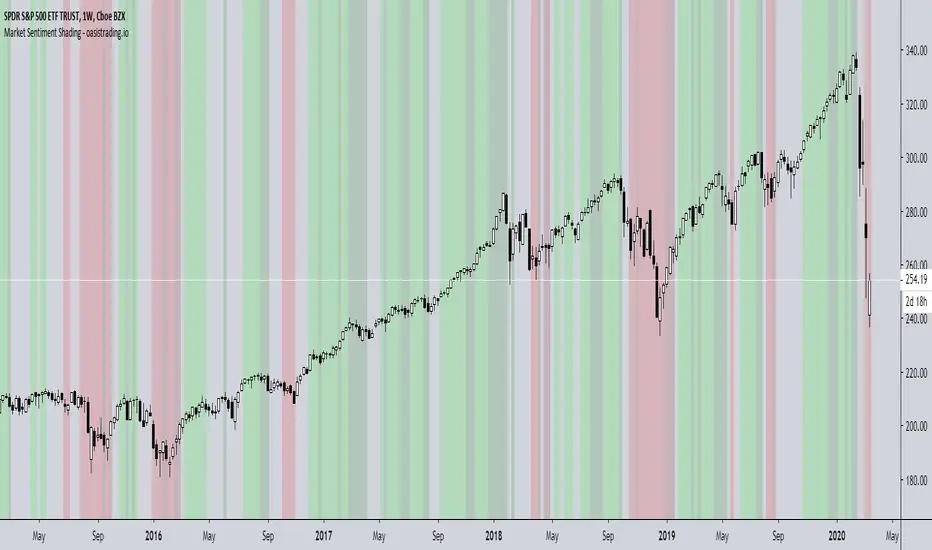
Market Sentiment ShadingThe Market Sentiment Shading Indicator shades the background of the asset based on signals from the DBT MoMo and Oasis Trading Suite. This indicator was designed to make it very obvious which direction the trend is moving and to keep the trader focused on following trend.
There are four different shades:
Dark Green = Bull
Light Green = Strong Bull
Dark Red = Bear
Light Red = Strong Bear
This is a free add-on indicator to traders with access to the DBT MoMo and Oasis Trading Suite and Bundle Package.
For Access or Questions: Private message us. Thank you.
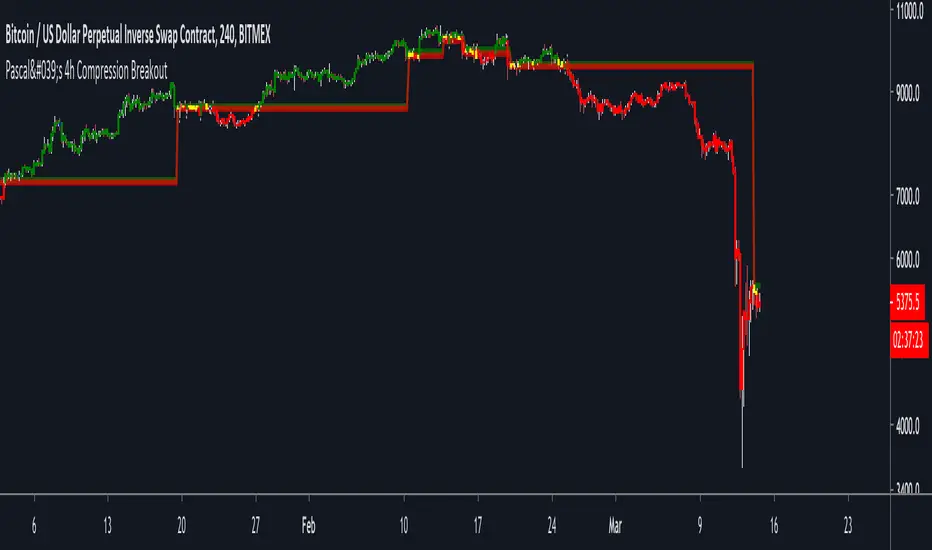
Pascal's 4h Compression BreakoutThis indicator aims to identify areas of price compression, by looking for two consecutive "inside candles" on the 4h chart.
An inside candle is simply when the current candle's high is lower than the previous candle's high, and the current candle's low is higher than the previous candle's low.
Once price compression is identified, the indicator draws a range based on the highest high and the lowest low of the two inside candles.
1) A break above the range is bullish.
2) A break below the range is bearish.
The script ALSO paints candles in blue that are likely to become strong horizontal S/R levels. This is, again, based on a candle pattern.
Please note:
1) This indicator is only meant to be used on BITMEX:XBTUSD (on the 4h or 1h chart).
2) You will have to apply some discretion to profitably trade with this indicator. Use SFPs and horizontal S/R levels to judge if a breakout is worth trading.
Finally, use the indicator at your own risk. I am not responsible for any losses you may incur.
My objective with this indicator g is to hopefully give you something that you can build upon, and NOT a script to blindly copy trade.
The concept of market compression is powerful. There are countless ways in which you can build a system around it.
This is just the tip of the iceberg.
Cheers.
Trend spider glueThis script works on all market types.
This script will show you when to long, short, exit (stop loss) and Take profit.
Signals take into account various elements such as momentum, volume , moving averages and long term trend analysis. Stop loss function is included to show you when a signal is invalidated.
Use this strategy strictly, patiently and with discipline to prevent unneeded losses, this will result in long term consistent profits.
This script has been set to work best on the intraday time frames, however it also works on the longer timeframes. Use the settings tab to dilute the indicators to ur own market.
Lastly, this indicator will not give signals if the market is not trending.
PM me here to get a free trial for the indicator !
HAPPY TRADING <3
Version 2 will be coming soon which will integerate more elements to allow for more accurate signals and faster stop losses !
disclaimer: although this indicator is taking many elements into account and is highly accurate the market is never certain, we are not responsible for any losses the script may result in as we are not financial advisors.

Trend Following BarWhile analysing a chart, one of the biggest problem is to see if there is trend or not. While thinking about it, I found the idea to analyse moving averages in channel and their momentum according to channel width.
How it Works?
On each bar it creates a channel by highest/lowest point of a MA. highest point is upper line and lowest point is lower line of the MA channel,
It gets highest and lowest point of last 300 bars, (say Price Channel)
If the width of MA channel is greater than certain rate of price channel then it decides there is trend
After it decided there is trend, it calculates the rate between channel and MA. Bigger result means stronger trend.
According to rate of MA channel and the price channel, bar color becomes lighter/darker. so when you look at the bar color you can see the trend strength.
Some details about my idea:
Options:
You can choose following MA types as source: EMA, SMA, RMA, WMA, VWMA
"Period to Check Trend" is the period to create MA channel. Bigger period cause more sensitivity.
"Trend Channel Rate %" is rate of price channel. Price channel created by using highest/lowest of last 300 bars. I did this to make the script works on all time frames correctly.
"Use Linear Regression" is used to get rid of noise. it may cause 1-2 bars latency.
All comments are welcome!.
Enjoy!

Lowkey System (Study)View strategy version
A long-only strategy that aim to detect the beginning of new bullish trends and their ends.
For entering a new position this script is waiting for a moving average crossover then wait for a volume increase relative to the current volatility.
For closing a position it's simply waiting for a crossunder of whether the MA or if enabled the stop loss.
This strategy is already configured to run on BTCUSD in a 4h timeframe but you can customize the moving average and the stop loss parameters to suit your needs.
I've worked a lot to write this script so I'm not giving it for free but you can try it for 10 days.
Contact me for more details.
Have fun!
PS: I'm french so please excuse me if I've made some grammar errors ;)

Lowkey System (Strategy)View study version
A long-only strategy that aim to detect the beginning of new bullish trends and their ends.
For entering a new position this script is waiting for a moving average crossover then wait for a volume increase relative to the current volatility.
For closing a position it's simply waiting for a crossunder of whether the MA or if enabled the stop loss.
This strategy is already configured to run on BTCUSD in a 4h timeframe but you can customize the moving average and the stop loss parameters to suit your needs.
I've worked a lot to write this script so I'm not giving it for free but you can try it for 10 days.
Contact me for more details.
Have fun!
PS: I'm french so please excuse me if I've made some grammar errors ;)

Trend Following BreakoutEasy Trend Following Strategy using Highs and Lows breakout of the last X candles to enter and exit trades.
You can easily change the ENTRY and EXIT value in order to find the best settings.
This strategy seems to be working well for $BTC and $ETH on the 4H and 1D.
I didn't play with it too much as I am testing script to trade on the 15 minutes chart with margin. This script can't do this successfully but I hope it can be helpful for what you want to achieve.

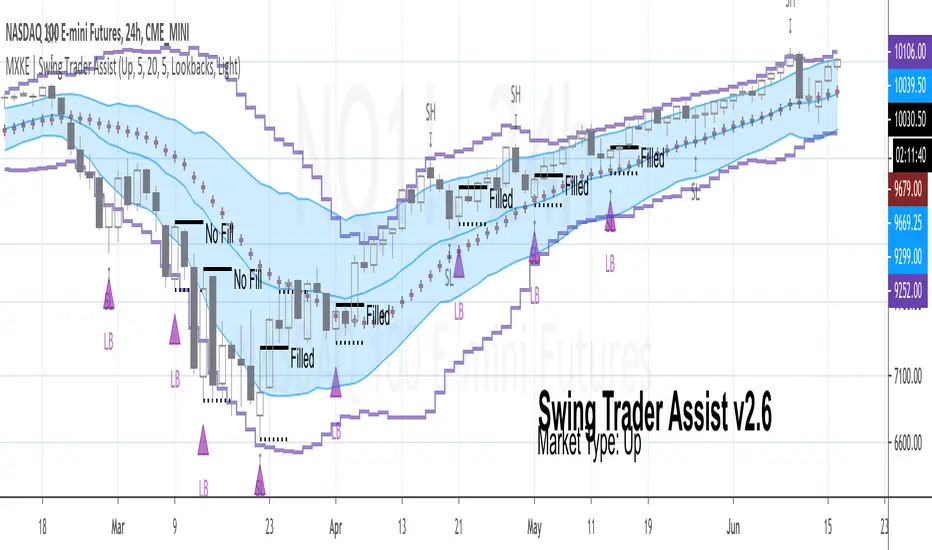
MXKE | Swing Trader AssistIntroduction
Swing Trader Assist indicator is designed to assist in the systematic identification of Hammers & Lookback signals within Uptrending markets, Stars & Lookback signals within Downtrending markets, and Mean Reversion signals within Sideways markets. The trader must first identify a strong market trend, then apply the indicator. Application of the indicator to weak trends will render equally weak signals. Application of the indicator to strong trends will render equally strong signals. Identification of strong trends is the responsibility of the individual trader and is instrumental to the successful deployment of this indicator and accompanying trading plan.
*Please comment below to request access*
*Please share with me on Twitter your usage and/or ideas for improvement so that I may improve this indicator in the future*
Market Types
Uptrend: Higher highs + Higher lows
Downtrend: Lower highs + Lower lows
Sideways: Higher highs + Lower lows (Expanding Range) or Lower highs + Higher lows (Narrowing Range)
Position Sizing
1R = .25%-2% of total nominal capital dependent upon timeframe and risk appetite
Order Types
Entry: Buy Stop 1 tick above High of “Up” Signal Bars; Sell Stop 1 tick below Low of “Down” Signal Bars
Stop: Bar Close <= 1 tick below Low of “Up” Signal Bar; Bar Close >= 1 tick above High of “Down” Signal Bar
Profit Target: 1.5R distance from “Up” or “Down” fill level with the option to trail stop on each new swing high/low; Bollinger Band Midline minimum 1.5R distance from “Sideways” fill level with option to trail stop on continuation to the opposite end of the range (opposite Bollinger Band)
Trading Plan
❑ Market Type is clearly identifiable as Up, Down or Sideways
❑ Swing Trader Assist indicator is set to the corresponding Market Type: Up, Down or Sideways
❑ Position size is no more than .25%-2% of total nominal capital (based on distance from Signal Bar fill level to Signal Bar stop level as 1R)
❑ Distance from Signal Bar fill level to potential Profit Target is minimum 1.5R
❑ On Hammer or Star fill: close position into trend extension at 1.5R+ or adjust trailing stop on each new swing high/low
❑ On Mean Reversion fill: close position at midline or adjust trailing stop on each continuation to opposite end of range
Usage Notes
The indicator will display developing signals intrabar and it is therefore suggested to wait until bar close to act on any signals. “Autodetect” setting under “Market Type” is currently in beta mode. While it is designed to reveal only relevant signals within strong trends based on a series of EMAs, this setting has not been extensively tested. Use with caution.
The indicator is not meant to be a mechanical trading system. It is designed to assist the trader in objectively and systematically identifying signal bars during the execution of the below swing trading plan. It is up to the trader to determine if overall price action warrants acting upon the signal bars or not.
Case Studies
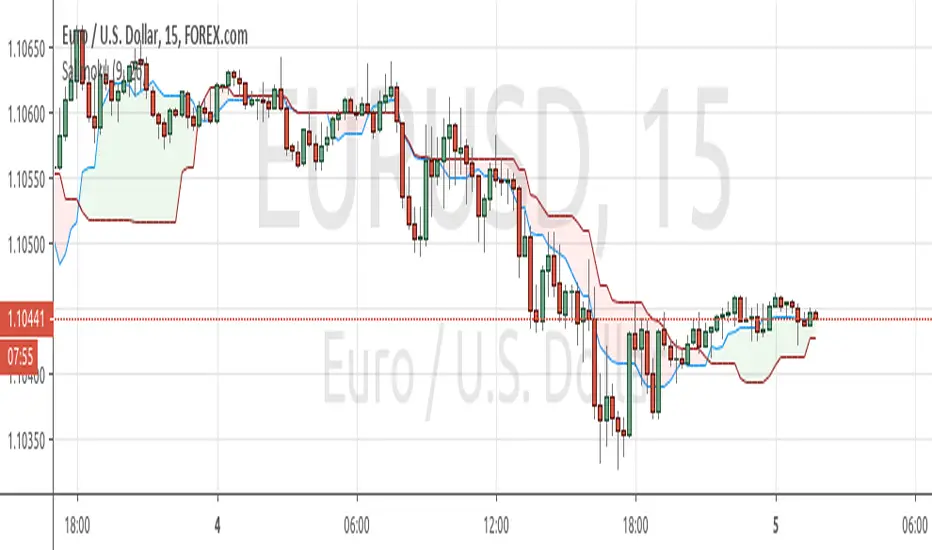
Salimoku T-OriginSalimoku is a simplified Ichimoku without clouds. This indicator is best used for trend following strategy. The advantage here is the possibility to catch a trend at it very beginning and also get clear entry signals on already formed trends.
To enter a trade:
a buy signal is triggered when price crosses the decision line and closes above it.
a sell signal is triggered when price crosses the decision line and closes below it
In the scenario of trend already formed:
a buy signal is triggered when price bounces in between baseline and conversion line and closes above baseline.
a sell signal is triggered when price bounces in between baseline and conversion line and closes below baseline
Trend LinesHello Everyone! This is my new trend lines script (after beta version that was published almost one year ago)
The idea is to find Pivot Highs (PH) and Pivot Lows(PL) first.
Then, If current PH is smaller then previous PH (means no new higher high and possible downtrend) then draw trend line using them. and also it checks previous trend line (if exits) and if current angle is smaller then don't extend previous one.
Same idea when using Pivot Lows, If current PL is higher then previous PL (means no new lower low and possible uptrend) then draw trend line using them. and also it checks previous trend line (if exits) and if current angle is smaller then don't extend previous one.
Optionally style of old trend lines drawn as dashed.
Hope you enjoy it!

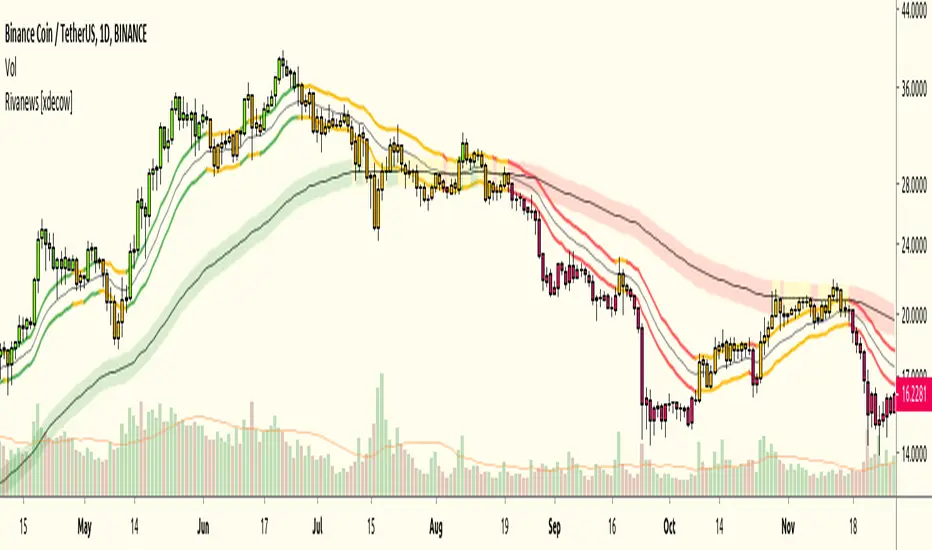
Rivanews Setup - Riva-Keltner, Média Rock [xdecow]This setup was created by Rivadavila S. Malheiros
There are 2 Keltner Channels with exponential moving averages of 21 (riva) and 89 (rock) and ATR multiplier of 0.618.
When the price is between the bands, it is a sign of consolidation (yellow).
When the price is above the bands, it is an upward trend (green).
When the price is below the bands, it is a downward trend (red).
When the price crosses rock 89 and closes up / down, it may be a sign of a reversal. But it has a high probability of testing rock 89 again.
------------------------------------------------------------------------------------------
PT-BR
Este setup foi criado por Rivadavila S. Malheiros
São 2 Keltner Channels com médias móveis exponenciais de 21 (riva) e 89 (rock) e multiplicador do ATR de 0.618.
Quando o preço está entre as bandas, é sinal de consolidação (amarelo).
Quando o preço está acima das bandas, é uma tendencia de alta (verde).
Quando o preço está abaixo das bandas, é uma tendencia de baixa (vermelho).
Quando o preço cruza a rock 89 e fecha acima/abaixo, pode ser sinal de reversão. Mas tem uma alta probabilidade de testar a rock 89 novamente.
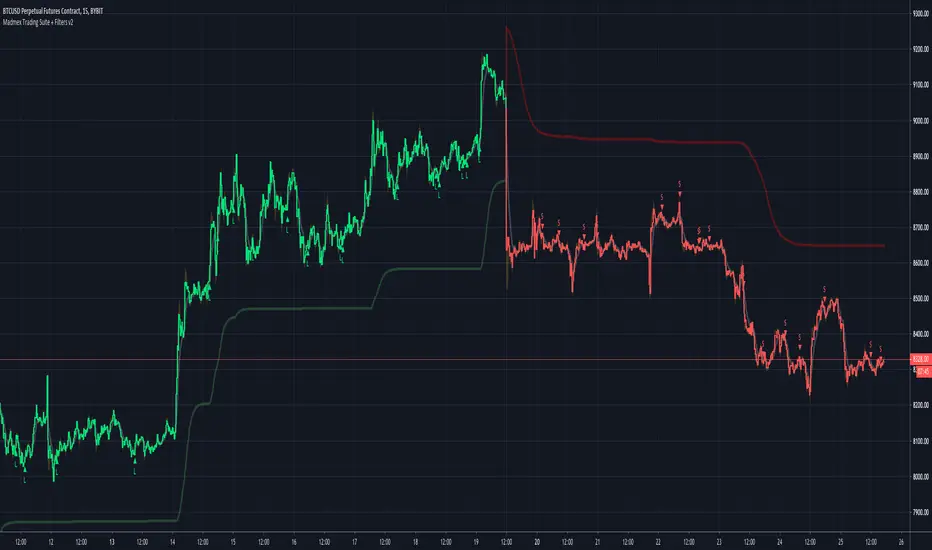
Madmex Trading Suite + FiltersA goodie for my trading groups and friends. A suite of different MAs with Filters with multiple Long/Short Alerts, works as well for pyramiding.
Using fixed TP/SL is advised. I might add TP/SL Alerts later on...
Good luck!
Feedback is appreciated!
Trend Following or Mean RevertingThe strategy checks nature of the instruments. It Buys if the close is greater than yesterday's high, reverse the position if the close is lower than yesterday's low and repeat the process.
1. If it is trend following then the equity curve will be in uptrend
2. If it is mean reverting then the equity curve will be downtrend
Thanks to Rayner Teo.
