TrendDECODER by MetaSignalsProTrendDECODER
The fastest indicator to detect trends and price ranges
-------------------------------------------------------------------
✔️ Identify ranges and the next probable direction
✔️ Get the earliest signals and the strength of Trends
✔️ Get clear exits signals before reversal
✔️ Spot the Fibo levels the price will test
-------------------------------------------------------------------
📌 What is it about ?
--------------------------
TrendDECODER is a concentrate of multiple innovations to make Trend following simple and easy.
Please see in the 🛠️ Calculation & Precisions section at the end of this page to know more how they work.
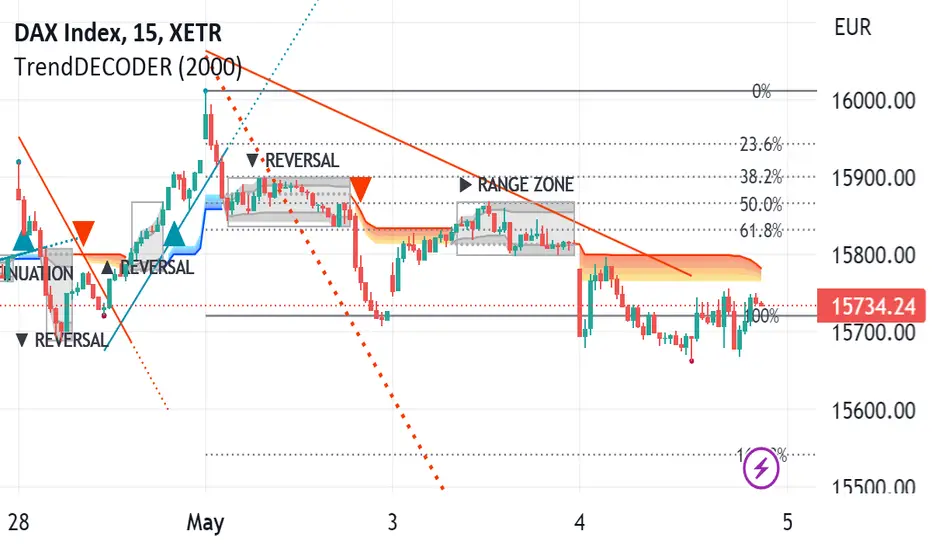
👉 With the GreyBox - identify when the market gets out of the Trend with a new sequence of transition. Check if the market is in Range, Continuation or Reversal (Up or Down) and wait for the closing of the box to get the Trend signal.
👉 With the DecoderSignals & Blue/Orange Clouds - once the GreyBox has delivered its message, get the new direction of the Trend and see the probable zones of pull backs during the current direction.
👉 With the Projective TrendLine - see before it happens the direction and the possible angle of the Trend with its probable range.
👉 With the RealTime TrendLine vs the Projective TrendLine - adjust immediately if the market accelerates North or South.
👉 With the RealTime TrendLine Crossing - detect at the earliest the moment the Trend gets out of track, to get out of the train.
👉 With the FiboLevels - spot immediately which price levels the market will test.
📌 For which asset?
-----------------------
TrendDECODER is universal : it works fine on all assets and all time-frames;
☝️ always work on a multi-timeframe environment to minimize risk;
📌Why we made these innovations?
---------------------------------------------
Because the trend indicators that we know, lag a lot and do not clearly identify ranges!
We need much more powerful tools than Supertrend or a couple of moving averages crossings to get this done.
📌 How to trade with TrendDECODER?
----------------------------------------------
🔹 Strategy #1: Trend Following : DecoderSignals & Blue/Orange Clouds
----------------------------------------------------------------------------------------
The GreyBOX has given the next probable movement and the Signal of a Trend in on.
The RealTime TrendLine guides us on the pace of this movement and the Blue/ Orange/Cloud figures the support/resistance of this movement.
It will be wise not to jump immediately in the Trend as the signal appears as the price will very probably make a pullback in direction of the cloud first.
🔹 Strategy #1: Checklist
📍 Set a Multi Time Frame environment
📍 Main Time Frame and the Upper Time Frame are moving in the same direction (Up or Down)
📍 Main Time Frame: appearance of the « TrendUp Signal » or the « TrendDown Signal »
📍 Entry:
☝️ buying « at Market » immediately on a « Trend Signal » is quite risky as many times the price will pull back near the Clouds
👉 a good option is to buy 1/2 the position at market on signal
👉 and 1/2 after the first pull back
📍 First Stop Loss: place your SL under the lower border of the GreyBox for an expected TrendUp or the higher border for an expected TrendDown
📍 BreakEven: when the price reaches your Risk/Reward ratio of 1 = Distance StopLoss vs Entry = Distance Current Price vs Entry
📍 Trailing Stop: just under the lowest border of the Blue Cloud (TrendUp) or the highest border of the Orange Cloud (TrendDown)
📍 TakeProfits: in a TrendUP, place your take profits just under the FibosLevels in order not to get exited (and above in a TrendDOWN)
📍 Exits:
👉 Early option : Crossing of the RealTime TrendLine
👉 Late option : Crossing of the Blue/Orange cloud
🔹 Strategy #2: Early Trend following : RealTime TrendLine Crossing
-------------------------------------------------------------------------------------
With this simple tool, get a very early signal of a probable inversion of the current Trend, way before the Decoder Signal is shown, once confirmed by the GreyBOX.
🔹 Strategy #2: Checklist
📍 Set a Multi Time Frame environment
📍 Main Time Frame and the Upper Time Frame are moving in the same direction (Up or Down)
📍 Entry (Main Time Frame): wait for the Close crossing over the ReaTime TrendLine in an expected TrendUp (under for a TrendDown )
📍 First Stop Loss (Main Time Frame):
👉 place your SL under the lower low of the GreyBOX (for an expected TrendUp) or the higher high (for an expected TrendDown)
📍 BreakEven: move your SL to Entry price when the price reaches your Risk/Reward ratio of 1 = Distance StopLoss vs Entry = Distance Current Price vs Entry
📍 Trailing Stop: just under the lowest border of the Blue Cloud (TrendUp) or the highest border of the Orange Cloud (TrendDown)
📍 TakeProfits: in a TrendUP, place your take profits just under the FibosLevels in order not to get exited (and above in a TrendDOWN)
📍 Exits:
👉 Early option : Crossing of the RealTime TrendLine
👉 Late option : Crossing of the Blue/Orange cloud
🎛️ Configuration
---------------------
Well, basically you do not have to do anything !
But you can make TrendDECODER perfectly yours with a few switches in the configuration panel to make appear or disappear each one of the elements composing TrendDECODER.
🛠️ Calculation & Precisions
------------------------------------
🔹 Blue/Orange Clouds
The Blue/Orange Clouds are a proprietary synthesis of Price Action and Volume Exchange in real time.
🔹 Projective TrendLine
As soon as a new high or a new low has been reached during the last move, TrendDECODER traces a possible angle of the future movement based on the pace of the last one in the same direction.
The distance between the Projective TrendLine and the Last Lowest (resp. Highest) gives you a possible bottom (resp. top) of the price range.
🔹 RealTime TrendLine
As soon as the Decoder GreyBox has delivered its information i.e Range/Continuation/ReversalUp/ReversalDown and that a New High (resp. New Low) has been reached, the RealTime TrendLine starts to show the pace and the angle of the new movement based on a linear regression adanced concept.
The angles of the Projective and the RealTime TrendLine can be identical, telling you that the market moves smoothly in a global consensus. It can be a smart Trailing Stop Loss.
Or these angles can be very different and it will call your maximum attention. You might want to switch to a superior timeframe to get the bigger picture.
🔹 FiboLevels
Once a new Trend is signaled, the levels of Fibonnaci are automatically placed.
They are calculated on the last Highest and Lowest of the former movement.
Trendfollowing
Lorentzian Classification Strategy Based in the model of Machine learning: Lorentzian Classification by @jdehorty, you will be able to get into trending moves and get interesting entries in the market with this strategy. I also put some new features for better backtesting results!
Backtesting context: 2022-07-19 to 2023-04-14 of US500 1H by PEPPERSTONE. Commissions: 0.03% for each entry, 0.03% for each exit. Risk per trade: 2.5% of the total account
For this strategy, 3 indicators are used:
Machine learning: Lorentzian Classification by @jdehorty
One Ema of 200 periods for identifying the trend
Supertrend indicator as a filter for some exits
Atr stop loss from Gatherio
Trade conditions:
For longs:
Close price is above 200 Ema
Lorentzian Classification indicates a buying signal
This gives us our long signal. Stop loss will be determined by atr stop loss (white point), break even(blue point) by a risk/reward ratio of 1:1 and take profit of 3:1 where half position will be closed. This will be showed as buy.
The other half will be closed when the model indicates a selling signal or Supertrend indicator gives a bearish signal. This will be showed as cl buy.
For shorts:
Close price is under 200 Ema
Lorentzian Classification indicates a selling signal
This gives us our short signal. Stop loss will be determined by atr stop loss (white point), break even(blue point) by a risk/reward ratio of 1:1 and take profit of 3:1 where half position will be closed. This will be showed as sell.
The other half will be closed when the model indicates a buying signal or Supertrend indicator gives a bullish signal. This will be showed as cl sell.
Risk management
To calculate the amount of the position you will use just a small percent of your initial capital for the strategy and you will use the atr stop loss or last swing for this.
Example: You have 1000 usd and you just want to risk 2,5% of your account, there is a buy signal at price of 4,000 usd. The stop loss price from atr stop loss or last swing is 3,900. You calculate the distance in percent between 4,000 and 3,900. In this case, that distance would be of 2.50%. Then, you calculate your position by this way: (initial or current capital * risk per trade of your account) / (stop loss distance).
Using these values on the formula: (1000*2,5%)/(2,5%) = 1000usd. It means, you have to use 1000 usd for risking 2.5% of your account.
We will use this risk management for applying compound interest.
> In settings, with position amount calculator, you can enter the amount in usd of your account and the amount in percentage for risking per trade of the account. You will see this value in green color in the upper left corner that shows the amount in usd to use for risking the specific percentage of your account.
> You can also choose a fixed amount, so you will have to activate fixed amount in risk management for trades and set the fixed amount for backtesting.
Script functions
Inside of settings, you will find some utilities for display atr stop loss, break evens, positions, signals, indicators, a table of some stats from backtesting, etc.
You will find the settings for risk management at the end of the script if you want to change something or trying new values for other assets for backtesting.
If you want to change the initial capital for backtest the strategy, go to properties, and also enter the commisions of your exchange and slippage for more realistic results.
In risk managment you can find an option called "Use leverage ?", activate this if you want to backtest using leverage, which means that in case of not having enough money for risking the % determined by you of your account using your initial capital, you will use leverage for using the enough amount for risking that % of your acount in a buy position. Otherwise, the amount will be limited by your initial/current capital
I also added a function for backtesting if you had added or withdrawn money frequently:
Adding money: You can choose how often you want to add money (Monthly, yearly, daily or weekly). Then a fixed amount of money and activate or deactivate this function
Withdraw money: You can choose if you want to withdraw a fixed amount or a percentage of earnings. Then you can choose a fixed amount of money, the period of time and activate or deactivate this function. Also, the percentage of earnings if you choosed this option.
Some other assets where strategy has worked
BTCUSD 4H, 1D
ETHUSD 4H, 1D
BNBUSD 4H
SPX 1D
BANKNIFTY 4H, 15 min
Some things to consider
USE UNDER YOUR OWN RISK. PAST RESULTS DO NOT REPRESENT THE FUTURE.
DEPENDING OF % ACCOUNT RISK PER TRADE, YOU COULD REQUIRE LEVERAGE FOR OPEN SOME POSITIONS, SO PLEASE, BE CAREFULL AND USE CORRECTLY THE RISK MANAGEMENT
Do not forget to change commissions and other parameters related with back testing results!. If you have problems loading the script reduce max bars back number in general settings
Strategies for trending markets use to have more looses than wins and it takes a long time to get profits, so do not forget to be patient and consistent !
Please, visit the post from @jdehorty called Machine Learning: Lorentzian Classification for a better understanding of his script!
Any support and boosts will be well received. If you have any question, do not doubt to ask!

Momentum Covariance Oscillator by TenozenWell, guess what? A new indicator is here! Again it's a coincidence, as I experiment with my formula. So far it's less noisy than Autoregressive Covariance Oscillator, so possibly this one is better. The formula is much simpler, care me to explain.
___________________________________________________________________________________________________
Yt = close - previous average
Val = Yt/close
___________________________________________________________________________________________________
Welp that's the formula lol. Funny thing is that it's so simple, but it's good! What matters is the use of it haha.
So how to use this Oscillator? If the value is above 0, we expect a bullish response, if the value is below 0 we expect a bearish response. That simple. Ciao.
(Any questions and suggestions? feel free to comment!)

Know the trend - KTT---------- ENGLISH -----------
This indicator combines the values of four common indicators (MACD, MACD signal, normalized RSI and linear regression) to provide a unified view of the market trend. The indicator calculates the average of the rescaled values of these four indicators and plots it on the chart as a line that changes color based on its position relative to 0. If the line is above 0, it is colored black to indicate a bullish trend. If the line is below 0, it is colored red to indicate a bearish trend. The user can enter a value for the length of the indicator to customize the time period used for calculating the underlying indicators. The indicator works on any time frame.
---------- ITALIANO -----------
Questo indicatore combina i valori di quattro indicatori comuni (MACD, segnale MACD, RSI normalizzato e regressione lineare) per fornire una visione unificata del trend del mercato. L’indicatore calcola la media dei valori riscalati di questi quattro indicatori e la disegna sul grafico come una linea che cambia colore in base alla sua posizione rispetto allo 0. Se la linea è sopra lo 0, viene colorata di nero per indicare un trend rialzista. Se la linea è sotto lo 0, viene colorata di rosso per indicare un trend ribassista. L’utente può inserire un valore per la lunghezza dell’indicatore per personalizzare il periodo di tempo utilizzato per il calcolo degli indicatori sottostanti. L’indicatore funziona su ogni time frame.

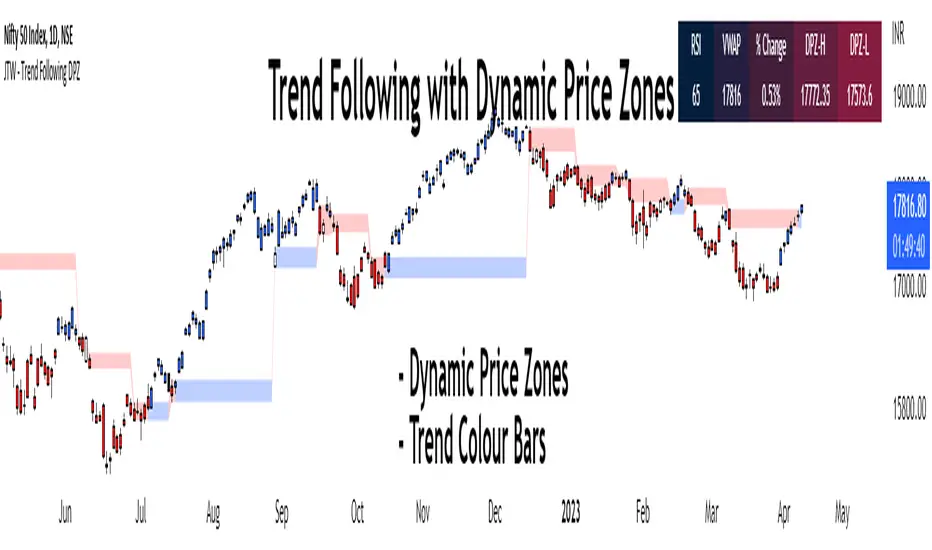
Trend Following with Dynamic Price ZonesThis script provides a complete framework for following trends , especially on those assets which are sufficiently liquid and don't go through random spikes.
Since it is a trend-following system, it works well during trends only. However, I cannot claim any numbers since the execution requires some discretion at the user's end. This framework can also be combined with other technical tools such as trend lines to increase its efficacy.
Features:
Dynamic Price Zones:
• The Dynamic Price Zones (DPZ) are determined using a proprietary logic that incorporates price movement and certain other factors.
• These zones change more rapidly than conventional support and resistance (S/R) zones, which is why I have named them "Dynamic".
• DPZs can serve as support and resistance zones and help with trend identification to some extent.
• The upper boundary of a zone is called Dynamic Price Zone High (DPZ-H) , while the lower boundary is called Dynamic Price Zone Low (DPZ-L) .
Colour Bars:
• Candle colours are based on another proprietary logic, independent of dynamic price zones .
• These are not traditional moving average-based coloured bars, which is evident from the presence of uncoloured bars in between.
• The uncoloured bars indicate periods of uncertain trends .
• Colour functionality helps in smoothening the trend and assists in riding it for as long as possible.
Stats Table:
• RSI
• VWAP
• % Change from the previous day's closing
• Dynamic Price Zone High (DPZ-H) value
• Dynamic Price Zone Low (DPZ-L) value
Settings:
• DPZs are displayed as horizontal lines with background fill by default, but users can toggle lines and background fill on or off.
• Bar colours can be customized according to user preferences.
• The table can be enabled or disabled based on user input.
• The position of the table can be changed based on 4 available options: Top Left, Top Right, Bottom Left, and Bottom Right.
• Users can toggle individual table fields on or off . For example: If the user wants to hide "Vwap" and "%Change" values, he can turn them off. In that case, only 3 fields will be displayed on the table without occupying additional space.
• Background and text colours for each field of the table can be customized based on user preferences.
How to Use the Dynamic Price Zones:
• When the price is above a DPZ, it indicates a bullish trend , suggesting the possibility of higher prices. These zones are termed Bullish DPZs.
• Conversely, if the price is below a DPZ, it signals a bearish trend , with an expectation of lower prices. These zones are termed Bearish DPZs.
• In a trending market, when the price returns to a previous DPZ, it can present a trading opportunity in the direction of the prior trend (e.g., if the market is falling and the price returns to a previous DPZ, it is likely to reject it).
• Consecutive ascending DPZs indicate a shift in buyers from lower to higher levels and can provide buying opportunities. This also indicates a period of a strong bullish trend.
• Similarly, consecutive descending DPZs indicate a shift in sellers from higher to lower levels and can provide selling opportunities. This also indicates a period of a strong bearish trend.
• Please note that we must be flexible when determining the consecutive zones. For example: There may be a few smaller bearish DPZs in between the bullish DPZs but if the area is dominated by the bullish DPZs then we can consider the zones as consecutive. Similar is true for bearish consecutive zones.
• Closely stacked or adjacent zones suggest that prices will likely remain within a range, moving sideways.
• Wider zones act as big hurdles and, the price may struggle to cross them. They may also lead to a sideways movement.
• Zones that remain clean and untested for several sessions are likely to act as strong support or resistance when the price revisits them.
Bullish Examples:
Bearish Examples:
Some Examples of the Complete System
Trend follower system combined with Trendlines
Special Thanks
I would like to extend my special thanks to all the experts whose lectures and blogs I have studied to gain a limited yet significant knowledge of the Pine language.
Best regards,
Rajat Kumar Singh (@johntradingwick)
Community Manager (India), TradingView.
Autoregressive Covariance Oscillator by TenozenWell to be honest I don't know what to name this indicator lol. But anyway, here is my another original work! Gonna give some background of why I create this indicator, it's all pretty much a coincidence when I'm learning about time series analysis.
_ _ _ _ _ _ _ _ _ _ _ _ _ _ _ _ _ _ _ _ _ _ _ _ _ _ _ _ _ _ _ _ _ _ _ _ _
Well, the formula of Auto-covariance is:
E{(X(t)-(t) * (X(t-s)-(t-s))}= Y_s
But I don't multiply both values but rather subtract them:
E{(X(t)-(t) - (X(t-s)-(t-s))}= Y_s?
_ _ _ _ _ _ _ _ _ _ _ _ _ _ _ _ _ _ _ _ _ _ _ _ _ _ _ _ _ _ _ _ _ _ _ _ _
For arm_vald, the equation is as follows:
arm_vald = val_mu + mu_plus_lsm + et
val_mu --> mean of time series
mu_plus_lsm --> val_mu + LSM
et --> error term
As you can see, val_mu^2. I did this so the oscillator is much smoother.
_ _ _ _ _ _ _ _ _ _ _ _ _ _ _ _ _ _ _ _ _ _ _ _ _ _ _ _ _ _ _ _ _ _ _ _ _
After I get the value, I normalize them:
aco = Y_s? / arm_vald
So by this calculation, I get something like an oscillator!
(more details in the code)
_ _ _ _ _ _ _ _ _ _ _ _ _ _ _ _ _ _ _ _ _ _ _ _ _ _ _ _ _ _ _ _ _ _ _ _ _
So how to use this indicator? It's so easy! If the value is above 0, we gonna expect a bullish response, if the value is below 0, we gonna expect a bearish response; that simple. Be aware that you should wait for the price to be closed before executing a trade.
Well, try it out! So far this is the most powerful indicator that I've created, hope it's useful. Ciao.
(more updates for the indicator if needed)

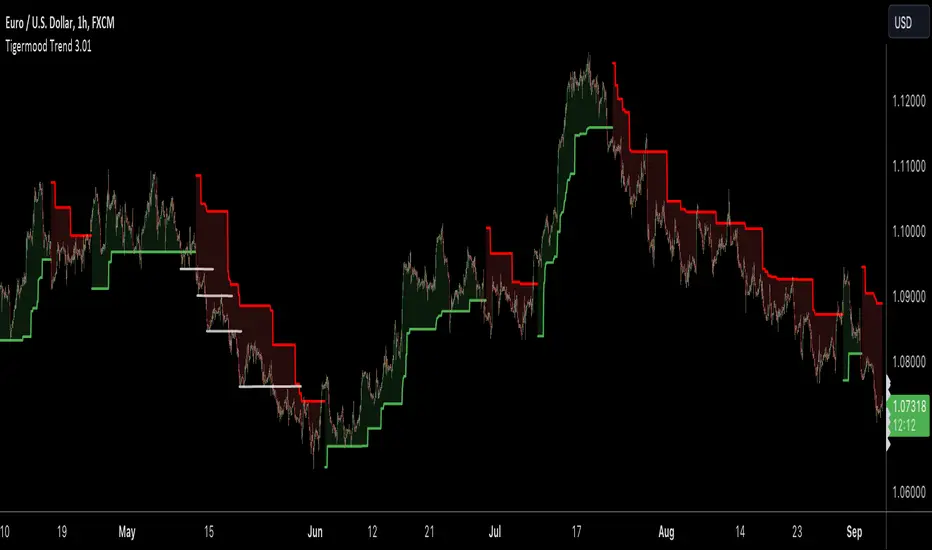
TIGERMOOD TREND
🔶 About Tigermood Trend for TradingView.
Tigermood Trend is a trend detector that uses several logics including but not limited to volatility , momentum, key fibonacci levels and trend changing logic to generate a reliable trend on most time frames and applicable for Stocks, futures , Forex, and Cryptos.
Unlike other trend indicators, Tigermood Trend is as simple as it looks but uses several behind-the-scene price action algorithms that work in tandem to create a trend to keep the trader as long as market is trending and hence streamlines their trades accordingly.
🔶 Logic behind Tigermood Trend
Detecting the Fibonacci lows and highs (Hooks) after a trend change or a major trend pivot is formed.
Once a fibonacci hook is detected, key fibonacci levels are calculated and ready to be applied to the trend on event triggers.
To control the optimal fibonacci level to be applied a moving average is added to the logic with length from 20-200 depending on the selected timeframe.
Fibonacci hooks are controlled and validated using a modified supertrend indicator with ATR length and factor set automatically according to the selected timeframe, and that to avoid non-significant hooks (trend pivots).
To update to a certain fibonacci level, certain conditions must be met to validate this level, these conditions check for RSI extreme conditions, supertrend conditions, trend stage (early stage or extended).
Trend changing is controlled as well. In order for trend to change once price crosses the stop-bands, Tigermood trend takes into consideration: volatility, strong or weak trend status, early/mature stage of the trend, and finally the last fibonacci levels used. A bias towards a hard trend change is favored instead of soft trend change, which is a simple close crossing and that to avoid as many false trend changes as possible
During extreme high momentum trending, the updating bias will shift to the moving average with ATR and supertrend limitation.
█ Tigermood Trend is designed to be as plug-and-play indicator with little or no parameters to set or keep tweaking thus enabling the trader to concentrate on his/her strategy entries and exits. (limited settings to control sensitivity and some behavior may be introduced in the future)
█ Tigermood Trend is a no-Repainting indicator. the trend updates only on the close of the current bar using barstate.isconfirmed .
█ However, it is important to emphasize that Tigermood Trend is NOT a signal generator. You don't see Buy and Sell signals on the chart. (as of this date). Even though upon trend changing you may think it is a buy/sell indication but it is NOT. This indicator is made for traders who need a trend to confirm the direction of their trades, and avoid confusion during high market volatility; and experienced traders know very well that trading with a reliable trend constitute an essential and an integral part of their trading strategy. This way the trader is spending more time on fine-tuning their trade opportunities.
█ Tigermood Trend is a Tool to be added to the traders' toolbox and is not a trading system by its own. (While in the future the indicator will highlight area of high opportunity for entries and stop losses)
█ Tigermood Trend is under continuous development. New features, logic updates and new logics will be regularly added in new versions.
Best of luck in your trading journey,
Tigermood
Strategy for UT Bot Alerts indicator Using the UT Bot alerts indicator by @QuantNomad, this strategy was designed for showing an example of how this indicator could be used, also, it has the goal to help some people from a group that use to use this indicator for their trading. Under any circumstance I recommend to use it without testing it before in real time.
Backtesting context: 2020-02-05 to 2023-02-25 of BTCUSD 4H by Tvc. Commissions: 0.03% for each entry, 0.03% for each exit. Risk per trade: 2.5% of the total account
For this strategy, 3 indicators are used:
UT Bot Alerts indicator by Quantnomad
One Ema of 200 periods for indicate the trend
Atr stop loss from Gatherio
Trade conditions:
For longs:
Close price is higher than Atr from UT Bot
Ema from UT Bot cross over Atr from UT Bot.
This gives us our long signal. Stop loss will be determined by atr stop loss (white point), break even(blue point) by a risk/reward ratio of 0.75:1 and take profit of 3:1 where half position will be closed. This will be showed as buy (open long position)
The other half will be closed when close price is lower than Atr and Ema from UT Bot cross under Atr. This will be showed as cl buy (close long position)
For shorts:
Close price is lower than Atr from UT Bot
Ema from UT Bot cross over Atr from UT Bot.
This gives us our short signal. Stop loss will be determined by atr stop loss (white point), break even(blue point) by a risk/reward ratio of 0.75:1 and take profit of 3:1 where half position will be closed. This will be showed as sell (open short position)
The other half will be closed when close price is higher than Atr and Ema from UT Bot cross over Atr. This will be showed as cl sell (close short position)
Risk management
For calculate the amount of the position you will use just a small percent of your initial capital for the strategy and you will use the atr stop loss for this.
Example: You have 1000 usd and you just want to risk 2,5% of your account, there is a long signal at price of 20,000 usd. The stop loss price from atr stop loss is 19,000. You calculate the distance in percent between 20,000 and 19,000. In this case, that distance would be of 5,0%. Then, you calculate your position by this way: (initial or current capital * risk per trade of your account) / (stop loss distance).
Using these values on the formula: (1000*2,5%)/(5,0%) = 500usd. It means, you have to use 500 usd for risking 2.5% of your account.
We will use this risk management for apply compound interest.
In settings, with position amount calculator, you can enter the amount in usd of your account and the amount in percentage for risking per trade of the account. You will see this value in green color in the upper left corner that shows the amount in usd to use for risking the specific percentage of your account.
Script functions
Inside of settings, you will find some utilities for display atr stop loss, break evens, positions, signals, indicators, etc.
You will find the settings for risk management at the end of the script if you want to change something. But rebember, do not change values from indicators, the idea is to not over optimize the strategy.
If you want to change the initial capital for backtest the strategy, go to properties, and also enter the commisions of your exchange and slippage for more realistic results.
In risk managment you can find an option called "Use leverage ?", activate this if you want to backtest using leverage, which means that in case of not having enough money for risking the % determined by you of your account using your initial capital, you will use leverage for using the enough amount for risking that % of your acount in a buy position. Otherwise, the amount will be limited by your initial/current capital
---> Do not forget to deactivate Trades on chart option in style settings for a cleaner look of the chart <---
Some things to consider
USE UNDER YOUR OWN RISK. PAST RESULTS DO NOT REPRESENT THE FUTURE.
DEPENDING OF % ACCOUNT RISK PER TRADE, YOU COULD REQUIRE LEVERAGE FOR OPEN SOME POSITIONS, SO PLEASE, BE CAREFULL AND USE CORRECTLY THE RISK MANAGEMENT
Do not forget to change commissions and other parameters related with back testing results!
Strategies for trending markets use to have more looses than wins and it takes a long time to get profits, so do not forget to be patient and consistent !
---> The strategy can still be improved, you can change some parameters depending of the asset and timeframe like risk/reward for taking profits, for break even, also the main parameters of the UT Bot Alerts <----

The Weinstein MethodWhat is "The Weinstein Method" indicator?
Presentation of the indicator
The Weinstein Method indicator was developed by us to help traders use the Stan Weinstein Method more effectively. This method usually requires a lot of time and analysis to determine the different phases of an asset, but the indicator takes care of that in no time. By simply choosing the market and the timeframe, traders can get the different trends of the asset, the famous four phases of Stan Weinstein.
The basic principles of the indicator
The Weinstein Method indicator is based on the principles of the Stan Weinstein Method. According to this method, assets go through four phases: the accumulation phase, the rise phase, the distribution phase and the fall phase. Traders use these phases to determine when to buy, sell or stay out of the market.
How the indicator works
The indicator will take into account several elements to trigger the phases: the RSI, the volumes, the EMA, the Relative Strength of the asset (the choice of the market in the menu of the indicator is determining for this calculation) and the Supports/Resistances.
Depending on the Timeframe (several configurations: 1 hour, 4 hours, daily, weekly and monthly) and the market (Dow Jones - Stock, S&P 500 - Stock, Nasdaq - Stock, DAX - Stock, CAC 40 - Stock and Cryptos) selected, the variables mentioned above change to adapt to the asset and the timeframe.
Each phase has criteria that must be met in order to be triggered (those described by Stan Weinstein in his book "Secrets for Profiting in Bull and Bear Markets"):
- Phase 1: We have determined as criteria: low volume, RSI in the low zone, minimal price variation over the last X candles and the EMA without direction.
- Phase 2: We calculate the relative strength of the asset compared to its benchmark, above-average volumes, the break of a major resistance, the direction of the EMA and the level of the RSI.
- Phase 3: We look to see if the asset breaks its uptrend (break of a trend following EMA), if it fails to make a new high, if the RSI is in the high zone and if the volumes are strong.
- Phase 4: For this phase to be triggered, the asset must break a major support, be below the EMA (once again these variables are adapted according to the timeframe and the market selected in the menu) and the EMA must be bearish.
How to use
The signals of the indicator
On the chart, the indicator allows you to visualize the different phases of an asset's movement. Each point on the chart corresponds to a particular phase, which is labeled below the point with the name of the phase. The different phases that can be identified with the help of the indicator are the following:
- S1: Accumulation
- S2: Rising
- S3: Distribution
- S4: Decline
By observing the successive points, it’s possible to identify the market trend and to consider trading positions accordingly.
The different strategies for using the indicator
The market phase indicator can be used for both short term and long-term trading strategies. However, it should be noted that this method is generally used for the medium and long term.
In terms of trading strategies, investors can use the indicator to identify periods of trend reversal and take positions against the current trend. For example, if the indicator shows a distribution phase, this may indicate a downward trend reversal and a trader could take a sell position when the downward phase begins.
On the other hand, traders can also use the indicator to confirm the current trend and take positions in the direction of the trend. If the indicator shows an upward phase, this may indicate a continuing upward trend and a trader could take a buy position.
Disclaimer
Please note that The Weinstein Method indicator is a tool designed to assist traders in their decision-making process. While it is based on sound principles and can be helpful in identifying market trends, it is important to remember that there is no magic indicator that can guarantee success in trading.
It is the responsibility of the user to carefully consider all available information, including the signals generated by The Weinstein Method indicator, and to make their own informed decisions about when to buy, sell or stay out of the market. It is important to remember that trading carries risks, and no strategy or tool can eliminate those risks entirely.
We want to emphasize that we do not provide investment advice, and any decisions made using The Weinstein Method indicator are the sole responsibility of the user. We cannot be held liable for any losses that may occur as a result of trading using this indicator.

Investments/swing trading strategy for different assetsStop worrying about catching the lowest price, it's almost impossible!: with this trend-following strategy and protection from bearish phases, you will know how to enter the market properly to obtain benefits in the long term.
Backtesting context: 1899-11-01 to 2023-02-16 of SPX by Tvc. Commissions: 0.05% for each entry, 0.05% for each exit. Risk per trade: 2.5% of the total account
For this strategy, 5 indicators are used:
One Ema of 200 periods
Atr Stop loss indicator from Gatherio
Squeeze momentum indicator from LazyBear
Moving average convergence/divergence or Macd
Relative strength index or Rsi
Trade conditions:
There are three type of entries, one of them depends if we want to trade against a bearish trend or not.
---If we keep Against trend option deactivated, the rules for two type of entries are:---
First type of entry:
With the next rules, we will be able to entry in a pull back situation:
Squeeze momentum is under 0 line (red)
Close is above 200 Ema and close is higher than the past close
Histogram from macd is under 0 line and is higher than the past one
Once these rules are met, we enter into a buy position. Stop loss will be determined by atr stop loss (white point) and break even(blue point) by a risk/reward ratio of 1:1.
For closing this position: Squeeze momentum crosses over 0 and, until squeeze momentum crosses under 0, we close the position. Otherwise, we would have closed the position due to break even or stop loss.
Second type of entry:
With the next rules, we will not lose a possible bullish movement:
Close is above 200 Ema
Squeeze momentum crosses under 0 line
Once these rules are met, we enter into a buy position. Stop loss will be determined by atr stop loss (white point) and break even(blue point) by a risk/reward ratio of 1:1.
Like in the past type of entry, for closing this position: Squeeze momentum crosses over 0 and, until squeeze momentum crosses under 0, we close the position. Otherwise, we would have closed the position due to break even or stop loss.
---If we keep Against trend option activated, the rules are the same as the ones above, but with one more type of entry. This is more useful in weekly timeframes, but could also be used in daily time frame:---
Third type of entry:
Close is under 200 Ema
Squeeze momentum crosses under 0 line
Once these rules are met, we enter into a buy position. Stop loss will be determined by atr stop loss (white point) and break even(blue point) by a risk/reward ratio of 1:1.
Like in the past type of entries, for closing this position: Squeeze momentum crosses over 0 and, until squeeze momentum crosses under 0, we close the position. Otherwise, we would have closed the position due to break even or stop loss.
Risk management
For calculating the amount of the position you will use just a small percent of your initial capital for the strategy and you will use the atr stop loss for this.
Example: You have 1000 usd and you just want to risk 2,5% of your account, there is a buy signal at price of 4,000 usd. The stop loss price from atr stop loss is 3,900. You calculate the distance in percent between 4,000 and 3,900. In this case, that distance would be of 2.50%. Then, you calculate your position by this way: (initial or current capital * risk per trade of your account) / (stop loss distance).
Using these values on the formula: (1000*2,5%)/(2,5%) = 1000usd. It means, you have to use 1000 usd for risking 2.5% of your account.
We will use this risk management for applying compound interest.
In settings, with position amount calculator, you can enter the amount in usd of your account and the amount in percentage for risking per trade of the account. You will see this value in green color in the upper left corner that shows the amount in usd to use for risking the specific percentage of your account.
Script functions
Inside of settings, you will find some utilities for display atr stop loss, break evens, positions, signals, indicators, etc.
You will find the settings for risk management at the end of the script if you want to change something. But rebember, do not change values from indicators, the idea is to not over optimize the strategy.
If you want to change the initial capital for backtest the strategy, go to properties, and also enter the commisions of your exchange and slippage for more realistic results.
If you activate break even using rsi, when rsi crosses under overbought zone break even will be activated. This can work in some assets.
---Important: In risk managment you can find an option called "Use leverage ?", activate this if you want to backtest using leverage, which means that in case of not having enough money for risking the % determined by you of your account using your initial capital, you will use leverage for using the enough amount for risking that % of your acount in a buy position. Otherwise, the amount will be limited by your initial/current capital---
Some things to consider
USE UNDER YOUR OWN RISK. PAST RESULTS DO NOT REPRESENT THE FUTURE.
DEPENDING OF % ACCOUNT RISK PER TRADE, YOU COULD REQUIRE LEVERAGE FOR OPEN SOME POSITIONS, SO PLEASE, BE CAREFULL AND USE CORRECTLY THE RISK MANAGEMENT
Do not forget to change commissions and other parameters related with back testing results!
Some assets and timeframes where the strategy has also worked:
BTCUSD : 4H, 1D, W
SPX (US500) : 4H, 1D, W
GOLD : 1D, W
SILVER : 1D, W
ETHUSD : 4H, 1D
DXY : 1D
AAPL : 4H, 1D, W
AMZN : 4H, 1D, W
META : 4H, 1D, W
(and others stocks)
BANKNIFTY : 4H, 1D, W
DAX : 1D, W
RUT : 1D, W
HSI : 1D, W
NI225 : 1D, W
USDCOP : 1D, W

Trend Oscillatorwhat is "Trend Oscillator"?
it is an indicator for determining the trend.
what it does?
analyzes the price action by reducing it to 4 different situations. Red means strong bear, orange means bearish, yellow means weak bull and green means strong bull. It was developed to help traders who trade in the direction of the trend and its biggest promise is to simplify price action.
how it does it?
He defines 4 different situations as follows. If the velocity of the price is positive and the acceleration is positive, it is a strong bull, if the velocity is positive and the acceleration is negative, it is a weak bull, if the velocity is negative and the acceleration is positive, it is a weak bear, if both velocity and acceleration are negative, it is a strong bear.
2 for strong bull
1 for the weak bull
-1 for weak bear
Creates a function that takes values of -2 for the strong bear. this function is the velocity of the principal indicator, and then the integral of this function forms the principal indicator.
how to use it?
"source" is used to change the source of the indicator,
"length" makes the indicator give a later but less signal.
you can use it to follow or analyze the trend. colors make it easy to use. learns about current or past trends by looking at colors. Like any trend indicator, it can give unsuccessful signals in a horizontal trend.

VWAP filtered MACD Bars with positive MACD histogram value and closing above VWAP are colored, long positions should be taken in areas made of those bars.
Similarly, bars with negative MACD histogram value and closing below VWAP are also colored, short positions should be taken there.
This indicator by default should be a part of your trend following trading system.
In the setting you can change colors
Above grow: positive and rising MACD histogram value
Above fall: positive and falling MACD histogram value
Below fall: negative and falling MACD histogram value
Below grow: negative and rising MACD histogram value
Rocket Grid Algorithm - The Quant ScienceThe Rocket Grid Algorithm is a trading strategy that enables traders to engage in both long and short selling strategies. The script allows traders to backtest their strategies with a date range of their choice, in addition to selecting the desired strategy - either SMA Based Crossunder or SMA Based Crossover.
The script is a combination of trend following and short-term mean reversing strategies. Trend following involves identifying the current market trend and riding it for as long as possible until it changes direction. This type of strategy can be used over a medium- to long-term time horizon, typically several months to a few years.
Short-term mean reversing, on the other hand, involves taking advantage of short-term price movements that deviate from the average price. This type of strategy is usually applied over a much shorter time horizon, such as a few days to a few weeks. By rapidly entering and exiting positions, the strategy seeks to capture small, quick gains in volatile market conditions.
Overall, the script blends the best of both worlds by combining the long-term stability of trend following with the quick gains of short-term mean reversing, allowing traders to potentially benefit from both short-term and long-term market trends.
Traders can configure the start and end dates, months, and years, and choose the length of the data they want to work with. Additionally, they can set the percentage grid and the upper and lower destroyers to manage their trades effectively. The script also calculates the Simple Moving Average of the chosen data length and plots it on the chart.
The trigger for entering a trade is defined as a crossunder or crossover of the close price with the Simple Moving Average. Once the trigger is activated, the script calculates the total percentage of the side and creates a grid range. The grid range is then divided into ten equal parts, with each part representing a unique grid level. The script keeps track of each grid level, and once the close price reaches the grid level, it opens a trade in the specified direction.
The equity management strategy in the script involves a dynamic allocation of equity to each trade. The first order placed uses 10% of the available equity, while each subsequent order uses 1% less of the available equity. This results in the allocation of 9% for the second order, 8% for the third order, and so on, until a maximum of 10 open trades. This approach allows for risk management and can help to limit potential losses.
Overall, the Rocket Grid Algorithm is a flexible and powerful trading strategy that can be customized to meet the specific needs of individual traders. Its user-friendly interface and robust backtesting capabilities make it an excellent tool for traders looking to enhance their trading experience.

Fibonacci Step IndicatorThe Fibonacci Step Indicator assumes irregularity in calculating a moving average. It is measured as the mean of the previous lows and highs situated at Fibonacci past periods. For example, the mean of the lows from 2, 3, 5, 8, etc. periods ago form the Fibonacci step indicator.
The indicator uses the formula for the first twelve Fibonacci numbers on highs and lows so that it creates a moving support/resistance zone. Afterwards, the zone is stabilized by taking the highest highs of the upper indicator and the lowest lows of the lower indicator part.
The indicator is used as a trend following way. It can be compared to the Ichimoku Kinko Hyo cloud (without the future projection). The zone form a support and resistance area. During ranging periods, the market will fluctuate within the area which is a bad time to follow the trend (if any).

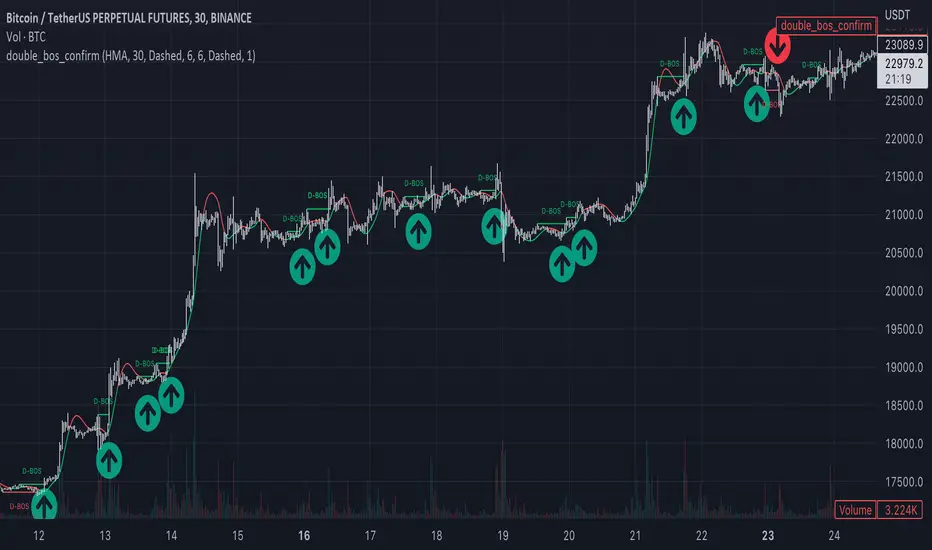
Market Structure Double BOS Confirm
🔥 Overview
🎯 This Double BOS(Break Of Structure) Confirm indicator combined ma-based BOS and classic BOS
to achieve a more credible BOS signal . it works well in most symbols with 2 parameters finetune.
🎯 It's a enhanced version compare with previous script.
🎯 at the same time, I keep D-BOS and BOS separately, you can use them in combination freely.
🔥 Indicator design logic
🎯 there are 3 parts in this indicator.
Part 1: MA-Based BOS
1. use close-in EMA's highest/lowest value mark as SWING High/Low when EMA crossover/under,
not use func ta.pivothigh()/ta.pivotlow()
2. once price reaching EMA’s SWING High/Low, draw a line link High/Low to current bar, labled as BOS
3. more MA-Based BOS details can get from my previous script.
Part 2: Classic BOS
1. use pivothigh/low function to find pivot (decided by left/right swing length)
2. when get new pivothigh, compare with previous high, calculate HH/LH/HL/LL result
3. once bar closed and break pivothigh then labed as BOS
Part 3: Double BOS Confirms
1. when MA-Based BOS and Classic BOS occured at the same bar closed signed as D-BOS
2. when two BOS events one bar apart, signed as D-BOS
🔥 Settings
🎯 there are 13 input properties in script, 4 properties(Bold field) have an impact on the results and the other 9 show display effects.
GRP1
MA_Type : MA type you can choose(EMA/RMA/SMA/HMA/WMA/VWMA), default is HMA
short_ma_len : MA length of your current timeframe on chart, default 30
show_ma_bos_line: whether show ma-based BOS line, default false
GRP2
left_swing_len : pivothigh(source, left,right), it‘s left swing length
right_swing_len : right swing length
show_pivot_bos_line: whether show pivot-based BOS line, default false
GRP3
show_double_bos_line: show double_bos_line, default true
double_bos_linewidth: linewidth, default 2 (Bold line)
double_bos_linestyle: default Dashed
🔥 Usage
🎯 BOS signal usually worked fine in high volatility market, low volatility is meaningless.
🎯 D-BOS will filtered much more signals than ma-based BOS and classic BOS
We can see that it performs well in trending market of different symbols, and BOS is an opportunity to add positions,
D-BOS will filtered much more signals
Double-BOS Confirm : BINANCE:BTCUSDTPERP 30m
MA-Based BOS : BINANCE:BTCUSDTPERP 30m
🎯 Support classic HH/HL label, MA-Based Zigzag
🎯 You can use only D-BOS, MA-BOS or Classic-BOS alone, or D-BOS and one of the other, it's up to you,
but my personal preference is to use D-BOS and MA-BOS in combination
🎯 any questions or suggestion please comment below, I would appreciate it greatly.
Additionally, I plan to publish 20 profitable strategies in 2023; indicatior not one of them,
let‘s witness it together!
Hope this indicator will be useful for you :)
enjoy! 🚀🚀🚀
Trend Analysis Ultimate (Zeiierman)█ Overview
Trend Analysis Ultimate (Zeiierman) highlights meaningful pullbacks within active market trends and visualizes them through green and red columns, retracement triangles, and an optional trend-colored background. It is designed to make the distinction between continuation and transition phases clear at a glance while automatically managing dynamic trailing stops, early and partial profit-taking levels, and alert conditions for entries, take-profits, and full exits.
The system adapts to changing market structure in real time, allowing traders to monitor momentum shifts, retracement strength, and phase transitions with precision. By combining structural mapping with adaptive sensitivity controls, it provides a complete framework for identifying where a trend is likely to continue, pause, or reverse.
⚪ Why This One Is Unique
Unlike traditional trend tools that simply color bars or measure moving averages, Trend Analysis Ultimate integrates retracement mapping with trend phase detection. Its framework merges contextual structure analysis (higher highs/lows or lower highs/lows) with dynamic sensitivity controls, identifying both the rhythm and the stress points within a trend.
Through a unified signal logic and adaptive retracement engine, traders can distinguish between normal pullbacks within a trend and retracements that precede reversal — all visualized with intuitive, color-coded accuracy.
█ Main features
⚪ Retracements
A retracement is a temporary move against the prevailing trend. It often signals a pause, potential continuation opportunity, or the early stages of a reversal. In this indicator, green/red retracement columns mark significant pullbacks that frequently precede new local highs/lows, continuation legs, or the end of a trend.
Key concept: Retracements appear at both continuation points and turning points. The trader’s edge is in recognizing whether the pullback is a reset of strength or the first warning that the current trend is losing control.
Bullish Retracement
Bearish Retracement
⚪ Retracements Signals
The Retracement Signals feature highlights the precise moments when a temporary counter-move within a dominant trend shows signs of exhaustion and potential continuation. It converts early momentum shifts into clear bullish or bearish setup signals.
Bullish Retracement Signal
Bearish Retracement Signal
⚪ Trend
The Trend Feature visually defines the current market regime — bullish, bearish, or neutral — by dynamically coloring bars, the indicator background, and the Confirmed Trend Columns in the lower panel. Together, these elements reflect the underlying directional bias detected by the trend engine, providing immediate context for all retracement, continuation, and entry signals.
Green bars, background, and confirmed columns → Active Bullish Trend Phase
Red bars, background, and confirmed columns → Active Bearish Trend Phase
Light or neutral bars → Transition Phase, signaling potential trend change or reduced directional strength.
█ How to Use
⚪ Major Retracements / Pullbacks
Major Bullish Retracements
Step 1: Ask Key Context Questions
When green retracement columns appear in the indicator window, ask yourself:
Are we in a bullish trend? Look for higher highs (HH) and higher lows (HL). Confirm that trendlines are pointing upward.
Is this forming a higher low? Green columns often print during pullbacks, just before price forms a higher low and the uptrend continues.
Is this a healthy correction? If price respects previous structure or the rising trendline, and the green bars begin shrinking, it indicates renewed strength and that the pullback may be ending.
Step 2: Apply Practically
If the answers above are Yes, the retracement likely represents a continuation opportunity.
Confirm an uptrend (HH/HL structure, rising trendlines).
Treat green columns as a pullback zone within that trend.
Watch for confirmation such as:
Rejection candles near support
Break of a short-term downtrend line
Volume confirming renewed buying pressure
Enter once price resumes upward movement, not during the retracement itself.
Major Bearish Retracements
Step 1: Ask Key Context Questions
When red retracement columns appear in the indicator window, ask yourself:
Are we in a bearish trend? Check if lower highs (LH) and lower lows (LL) are forming, and confirm that trendlines are pointing downward.
Is this forming a lower high? Red columns often appear during pullbacks, just before price forms a lower high and the downtrend resumes.
Is this a healthy correction? If price respects prior resistance or a falling trendline, and the red bars begin shrinking, it signals renewed weakness and that the pullback may be ending.
Step 2: Apply Practically
If the answers above are Yes, the retracement likely marks a continuation opportunity in the prevailing downtrend.
Confirm a downtrend (LH/LL structure, falling trendlines).
Treat red columns as a pullback zone within that trend.
Watch for confirmation such as:
Rejection candles near resistance
Break of a short-term uptrend line
Volume confirming renewed selling pressure
Enter once price resumes downward movement, not during the retracement itself.
⚪ Minor Retracements / Pullbacks
Minor retracements represent short, fast counter-moves within an active trend. They often occur as quick pauses or micro-corrections and are best suited for scalping or short-term continuation setups. Always align these signals with the dominant background trend and confirm direction using clear trendlines to stay on the right side of market structure.
Minor Bullish Retracements
When price is in a clear uptrend and a small pullback occurs:
Watch for short sequences of green retracement impulses (▲) or shrinking green columns on the indicator.
Treat these as quick buy-the-dip zones within the larger bullish context.
Look for confirmation from trendline support or a rejection candle before entering.
Minor Bearish Retracements
When price is trending downward and a brief rally appears:
Watch for red retracement impulses (▼) or shrinking red columns indicating weakening upward correction.
Use these as potential short re-entry zones in line with the broader downtrend.
Confirm with rejection at resistance or a break of a short-term uptrend line.
⚪ Retracements Signals
Bullish Signals
Bullish Retracement Signals appear during an active uptrend, typically within retracement phases when the market experiences a short-term pullback against the main trend. These signals are triggered when the retracement shows signs of exhaustion and the indicator detects renewed buying momentum aligned with the broader bullish structure.
They highlight potential continuation points, where the price may resume making higher highs after completing a healthy correction. This setup leverages the natural rhythm of the market — capturing the moment buyers regain control following temporary weakness.
Bearish Signals
Bearish Retracement Signals form during an active downtrend, typically within counter-trend rallies or retracement phases against the dominant bearish direction. They emerge when temporary upward movement loses strength, and the indicator identifies renewed selling pressure aligned with the main trend.
These signals often precede fresh downside continuation — when sellers reassert control and push price toward new lower lows.
⚪ Identifying the End of One Trend and the Start of Another
Every trend eventually runs out of strength. Early signs often look like a normal retracement, a routine pullback within the existing move. But when price fails to attract enough buyers or sellers to continue in the same direction, that retracement can mark the turning point where momentum shifts and a new trend begins.
When price can no longer find support in an uptrend or resistance in a downtrend, it signals exhaustion of the current phase and a possible transition into the opposite direction. The retracement columns highlight these transition zones, areas where one trend may fade and another may start forming.
When they appear, it’s important to ask:
Is the current trend mature? The longer a trend has been running, the greater the likelihood of reversal. If retracement columns show up late in a multi-leg move, treat them as early warnings.
Are there reversal signs forming? Watch for structures like double tops, double bottoms, trendline breaks, or channel violations that suggest the trend’s strength is fading.
By combining retracement columns with a clear understanding of trend structure and price action, traders can better distinguish between healthy pullbacks and the emergence of a new trend.
Bullish Trend Ends
Bearish Trend Ends
█ How It Works
⚪ Trend Phase Architecture
The indicator models directional bias through a continuously adaptive trend-mapping framework. It classifies market states as bullish, bearish, or neutral based on slope polarity and structural persistence.
Calculation: Utilizes layered regression vectors and dynamic range analysis to estimate directional gradients, blending short- and long-term components to maintain stability while remaining responsive to new motion.
⚪ Retracement Detection Engine
Retracement columns quantify counter-movements within the dominant trend, identifying deceleration, pullback depth, and phase overlap. Each bar’s classification reflects the relative strength trend progression.
Calculation: Applies trend-state comparison with phase-weighted averaging to isolate transitional motion. The resulting dual-polar columns (green/red) are normalized to a zero-centered scale for visual symmetry and precision.
⚪ Impulse & Triangle Module
Retracement impulses (▲/▼) represent local acceleration spikes during pullback phases, revealing the moment when opposing momentum reaches statistical significance.
Calculation: Identifies short-term impulse clusters through curvature mapping to isolate localized bursts of directional momentum within the retracement phase.
⚪ Entry & Signal Logic
The entry module fuses retracement data with trend-state validation, filtering signals through contextual structure and confirmation hierarchy. Only qualified impulses aligned with the dominant vector trigger actionable events.
Calculation: Integrates a composite decision function using multi-phase sensitivity weighting, differential smoothing, and state gating to separate impulsive noise from valid continuation momentum.
-----------------
Disclaimer
The content provided in my scripts, indicators, ideas, algorithms, and systems is for educational and informational purposes only. It does not constitute financial advice, investment recommendations, or a solicitation to buy or sell any financial instruments. I will not accept liability for any loss or damage, including without limitation any loss of profit, which may arise directly or indirectly from the use of or reliance on such information.
All investments involve risk, and the past performance of a security, industry, sector, market, financial product, trading strategy, backtest, or individual's trading does not guarantee future results or returns. Investors are fully responsible for any investment decisions they make. Such decisions should be based solely on an evaluation of their financial circumstances, investment objectives, risk tolerance, and liquidity needs.
Płatny skrypt

Simple SuperTrend Strategy for BTCUSD 4HHello guys!, If you are a swing trader and you are looking for a simple trend strategy, you should check this one. Based in the supertrend indicator, this strategy will help you to catch big movements in BTCUSD 4H and avoid losses as much as possible in consolidated situations of the market
This strategy was designed for BTCUSD in 4H timeframe
Backtesting context: 2020-01-02 to 2023-01-05 (The strategy has also worked in previous years)
Trade conditions:
Rules are actually simple, the most important thing is the risk and position management of this strategy
For long:
Once Supertrend changes from a downtrend to a uptrend, you enter into a long position. The stop loss will be defined by the atr stop loss
The first profit will be of 0.75 risk/reward ratio where half position will be closed. When this happens, you move the stop loss to break even.
Now, just will be there two situations:
Once Supertrend changes from a uptrend to a downtrend, you close the other half of the initial long position.
If price goes againts the position, the position will be closed due to breakeven.
For short:
Once Supertrend changes from a uptrend to a downtrend, you enter into a short position. The stop loss will be defined by the atr stop loss
The first profit will be of 0.75 risk/reward ratio where half position will be closed. When this happens, you move the stop loss to break even.
Like in the long position, just will be there two situations:
Once Supertrend changes from a downtrend to a uptrend, you close the other half of the initial short position.
If price goes againts the position, the position will be closed due to breakeven.
Risk management
For calculate the amount of the position you will use just a small percent of your initial capital for the strategy and you will use the atr stop loss for this.
Example: You have 1000 usd and you just want to risk 2,5% of your account, there is a long signal at price of 20,000 usd. The stop loss price from atr stop loss is 19,000. You calculate the distance in percent between 20,000 and 19,000. In this case, that distance would be of 5,0%. Then, you calculate your position by this way: (initial or current capital * risk per trade of your account) / (stop loss distance).
Using these values on the formula: (1000*2,5%)/(5,0%) = 500usd. It means, you have to use 500 usd for risking 2.5% of your account.
We will use this risk management for apply compound interest.
Script functions
Inside of settings, you will find some utilities for display atr stop loss, supertrend or positions.
You will find the settings for risk management at the end of the script if you want to change something. But rebember, do not change values from indicators, the idea is to not over optimize the strategy.
If you want to change the initial capital for backtest the strategy, go to properties, and also enter the commisions of your exchange and slippage for more realistic results.
Signals meanings:
L for long position. CL for close long position.
S for short position. CS for close short position.
Tp for take profit (it also appears when the position is closed due to stop loss, this due to the script uses two kind of positions)
Exit due to break even or due to stop loss
Some things to consider
USE UNDER YOUR OWN RISK. PAST RESULTS DO NOT REPRESENT THE FUTURE.
DEPENDING OF % ACCOUNT RISK PER TRADE, YOU COULD REQUIRE LEVERAGE FOR OPEN SOME POSITIONS, SO PLEASE, BE CAREFULL AND USE CORRECTLY THE RISK MANAGEMENT
The amount of trades closed in the backtest are not exactly the real ones. If you want to know the real ones, go to settings and change % of trade for first take profit to 100 for getting the real ones. In the backtest, the real amount of opened trades was of 194.
Indicators used:
Supertrend
Atr stop loss by garethyeo
This is the fist strategy that I publish in tradingview, I will be glad with you for any suggestion, support or advice for future scripts. Do not doubt in make any question you have and if you liked this content, leave a boost. I plan to bring more strategies and useful content for you!

Trendly
╭━━━━╮╱╱╱╱╱╱╱╱╭┳╮
┃╭╮╭╮┃╱╱╱╱╱╱╱╱┃┃┃
╰╯┃┃┣┻┳━━┳━╮╭━╯┃┃╭╮╱╭╮
╱╱┃┃┃╭┫┃━┫╭╮┫╭╮┃┃┃┃╱┃┃
╱╱┃┃┃┃┃┃━┫┃┃┃╰╯┃╰┫╰━╯┃
╱╱╰╯╰╯╰━━┻╯╰┻━━┻━┻━╮╭╯
╱╱╱╱╱╱╱╱╱╱╱╱╱╱╱╱╱╭━╯┃
╱╱╱╱╱╱╱╱╱╱╱╱╱╱╱╱╱╰━━╯
About the script:
This script is an easy-to-use trend indicator, which is based on another popular indicator called "Supertrend" . The basic idea is very simple, i.e. to compute Average True Range(ATR) and use that as the basis for trend detection. The key difference lies in a custom trend detection method, that computes trends across different timeframes and projects them in a table view. The script also tries to improve the behaviour of the existing indicator by highlighting flat regions on the chart, indicating sideways market or potential trend reversals.
How to use it:
You can use it just like any other indicator, add it to your chart and start analysing market trends. Results can be interpreted as follows.
Indicator output is currently made up of two main components:
>> Trend Table:
Appears at the bottom right of your screen
Contains trend indicator for 9 different timeframes
Timeframes can be adjusted using indicator settings panel
Green Up Arrow --> Up Trend
Red Down Arrow --> Down Trend
>> Enhanced Supertrend:
Shows up as a line plot on the chart
Green line indicates up trend
Red line indicates down trend
White regions indicates slow moving markets or a potential trend reversal
Indicator can be used on any timeframe, it provides a view of current and historical market trend
Can be used as an indicator for entering/exiting trades
Can be used to build custom trading strategies

The Ganesh TrendThe Ganesh Trend is an indicator developed by Ganesh to help Traders to identify potential trend showing candle .This indicator identifies bullish and bearish candle with some specific rules. This gives fair idea of direction of market .It is very helpful if you use it on Nifty 50 index . Candlestick developed by me is my original work . It is very helpful for new traders looking for proper entry and exit . It has stop loss and target as well . red dot shows the stop loss and green dot shows the target . taking 2-3 trades a day is good . Thank You . NSE:NIFTY

Immediate Trend - VHXIMMEDIATE TREND - VULNERABLE_HUMAN_X
This indicator is used to identify the immediate trend in the market.
When a Short Term High (STH) is engulfed and closed above, we consider that as a bullish trend.
And Similarly, when a Short Term Low (STL) is engulfed and closed below, we consider that as a bullish trend.
STH - A candle that is higher than the one candle towards it's left and one candle towards it's right.
STL - A candle that is lower than the one candle towards it's left and one candle towards it's right.
HOW TO USE:
1. Do not take trades purely based on the immediate trend showcased by the indicator. Rather, use them as confluence with your trading strategy.
2. When you are expecting price to reverse at your point of interest (Denamd/Supply zone), this indicator can help you predict the reversal by showcasing the current trend.
3. Using this indicator you can travel the trend as long as there is a change of trend predicted by this indicator.

EURUSD COT Trend StrategyThis is a long term/investment type of strategy designed to have a good idea about where the big trend direction is headed.
Its logic, its made entirely on the COT report, mainly from looking into the net non comercial positions aka the speculators.
For bullish trend we look that the difference between long non comercial vs short non comercial is higher than 0
For bearish trend we look that the difference between long non comercial vs short non comercial is lower than 0.
This is mainly as an educational tool, for a full strategy, I recommend implement other things into it, like technical analysis or risk management.
If you have any questions, please let me know !

Trend Following based on Trend ConfidenceThis is a Trend Following strategy based on the Trend Confidence indicator.
The goal of this strategy is to be a simple Trend Following strategy, but also to be as precise as possible when it comes to the question 'how confident are we that a linear trend is ongoing?'. For this we calculate the 'confidence' of a linear trend in the past number of closing prices. The idea of this strategy is that past a certain confidence, the ongoing linear trend is more likely to continue than not.
Trend Confidence:
The Trend Confidence shows us how strong of a linear trend the price has made in the past number (given by Length parameter) of closing prices. The steepness of the price change makes the Trend Confidence more extreme (more positive for an uptrend or more negative for a downtrend), and the deviation from a straight line makes the Trend Confidence less extreme (brings the confidence closer to 0). This way we can filter out signals by wild/sudden price moves that don't follow a clear linear trend.
Math behind the Trend Confidence:
A linear fit is made on the past number of closing prices, using Ordinary Linear Regression. We have the steepness of the linear fit: b in y=a+bx . And we have the standard deviation of the distances from the closing prices to the linear fit: sd . The Trend Confidence is the ratio b/sd .
Entries and Exits:
For entry and exit points we look at how extreme the Trend Confidence is. The strategy is based on the assumption that past a certain confidence level, the ongoing linear trend is more likely to continue than not.
So when the Trend Confidence passes above the 'Long entry" threshold, we go Long. After that when the Trend Confidence passes under the 'Long exit' threshold, we exit. The Long entry should be a positive value so that we go Long once a linear uptrend with enough confidence has been detected.
When the Trend Confidence passes below the 'Short entry' threshold, we go Short. After that when the Trend Confidence passes above the 'Short exit' threshold, we exit. The Short entry should be a negative value so that we go Short once a linear downtrend with enough confidence has been detected.
Default Parameters:
The strategy is intended for BTC-USD market, 4 hour timeframe. The strategy also works on ETH-USD with similar parameters.
The Length is arbitrarily set at 30, this means we look at the past 30 closing prices to determine a linear trend. Note that changing the length will change the range of Trend Confidence values encountered.
The default entry and exit thresholds for Longs and Shorts do not mirror each other. This is because the BTC-USD market goes up more heavily and more often than it goes down. So the ideal parameters for Longs and Shorts are not the same.
The positive results of the strategy remain when the parameters are slightly changed (robustness check).
The strategy uses 100% equity per trade, but has a 10% stop loss so that a maximum of 10% is risked per trade.
Commission is set at 0.1% as is the highest commission for most crypto exchanges.
Slippage is set at 5 ticks, source for this is theblock.co.

The Systems Lab: PRX StrategyLike the PRX Indicator (which is also available) this PRX Strategy includes all the elements necessary to run the PRX Trading System or to incorporate any of its elements into your own analysis. But since this is a strategy it also includes all of the system entry and exit orders which allows them to be displayed on the charts and backtested in different configurations to see how specific configurations of the system could have performed in the past.
The primary concept is the identification of trends by way of a customized PSAR (Parabolic Stop and Reverse) calculation that uses linear regression to reduce market noise and highlight trends for longer using a method pioneered by Dr Ken Long. This means that price can penetrate the PSAR dots without causing a trend reversal to occur (flipping the dots over to the opposing side) which would normally occur with the traditional PSAR idea.
The intent is to help identify and stick with trends longer, adapt to changes in volatility by using linear regression as a noise filter and potentially capture large outlier moves. A linear regression curve is plotted as well in order to help identify when a change in trend will occur by it crossing the PSAR dots.
In order to make the trend as clear as possible the bars can be colored as either up-trend or down-trend with user selectable colors.
A moving average filter is also included as a longer term market condition filter in order to avoid periods when the market is against this average which is an inherent part of the system.
The strategy is currently long only (though we’re working on the short side) and includes standard entries along with a trailing stop using the customized PSAR. It also includes multiple options to re-enter with an existing trend if the trailing stop is hit but the trend remains in place.
Multiple parameters are available for customisation including the Linear Regression length, the Moving Average Filter lookback, enabling of the re-entry and continuation entry signals as well as a date range filter for more specific and repeatable backtesting over different markets and timeframes.
Risk Management is at the core of our system design principles and as such we set and limit the loss for every trade (which is also configurable as a parameter that defaults to $100/trade) and also trail the stop to both reduce risk and capture profit. The position size is calculated automatically and is volatility adjusted based on the initial stop.
Finally, there is a custom dashboard which shows all the relevant details for the current trade at a glance on the chart such as entry, initial stop (size and price), current trailing stop level and P/L in units of R-multiples (’R’ being the initial risk on the trade).
