3SMAThis script plots three Simple Moving Averages instead of just one.
Support me going through grad school!
www.linkedin.com
BTC tip jar: 1Mv1s7nLaTsRoLai5WXEGg8doisXuiPUXy
ETH tip jar: 0x6113DDD23D0D5aCad3d1f8640A8A571E9Cb86cB8
LTC tip jar: LYvyoqTSWxa22TQw3E7818xy4AfYNi6xcm
BCH tip jar: 1GC7oZ7MhLkamKCDdZFnUfV21SKWq84VdY
Prosta średnia krocząca (SMA)


Log-space Simple Moving Average (Set of 3)For convenience, bundles 3 moving averages at 50, 100, and 200

Four Simple Moving AveragesProvides four simple moving averages in one indicator instead of having to add 4 separate indicators to the charts

emasma alertsSame as strategy emasma (crossover between EMA13 and SMA30), but can be used for creating alerts


Triple Log-scale MA (Binance style)A combo of 3 MAs for traders who grew accustomed to using Binance MA settings
TSMA by Binko121Triple simple moving average. Use this to plot three averages with a single indicator instead of three individual ones.
Defaults are configured for 50, 100 and 200 interval averages. Adjust interval lengths to your desires.


Triple Moving AveragesVery basic, just allows for 3 different moving averages in one indicator. Set the defaults to 50, 100 and 200 day, but numbers and colors can be adjusted to taste. Mashed this together from what I found online for a few people who were interested in having this in a community I belong to. Shout out to the Data Dash community!
[naoligo] 12x MA DT (5, 15, 30 & 60)This indicator is based on "Generic 8x MA Plotter", by @LazyBear.
It is also based on my own indicator "10x MA (H, D, W, M)", which is good for Swing Trading and/or Position.
This one is focused in daytrade and it will plot three Moving Averages based on current time interval (under 5 minutes) and nine based on chosen periods by 5, 15, 30 and 60 minutes. You will be able to see where is, for example, a 50 period's SMA of 15 minutes when using a 2 minutes time interval chart. I find it very useful to analyze, in a snap, possible price ranges and enter/exit points. All reference values are from setups known and used by daytraders.
you can choose between EMA or SMA (default: SMA) for each time interval, that are distributed in:
3x MA current time interval;
3x MA 5 minutes;
2x MA 15 minutes;
2x MA 30 minutes;
2x MA 60 minutes.
I've tried to keep the code as simple as possible, so you can increase the number of MA or modify the type for each time interval.
Cons: Use it wisely, because if you choose to plot all the 12 Moving Averages, it will may consume a lot of your navigator resources.
Enjoy!

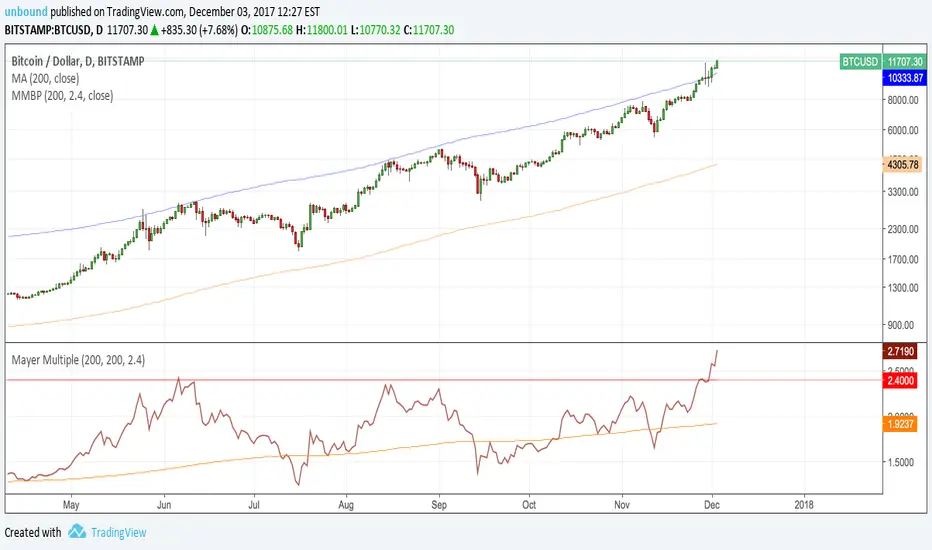
Mayer Multiple v2.0 - Klahr ThresholdThis is a simple update to the Mayer Multiple script by Unbound , which charts an indicator created by Trace Mayer and popularized by Preston Pysh.
The original post identified any price below 2.4x the 100-day MA as the BTC buy threshold. While the logic there is historically sound, it does not account for the fact that the BTC trend is parabolic in nature. With that in mind, I've attempted to update the 2.4x multiple to react based on the moving average of the Mayer Multiple itself. To do so, I simply found the number that, when added to the MM moving average, historically hit the 2.4x multiple during periods of low volatility. This turns out to be 1.17.
The green line represents the Klahr Threshold (is it obnoxious if I call it that? I've always wanted an indicator named after me). As you can see from the above chart, it hovers around 2.4x in late 2012 to early 2013, rises above it until mid 2014, and then stays below until 2016. It then stays almost exactly at 2.4x until April 2017, when it rises significantly above it for the first time since July 2014. The convergence in late 2012 and 2016-2017 is what leads me to believe that this should be the basis for the updated threshold.
It's entirely possible that there's a more robust method of calculating a reactive threshold (or a different number that should be added to the multiple's MA), but I think this is a good first step in refining the multiple to withstand the test of time.

Mayer MultipleFollowing Preston Pysh's "Bitcoin Mayer Multiple" study, I made this simple script to plot the Mayer multiple by calculating the ratio between bitcoin price and its 200-day moving average. It also plots the moving average of ratio itself.
DepthHouse - Moving Average ChannelsThe indicator Moving Average Channels was created for experimental purposes due to the parabolic moves BTC has made in the recent past.
How it works:
The basis, or center line, is a standard moving average that is set by the user.
The bands are then a customizable percentage of the basis.
Which based on the settings, could serve as possible support and resistance.
DepthHouse – Moving Average Channels has been published for you all to see and try for yourselves.
Maybe this indicator has uses elsewhere? If you find something feel free to post it in the comments below!
If you like this indicator, please drop a like or comment!
They are very much appreciated!
Be sure to go to my profile and check out my other indicators!

Multi SMA'sRepublished: The original script violated house rules by including an external link to Backtest Rookies.
Background
This is a simple “multi” SMA indicator so that multiple SMA’s can be monitored whilst only using a single indicator slot. It also has a couple of features that let you mix time frames and de-clutter the chart.
The code is open for anyone to modify and a copy
About the Indicator
Although the indicator does nothing more than it says on the tin, There are a couple of points worth mentioning:
The indicator will let you view up to 4 SMA’s
You can set the period for each SMA independently
You can set the resolution for each SMA independently (So you can see the see the daily SMA level when on the 15-minute chart for example)
Each SMA can be turned on/off independently to avoid clutter.
Screenshot - Default Settings
