TWS Pivot Points FibsPivot Points with Fibonacci
Day, Week, Month. Year Time Frames
0% to 200%
What is a Pivot Point?
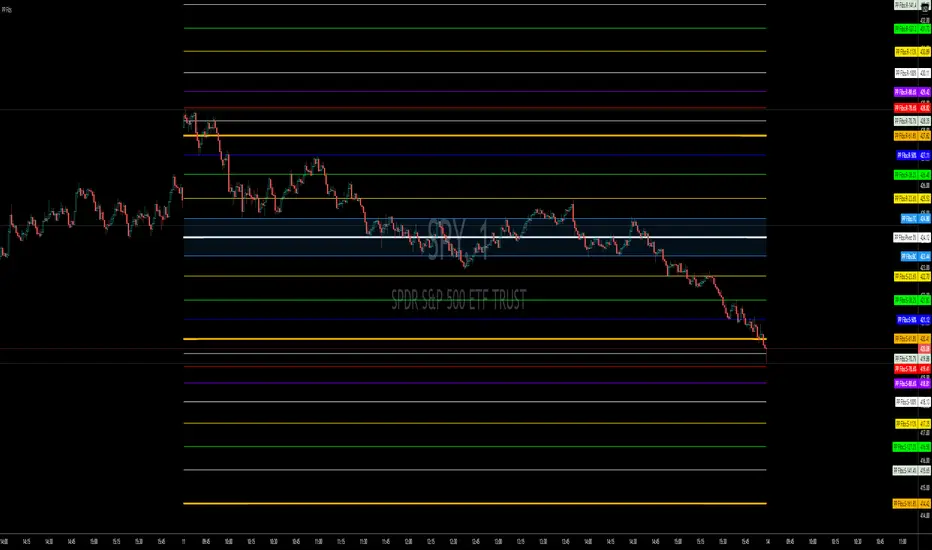
A pivot point is a technical analysis indicator, or calculations, used to determine the overall trend of the market over different time frames. The pivot point itself is simply the average of the high, low and closing prices from the previous trading day. On the subsequent day, trading above the pivot point is thought to indicate ongoing bullish sentiment, while trading below the pivot point indicates bearish sentiment.
The pivot point is the basis for the indicator, but it also includes other support and resistance levels that are projected based on the pivot point calculation. All these levels help traders see where the price could experience support or resistance. Similarly, if the price moves through these levels it lets the trader know the price is trending in that direction.
When the price of an asset is trading above the pivot point , it indicates the day is bullish or positive.
When the price of an asset is trading below the pivot point , it indicates the day is bearish or negative.
The indicator typically includes four additional levels: S1, S2, R1, and R2. These stand for support one and two, and resistance one and two.
Support and resistance one and two may cause reversals, but they may also be used to confirm the trend. For example, if the price is falling and moves below S1, it helps confirm the downtrend and indicate a possible continuation to S2.
All levels are based on Fibonacci
Wyszukaj w skryptach "pivot"
Pivot Points High Low MTF [Anan]█ OVERVIEW
Pivot Points High Low with Multi Time Frames support and bull/bear signal depends on pivot average
█ FEATURES
- Fully control of pivot (Source / Length Left / Length Right)
- Show HH, LL, LH, HL price on candles
- Show Avg Pivot High Low.
- Show Bull/Bear Labels.
- Control of signal accuracy (default: 0.5%)
- Show Pivot High Low Levels as a Fractal Chaos Channel.
- Multi-timeframe Table with support of Pivot High Low and pivot Average.
- BreakOut and BreakDown Labels in the table.
- Full control of displaying any row or any column.
- Full control of Table position and Size and Colors.

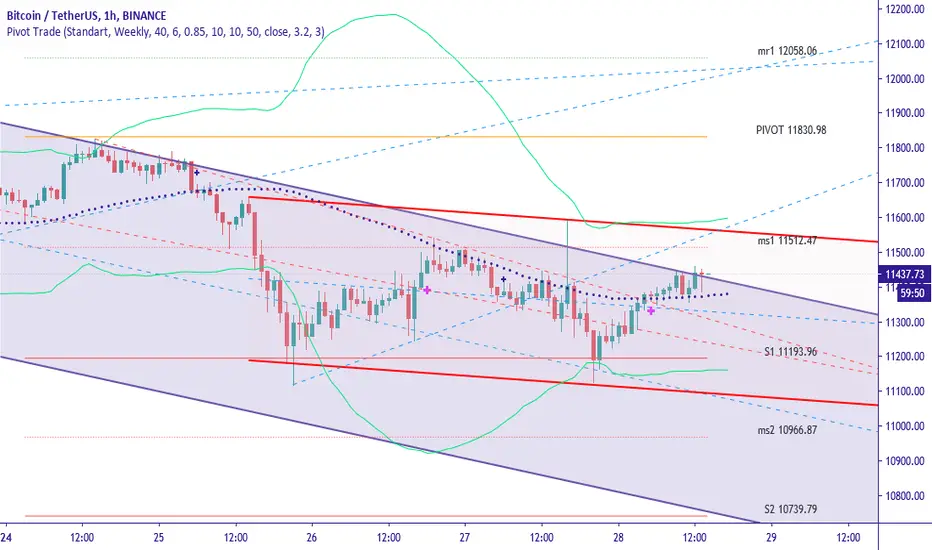
Pivot TradeThis study contains:
- A complete set of pivot calculation. Standart, Fibonacci, Woodie, Camarilla
- Standart Pivot with extended support and resistance levels.
- ALMA a new generation moving average indicator which succesfull to follow trend changes.
- System28 EMA Based trend follower. (Thanks to great master Ali Ömür)
- Auto Trend Lines drawing tool with pivot highs and lows.
- Alarm function on pivot levels.
How to Use :
UPTREND
Orange cross points to an uptrend,
Fuschia cross confirms uptrend.
DOWNTREND
Black cross points to an donwtrend,
Navy cross confirms uptrend.
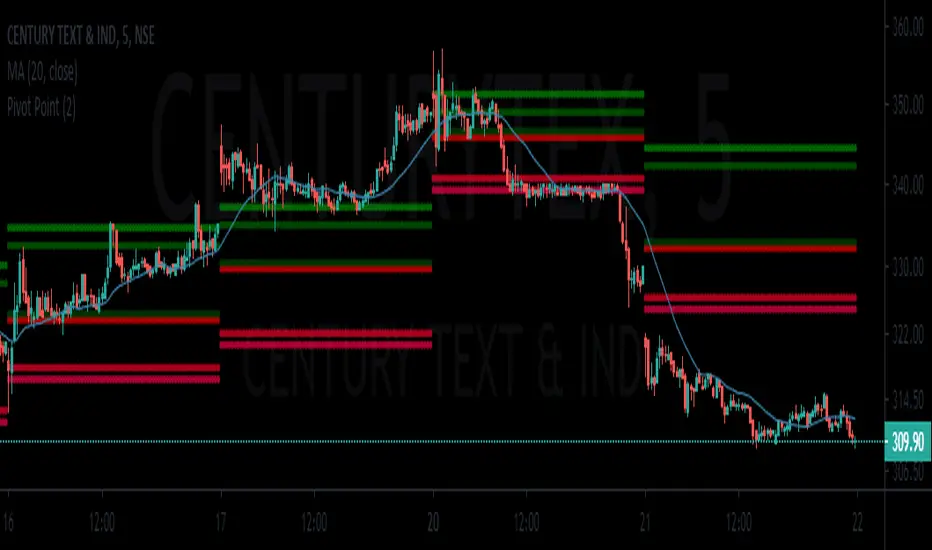
Liens Pivot PointsPivot points script with alerts
What is a Pivot Point?
A pivot point is a technical analysis indicator, or calculations, used to determine the overall trend of the market over different time frames. The pivot point itself is simply the average of the high, low and closing prices from the previous trading day. On the subsequent day, trading above the pivot point is thought to indicate ongoing bullish sentiment, while trading below the pivot point indicates bearish sentiment.
The pivot point is the basis for the indicator, but it also includes other support and resistance levels that are projected based on the pivot point calculation. All these levels help traders see where the price could experience support or resistance. Similarly, if the price moves through these levels it lets the trader know the price is trending in that direction.
When the price of an asset is trading above the pivot point, it indicates the day is bullish or positive.
When the price of an asset is trading below the pivot point, it indicates the day is bearish or negative.
The indicator typically includes four additional levels: S1, S2, R1, and R2. These stand for support one and two, and resistance one and two.
Support and resistance one and two may cause reversals, but they may also be used to confirm the trend. For example, if the price is falling and moves below S1, it helps confirm the downtrend and indicate a possible continuation to S2.
This script has alerts for all the pivot levels and two other alerts. one for all levels ( any cross ), one for all levels except P ( any cross except P), one for all levels except S1, S2 and P ( any cross except p,s1,s2)

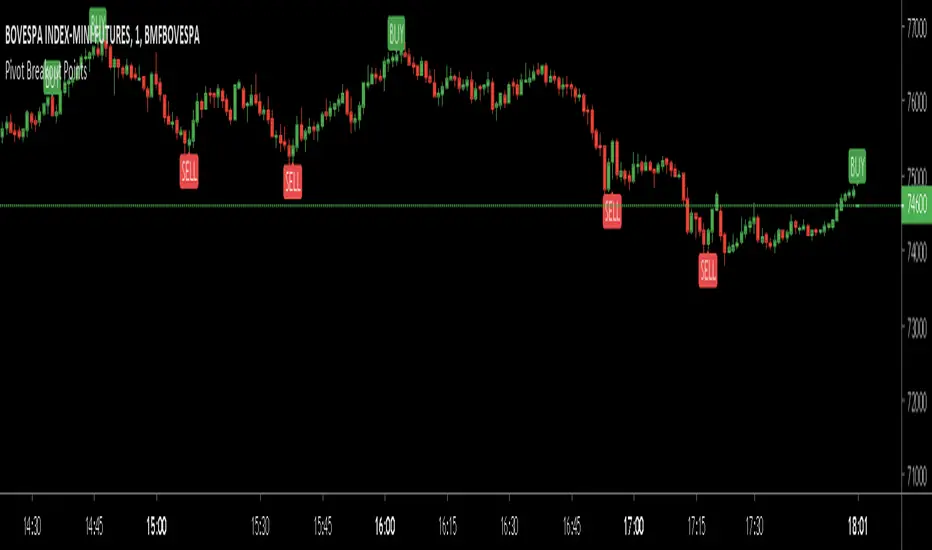
Pivot Breakout Points This script highlights pivot points during strong trend by combining the RSI Indicator and the TRIX Indicator. It's intended to help traders analyze how strong the trend is and the overall feeling about the asset.
BUY means that the overall trend is Bullish, whether SELL means that the overall trend is bearish based on the combination of the indicators listed above.
Pivot Reversal Strategy - FIGS & DATES 2.0Simple Pivot Reversal Strategy with some adding settings.
Date Range: To test over specific market conditions.
Initial Capitol: $10K - This is a more realistic representation of funds used this strategy (for me anyway). The default of $100K can give different results (usually better) than when using a smaller balance.
Order Size: 100% Equity - These trend following strategies typically used this way, going all in each direction.
Commission: .075% - It's always disheartening to think you've found a ridiculously good setting, and then realize you forgot to add the commission.
All of these settings can be changed, but it's easier for me (and more fool proof) to have them set as default.

Pivot PricesThis is a pivot indicator that shows the lows and highs of the instrument according to the timeframe you choose to look from. Play with the setting to fit best with your strategy, use this to confirm trend or scalp with other indicators. All props to the Moderator Team that tuned this indicator to work properly.


Pivot Boss EMASFrank Ochoa concept of Pivot based EMAs.
Changes color based on the position of fast and slow PEMAs.
Default values are 21,34,55 (Fibonacci numbers)
Ideal way of usage is to use in conjunction with PEMA Oscillator which I had posted few days back.

Pivot Point Moving AveragesThis indicator contains two simple moving averages that is calculated from the pivot point rather than the closing price. This indicator is described in detail in chapter 6 of the book Candlestick and Pivot Point Trading Triggers: Setups for Stock, Forex, and Futures Markets by John L. Person.

Volume Pivot BreakoutVolume breaks its MA. Price touches or goes below pivot then closes above it. Buy on purple and blue.

PivotBoss Previous HLCThis Indicator showing the Previous High/Low/Close for Two Relationship Time Frame


PivotsIf you know the Murrey Math Lines that you want to transfer to Trading View, just enter the +2/8 and +1/8 numbers and all 13 lines will be drawn for you.


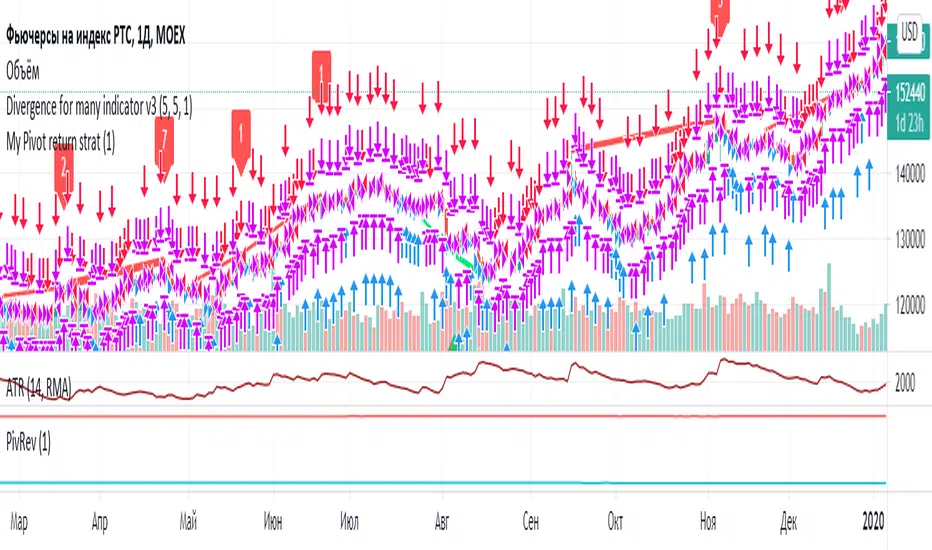
Pivot reverseВозвраты к средней пивот по фьючам по статистике с конца 2011 года:
Ri 72% возвращаются к зеленому в первый день, 14% еще в течение следующих трех;
Si 69% и 14%;
Br 72% и 14%
Gd 73% и 13%.


PP SupRes ChannelPivot points version of our channel strategy, incorporating any or all of the standard PPs commonly available.
V42: Released for debugging. Added passcode due to TV policy change regarding invite-only scripts (sorry...check for a public indicator-only version to be released soon).
