Pivot Pulse [BreakoutOrFakeout]Pivot Pulse
What It Does
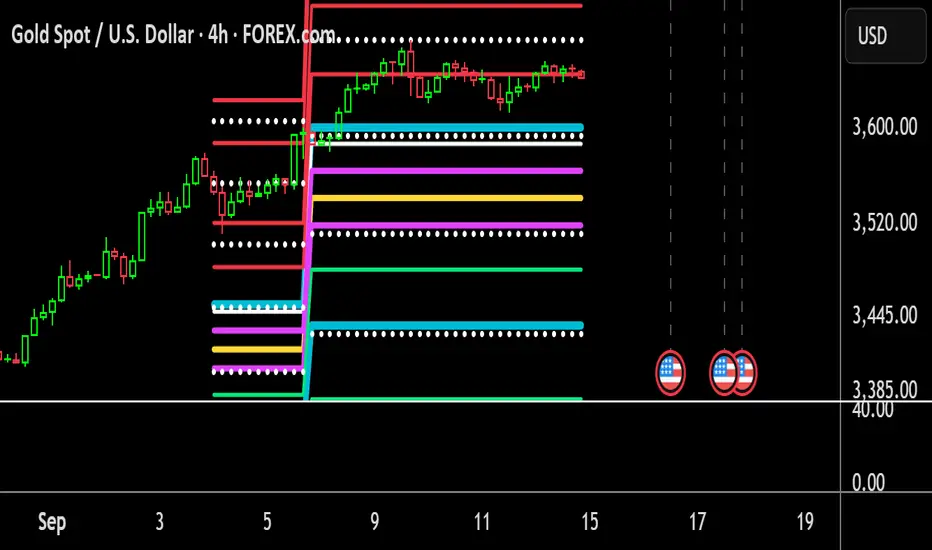
Automatically identifies and visualizes key support and resistance levels using pivot point analysis. Creates clean, professional zones where price is likely to react, making it easy to spot potential reversals and breakouts at a glance.
Key Features
🎯 Smart Pivot Detection
Automatically finds significant highs and lows
Adjustable sensitivity for different trading styles
No manual drawing required
📊 Dynamic Zone Visualization
Clean gradient zones show bounce ranges
Red zones for resistance, green for support
Adjustable zone width for precision control
⚡ Breakout Alerts
Yellow triangles mark zone breakouts
Bar highlighting on breakout candles
Built-in alert conditions
✨ Minimalist Design
Shows only the most relevant levels
Ultra-clean visual presentation
Works seamlessly on all timeframes
How to Use
Zone Trading: Enter trades when price touches zones, exit at opposite zone
Breakout Confirmation: Wait for yellow signals when price breaks zones
Risk Management: Place stops just outside zone boundaries
Multi-Timeframe: Check higher timeframes for stronger levels
Settings
Pivot Sensitivity (5-20): Lower = more sensitive, more frequent levels
Zone Width (0.1-1.0%): Adjust for market volatility
Visual Options: Toggle zones, lines, and breakout signals
Best Practices
✅ Works best in ranging markets for zone bounces
✅ Combine with volume for breakout confirmation
✅ Use higher timeframes for stronger levels
✅ Watch for multiple touches (stronger levels)
Visual Guide
🔴 Red = Resistance Zone (potential selling area)
🟢 Green = Support Zone (potential buying area)
🟡 Yellow = Breakout Signal (momentum shift)
Why This Indicator?
Unlike complex indicators that clutter your chart, Pivot Pulse focuses on what matters: clear levels where price actually reacts. The zone-based approach accounts for real market behavior where support and resistance are areas, not exact prices.
Perfect for:
Day traders needing quick level identification
Swing traders planning entries and exits
Beginners learning support/resistance concepts
Anyone wanting cleaner, more professional charts
⚠️ DISCLAIMER: For educational purposes only. Trading involves substantial risk of loss. Past performance does not guarantee future results. Always use proper risk management and never risk more than you can afford to lose.
Wyszukaj w skryptach "pivot"

Pivot Reversal strategy long onlyPivot Point Reversal Strategy
Pivot point reversal strategy is based on the first support level’s price action during the bullish trend and the first resistance level during the bearish trend . Traders follow the main trend and enter into the trade after reversal analyzing pivot point levels.
This version is an upgraded version, combining the initial pivot point reversal strategy together with one of the most accuracy moving average in my opinion for day trade, the Least square moving average.
At the same time I applied an option to backtest using a date range and a leverage calculator.
The default options are optimized for BTC /USDT 2H charts, using 0.1% comission fee.
If you have any questions, let me know

Pivot Weighted Moving AveragePivot points often act as magnets for price action. The Pivot Weighted Moving Average takes those important levels and integrates them as a weighting function into a moving average. Users can choose the level of weighting they would like to use; the higher the weighting level, the more influence the pivot points will have on the moving average. The Pivot Weighted Moving Average is a great tool for determining trend direction and for signaling dynamic support and resistance levels.

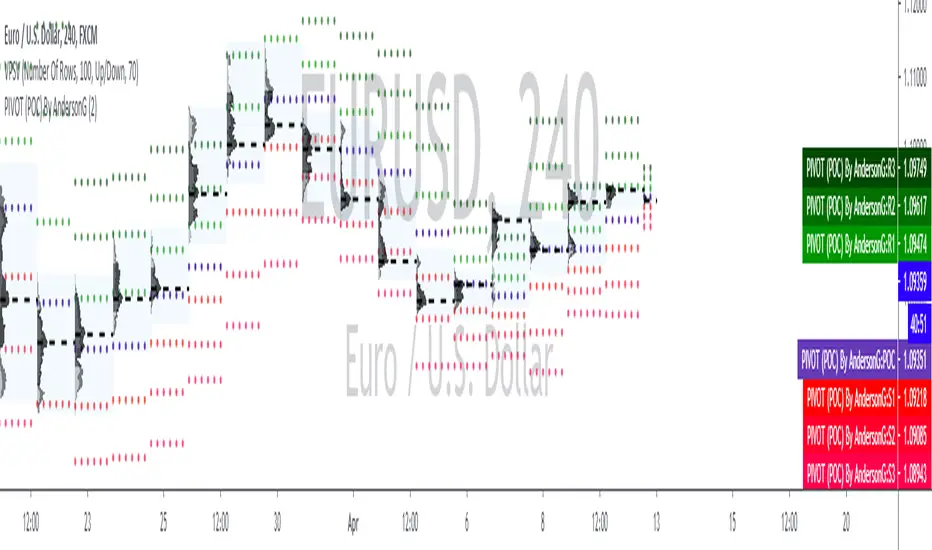
PIVOT (POC)By AndersonGPIVOT (POC) By AndersonG
DAILY...
The pivot point itself is simply the average of the high, low and closing prices from the previous trading day. On the subsequent day, trading above the pivot point is thought to indicate ongoing bullish sentiment, while trading below the pivot point indicates bearish sentiment.
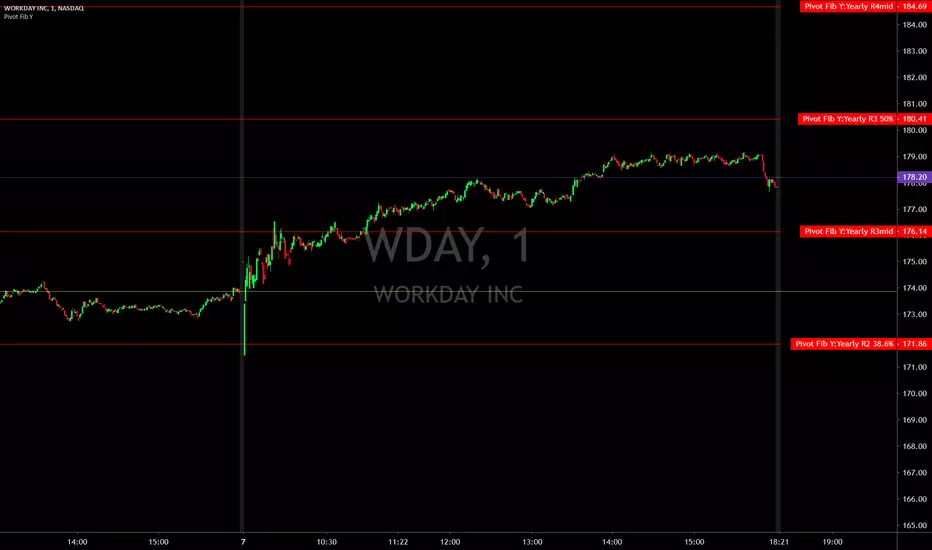
Pivot Points with Fibonacci YearlyPivot Points with Fibonacci
Yearly only
What is a Pivot Point?
A pivot point is a technical analysis indicator, or calculations, used to determine the overall trend of the market over different time frames. The pivot point itself is simply the average of the high, low and closing prices from the previous trading day. On the subsequent day, trading above the pivot point is thought to indicate ongoing bullish sentiment, while trading below the pivot point indicates bearish sentiment.
The pivot point is the basis for the indicator, but it also includes other support and resistance levels that are projected based on the pivot point calculation. All these levels help traders see where the price could experience support or resistance. Similarly, if the price moves through these levels it lets the trader know the price is trending in that direction.
When the price of an asset is trading above the pivot point , it indicates the day is bullish or positive.
When the price of an asset is trading below the pivot point , it indicates the day is bearish or negative.
The indicator typically includes four additional levels: S1, S2, R1, and R2. These stand for support one and two, and resistance one and two.
Support and resistance one and two may cause reversals, but they may also be used to confirm the trend. For example, if the price is falling and moves below S1, it helps confirm the downtrend and indicate a possible continuation to S2.
This Script includes the Mid Pivot Points , All levels are based on Fibonacci
Pivot Points with Fibonacci QuarterlyPivot Points with Fibonacci
Quarterly only
What is a Pivot Point?
A pivot point is a technical analysis indicator, or calculations, used to determine the overall trend of the market over different time frames. The pivot point itself is simply the average of the high, low and closing prices from the previous trading day. On the subsequent day, trading above the pivot point is thought to indicate ongoing bullish sentiment, while trading below the pivot point indicates bearish sentiment.
The pivot point is the basis for the indicator, but it also includes other support and resistance levels that are projected based on the pivot point calculation. All these levels help traders see where the price could experience support or resistance. Similarly, if the price moves through these levels it lets the trader know the price is trending in that direction.
When the price of an asset is trading above the pivot point , it indicates the day is bullish or positive.
When the price of an asset is trading below the pivot point , it indicates the day is bearish or negative.
The indicator typically includes four additional levels: S1, S2, R1, and R2. These stand for support one and two, and resistance one and two.
Support and resistance one and two may cause reversals, but they may also be used to confirm the trend. For example, if the price is falling and moves below S1, it helps confirm the downtrend and indicate a possible continuation to S2.
This Script includes the Mid Pivot Points , All levels are based on Fibonacci

Pivot Points with Fibonacci MonthlyPivot Points with Fibonacci
Monthly only
What is a Pivot Point?
A pivot point is a technical analysis indicator, or calculations, used to determine the overall trend of the market over different time frames. The pivot point itself is simply the average of the high, low and closing prices from the previous trading day. On the subsequent day, trading above the pivot point is thought to indicate ongoing bullish sentiment, while trading below the pivot point indicates bearish sentiment.
The pivot point is the basis for the indicator, but it also includes other support and resistance levels that are projected based on the pivot point calculation. All these levels help traders see where the price could experience support or resistance. Similarly, if the price moves through these levels it lets the trader know the price is trending in that direction.
When the price of an asset is trading above the pivot point , it indicates the day is bullish or positive.
When the price of an asset is trading below the pivot point , it indicates the day is bearish or negative.
The indicator typically includes four additional levels: S1, S2, R1, and R2. These stand for support one and two, and resistance one and two.
Support and resistance one and two may cause reversals, but they may also be used to confirm the trend. For example, if the price is falling and moves below S1, it helps confirm the downtrend and indicate a possible continuation to S2.
This Script includes the Mid Pivot Points , All levels are based on Fibonacci

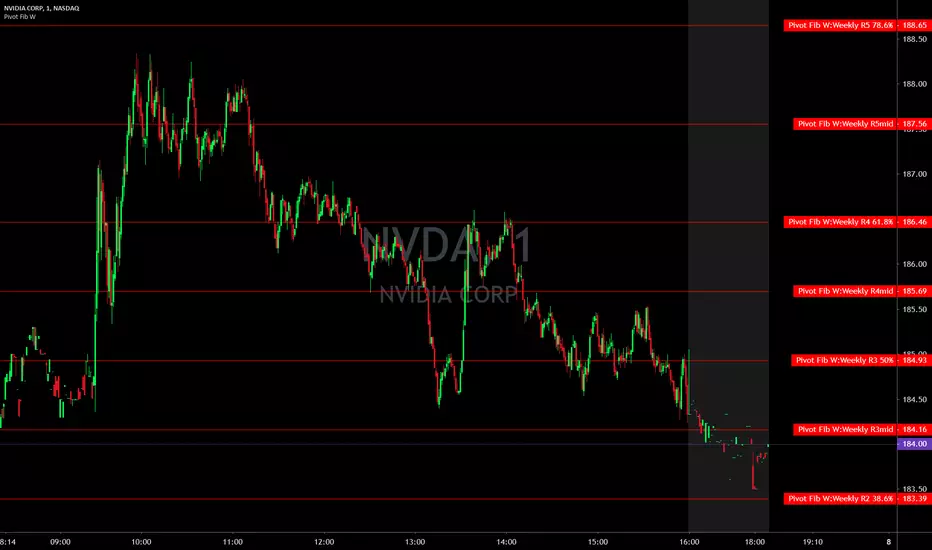
Pivot Points with Fibonacci WeeklyPivot Points with Fibonacci
Weekly only
What is a Pivot Point?
A pivot point is a technical analysis indicator, or calculations, used to determine the overall trend of the market over different time frames. The pivot point itself is simply the average of the high, low and closing prices from the previous trading day. On the subsequent day, trading above the pivot point is thought to indicate ongoing bullish sentiment, while trading below the pivot point indicates bearish sentiment.
The pivot point is the basis for the indicator, but it also includes other support and resistance levels that are projected based on the pivot point calculation. All these levels help traders see where the price could experience support or resistance. Similarly, if the price moves through these levels it lets the trader know the price is trending in that direction.
When the price of an asset is trading above the pivot point , it indicates the day is bullish or positive.
When the price of an asset is trading below the pivot point , it indicates the day is bearish or negative.
The indicator typically includes four additional levels: S1, S2, R1, and R2. These stand for support one and two, and resistance one and two.
Support and resistance one and two may cause reversals, but they may also be used to confirm the trend. For example, if the price is falling and moves below S1, it helps confirm the downtrend and indicate a possible continuation to S2.
This Script includes the Mid Pivot Points , All levels are based on Fibonacci
Pivot Points with Fibonacci DailyPivot Points with Fibonacci
Daily only
What is a Pivot Point?
A pivot point is a technical analysis indicator, or calculations, used to determine the overall trend of the market over different time frames. The pivot point itself is simply the average of the high, low and closing prices from the previous trading day. On the subsequent day, trading above the pivot point is thought to indicate ongoing bullish sentiment, while trading below the pivot point indicates bearish sentiment.
The pivot point is the basis for the indicator, but it also includes other support and resistance levels that are projected based on the pivot point calculation. All these levels help traders see where the price could experience support or resistance. Similarly, if the price moves through these levels it lets the trader know the price is trending in that direction.
When the price of an asset is trading above the pivot point , it indicates the day is bullish or positive.
When the price of an asset is trading below the pivot point , it indicates the day is bearish or negative.
The indicator typically includes four additional levels: S1, S2, R1, and R2. These stand for support one and two, and resistance one and two.
Support and resistance one and two may cause reversals, but they may also be used to confirm the trend. For example, if the price is falling and moves below S1, it helps confirm the downtrend and indicate a possible continuation to S2.
This Script includes the Mid Pivot Points , All levels are based on Fibonacci


Pivot Point Std With CPR,2 EMA,MW S R,P Day H L - by AnanthPivot Point Std With CPR,2 EMA,Monthly Weekly Support Resistance,Previous Day High and Low - by Ananth


Pivot Breakout with Trend ZonesOverview
Pivot Breakout with Trend Zones is a technical analysis indicator that identifies key pivot points and trend direction through dynamic candle coloring. It helps traders visualize breakouts and ongoing trends in real-time.
Key Features
🔍 Pivot Point Detection
Automatically identifies significant high and low pivot points
Customizable left/right bar parameters for sensitivity adjustment
Displays pivot levels as cross-style lines with offset positioning
🎨 Smart Candle Coloring
White candles: Breakout above pivot high (bullish signal)
Black candles: Breakout below pivot low (bearish signal)
Teal candles: Uptrend continuation
Coral Red candles: Downtrend continuation
Optional color fill toggle for customization
📊 Trend Identification
Automatically tracks trend direction after breakouts
Maintains trend state until opposite breakout occurs
Clear visual distinction between breakout and trend-following phases
Input Parameters
Pivot Settings
Left Bars (High/Low): Number of bars to the left of pivot
Right Bars (High/Low): Number of bars to the right of pivot
Display Options
Enable Candle Color Fill: Toggle color visualization on/off
Line Offset: Adjust pivot line positioning (-50 to 0 bars)
How It Works
Pivot Calculation: Uses TradingView's built-in pivothigh() and pivotlow() functions to detect significant turning points
Breakout Detection: Monitors when price closes beyond pivot levels, triggering trend changes
Trend Management: Once a breakout occurs, the indicator maintains the trend direction until a counter-breakout signals reversal
Visual Feedback: Provides immediate color-coded feedback for quick market analysis
Use Cases
Swing Trading: Identify entry points at pivot breakouts
Trend Following: Stay in trades during trend continuation phases
Market Structure: Visualize support/resistance levels and trend changes
Risk Management: Use pivot levels for stop-loss placement
Ideal For
Traders looking for clear visual trend identification
Technical analysts monitoring breakout opportunities
Anyone seeking to combine pivot analysis with trend following strategies
This indicator provides a clean, intuitive way to spot trend changes and follow market momentum with immediate visual feedback through candle coloring.

Pivot Move Ranges█ OVERVIEW
“Pivot Move Ranges” is an indicator that displays only the historical price ranges of moves that match the direction of the current swing.
It measures the price range of each individual swing and draws them as horizontal Δ-boxes positioned at the level of the most recently detected pivot.
The indicator operates with a delay equal to the set pivot detection length – after each new Pivot High, only red Δ-boxes appear showing the sizes of previous downward moves; after each new Pivot Low, only green Δ-boxes appear showing the sizes of previous upward moves. When the swing direction changes, the displayed set of levels instantly switches to the opposite direction.
█ CONCEPTS
The indicator was created to instantly provide the trader with objective, real historical price ranges – perfectly reinforcing classic tools such as Fibonacci extension/retracement, daily/weekly pivots, moving averages, order blocks, or Volume Profile.
It detects classic Pivot High and Pivot Low points:
- New Pivot High → only previous downward moves are shown (red Δ-boxes)
- New Pivot Low → only previous upward moves are shown (green Δ-boxes)
This ensures that at any moment you see only the historical ranges that match the current market direction. Price moves very often repeat themselves – the indicator makes these recurring levels immediately visible and ready to serve as natural reinforcement for other technical analysis tools.
█ FEATURES
- Pivot High / Pivot Low detection with adjustable length (default 12)
- Δ-boxes – thin horizontal lines showing the exact size of previous moves that match the current swing
- Automatic switching of the Δ-box set whenever a new opposite pivot appears
- Memory of the last N moves (default 6, max. 50) – oldest are automatically removed
- Labels showing move size (Δ) and start date/time
- Full color customization (separate for up and down), border and text transparency
- Choice of date format (DD.MM.YYYY or MM/DD/YYYY)
- Small circles marking the exact pivot locations
█ HOW TO USE
Add the indicator to your TradingView chart → paste the code → Add to Chart.
Settings:
- Pivot Length – higher values = fewer but more significant pivots (detected with a delay equal to this length)
- Max Corrections to Keep – how many previous matching moves are displayed at once
- Upward / Downward Box Color – colors of the Δ-boxes
- Box Border Transparency (%) – 0 = solid lines, 50–70 = subtle
- Show Δ Text + Move Start Date – turn labels on/off
Interpretation:
At any given moment the chart shows only the historical ranges of moves in the current direction:
- after a Pivot High → red Δ-boxes = “how far the market previously fell”
- after a Pivot Low → green Δ-boxes = “how far the market previously rose”
█ APPLICATIONS
- Instant reinforcement of technical levels – historical moves matching the current swing direction often coincide with Fibonacci levels, daily/weekly pivots, moving averages, or order blocks
- Fast cluster detection – set a high Max Corrections value (30–50) to see where the largest number of similarly sized moves cluster, then reduce to 6–10 and focus only on the most recent levels
█ NOTES
- On very strong trends, Δ-boxes can be extremely long – this is normal and correct behavior
- Always use as a supporting layer alongside other technical analysis tools

Pivot Points High Low Multi Time Frame + AlertsThis script is a modified version of “Pivot Points High Low Multi Time Frame” for TradingView, enhanced with price alerts when the market reaches or crosses recent pivot levels.
What it does:
Detects Pivot Highs and Pivot Lows based on your chosen timeframe and bar settings.
Draws visual lines and labels at each pivot level for clear identification.
Keeps track of the latest pivot high and low values.
Triggers an alert condition when the price crosses either of those pivots.
Alert conditions included:
🔔 Price Crossed Pivot High — notifies when the price touches or moves above the last pivot high.
🔔 Price Crossed Pivot Low — notifies when the price touches or moves below the last pivot low.
How to use:
Add the script to your chart in TradingView.
Click the Alarm (🔔) icon → choose Add Alert.
Under Condition, select this indicator and pick one of the two alert types.
Choose your preferred alert frequency (Once per bar, Every time, etc.).
Tip: You can also visually see when alerts are triggered — small green and red triangles will appear above or below the bars where the price crosses a pivot.

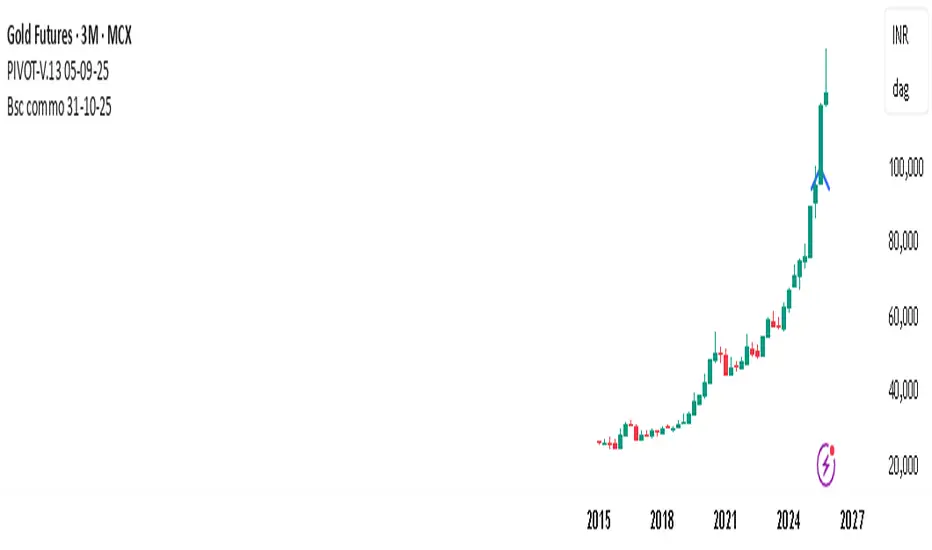
PIVOT-V.13 05-09-25This Pine Script automatically detects pivot levels and generates buy/sell signals based on price action around those pivots. It identifies key support and resistance zones derived from previous period highs, lows, and closes, then marks optimal entry, target, and stop-loss levels on the chart.
The script is designed to assist traders in systematic decision-making using pivot-based strategies.
🔍 Core Features
Automatic Pivot Detection: Calculates and updates pivots in real-time using standard formulas.
Smart Trade Setup:
Buy Signal: Triggered when price action confirms strength above a pivot or resistance level.
Sell Signal: Triggered when price action confirms weakness below a pivot or support level.
Entry, Target & Stop-Loss Levels: Automatically plots potential entry points, stop-loss levels, and take-profit zones based on the nearest pivot structure.
Customizable Settings:
Choose pivot type and timeframe (daily, weekly, or monthly).
Adjust risk ratio, stop size, and confirmation filters.
Enable/disable visual labels or alerts.
Visual Clarity: Clearly marks all pivot levels and trade signals on the chart with colored labels and lines.
🎯 Purpose
This script helps traders quickly identify high-probability entry zones and maintain disciplined trade management by following pre-defined pivot-based rules — reducing emotional bias and enhancing consistency.
PivotBoss Advanced Floor PivotsThis Indicator showing Pivot Range and Support/Resistance Lines for Two Time Frame Relationship
Pivot Points mura visionWhat it is
A clean, single-set pivot overlay that lets you choose the pivot type (Traditional/Fibonacci), the anchor timeframe (Daily/Weekly/Monthly/Quarterly, or Auto), and fully customize colors, line width/style , and labels . The script never draws duplicate sets—exactly one pivot pack is displayed for the chosen (or auto-detected) anchor.
How it works
Pivots are computed with ta.pivot_point_levels() for the selected anchor timeframe .
The script supports the standard 7 levels: P, R1/S1, R2/S2, R3/S3 .
Lines span exactly one anchor period forward from the current bar time.
Label suffix shows the anchor source: D (Daily), W (Weekly), M (Monthly), Q (Quarterly).
Auto-anchor logic
Intraday ≤ 15 min → Daily pivots (D)
Intraday 20–120 min → Weekly pivots (W)
Intraday > 120 min (3–4 h) → Monthly pivots (M)
Daily and above → Quarterly pivots (Q)
This keeps the chart readable while matching the most common trader expectations across timeframes.
Inputs
Pivot Type — Traditional or Fibonacci.
Pivots Timeframe — Auto, Daily (1D), Weekly (1W), Monthly (1M), Quarterly (3M).
Line Width / Line Style — width 1–10; style Solid, Dashed, or Dotted.
Show Labels / Show Prices — toggle level tags and price values.
Colors — user-selectable colors for P, R*, S* .
How to use
Pick a symbol/timeframe.
Leave Pivots Timeframe = Auto to let the script choose; or set a fixed anchor if you prefer.
Toggle labels and prices to taste; adjust line style/width and colors for your theme.
Read the market like a map:
P often acts as a mean/rotation point.
R1/S1 are common first reaction zones; R2/S2 and R3/S3 mark stronger extensions.
Confluence with S/R, trendlines, session highs/lows, or volume nodes improves context.
Good practices
Use Daily pivots for intraday scalps (≤15m).
Use Weekly/Monthly for swing bias on 1–4 h.
Use Quarterly when analyzing on Daily and higher to frame larger cycles.
Combine with trend filters (e.g., EMA/KAMA 233) or volatility tools for entries and risk.
Notes & limitations
The script shows one pivot pack at a time by design (prevents clutter and duplicates).
Historical values follow TradingView’s standard pivot definitions; results can vary across assets/exchanges.
No alerts are included (levels are static within the anchor period).

Pivot Fibonacci TradingWe use fibonacci in many things, why not the Pivot? Hey, it does works, price does reacts to the fibonacci off the pivot.
Pivots are road map for the price, fibonacci are just some stops or gas stations appear on the road, with these additional lines, there's more time for price to think about which way it'd move, therefore, more time for us traders to track and follow.
I know they usually use Daily pivot in H1, Weekly in H4 and Monthly in Daily timeframe, but since there are more lines now, price now needs space to travel between line. I recommend using Weekly Pivot for intraday(H1,...), Monthly for H4 and Yearly for Daily.
I also add some text that shows current day's range in pips (High - Low = range) and compare it to Average Daily Range. I thinks this is helpful if you use it for day trading.
I'll let this as a open sources as you may find something to customize in your own way.
Hope this helps you in someway, community :)
Happy trading!
#Thanks to @Davit on forexfactory for the idea
Pivot & Source Cross StrategyPivot & ZoneCross Strategy V2
A powerful trading script combining Pivot Points, Retracement Zones, and Dynamic Stop-Loss Management. Suitable for beginners and advanced traders.
Introduction
This script enables traders to leverage Pivot Points and retracement zones for precise entry and exit points. Using price crossover detection and customizable stop-loss management, it offers a structured approach to trading various market conditions.
Features
Pivot Point Calculations: Select between Classic or Fibonacci methods for precise support and resistance levels.
Zone-Based Entry Signals: Identify price crossovers with retracement levels for optimal trade timing.
Customizable Stop-Loss Management: Automatically adjusts stop-loss levels to secure profits or limit losses.
Support for Market or Limit Orders: Choose instant market execution or specific limit entry points.
Flexible Inputs for Sources: Use Source First and Source Second to integrate external indicators like RSI and RSI MA, providing advanced customization options.
Visualization of Key Levels: Easily track retracement zones, Pivot Points, and stop-loss levels directly on the chart.
Configurable Conditions: Tailor entry/exit logic for your trading style.
How to Set Up
Choose Your Higher Timeframe (TIMEFRAME):
This determines the Pivot Points and retracement levels.
Example: Use “D” for daily pivots while trading on lower timeframes.
Select Entry Zone Patterns:
Define the pattern for detecting retracement levels:
xxx: Minor levels (steps of 10).
xx0: Intermediate levels (steps of 50).
x00: Major levels (steps of 100).
Set Entry Conditions for Long and Short Trades:
Activate or deactivate up/down conditions for xxx, xx0, or x00 patterns. Specify the count and range of crosses required for valid signals.
Configure Source Inputs (Source First and Source Second):
Assign external indicators such as RSI and RSI MA to refine entry conditions.
Tip: Adjust RSI settings in its separate indicator to suit your needs.
Select Your Order Type:
Choose between Market orders for instant execution or Limit orders for precision entries. Adjust offset zones for limit orders.
Set Up Stop-Loss Management:
Use dynamic stop-loss patterns with adjustable offsets:
HL: Stop-loss uses high/low levels of the zone.
Close: Stop-loss uses the closing price.
Customize Visualization Options:
Enable or disable xxx, xx0, x00, or 0 levels for cleaner charts. Adjust the display of retracement levels and stop-loss lines.
Apply and Monitor:
Attach the script to your chart, monitor entry/exit signals, and adjust parameters as needed.
How It Works
Calculates Pivot Points based on the chosen method ( Classic or Fibonacci ).
Detects price crossovers with retracement zones to identify potential entry points.
Dynamically adjusts stop-loss levels based on retracement zones and stop-loss patterns.
Supports both market and limit orders with customizable offsets for precise entries.
Allows integration of external sources like RSI for enhanced signal precision.
Important Notes
Use Source First and Source Second to input external indicators like RSI. You can configure RSI settings in its separate indicator to refine signals further.
Always test and optimize parameters before live trading.
Combine this script with your own analysis and proper risk management strategies.
This script is a tool to assist trading decisions but does not guarantee profits. Always trade responsibly.

PivotBoss ADR LevelsBased on Pivot Boss ADR Methodology
Can be used only in Intraday - Hope someone will make it for all TF
All available script in TV do not have scaling at 25%
Due to which price needs to reach at 50% to derive any conclusion
This script solves this issue and can be used in sideways market as it provides scaling at 25 %
Script is original in its way to solve problem in sideways market
PivotsSimply plots pivots found on any timeframe based on length specified.
Supports other timeframes, you choose to display gaps or not, with gaps on the labels may disappear so keep that in mind.
