CryptoGraph StrategizerA complete system to backtest and automate comprehensive trading strategies
═════════════════════════════════════════════════════════════════════════
🟣 How it works
This indicator allows you to use buy & sell signals from external CryptoGraph indicators, and fully backtest these signals in the TradingView strategy tester. After configuring buy & sell signals, the trader can look into exit criteria with this indicator. The indicator offers percentage based an ATR based take profit/stop losses, as well as safety orders (DCA) in order to get a better average entry price.
Once your strategy is fully set up to your desired results, it's possible to set up alerts and connect the indicator through an automation platform ( API connection), to your broker. Alertatron & Wick Hunter auto configuration is included, meaning everything configured in the indicator settings, will automatically be carried out with Alertatron & Wick Hunter syntaxes.
🟣 Features
• Multiple methods of scaling in entries (Multiple DCA/Pyramiding methods). There will be an option to scale up or down your volume per order and distance between orders.
• Multiple methods of determining order sizes. Methods are percentage risk per trade, dollar risk per trade, position size in contracts, position size in percentage and position size in dollar.
• Multiple methods and levels of taking profits and losses. Both percentage based and ATR based take profit and stop loss.
• Option to use external indicator buy/sell signals for entry.
• Visualised liquidation prices in TradingView (both cross and isolated)
• Information panel on chart with additional information regarding your strategy results
• Bot setup directly from indicator inputs tab with Wick Hunter & Alertatron
🟣 How to use
• Choose a symbol that corresponds to your bot pair and exchange
• Pick a chart time frame
• Always use the regular candle type
• Configure your deal start condition
• Configure your profit target
• Use the Take Profit/Stop Loss feature to set a target for profit and loss
• Configure your safety orders
• Check your backtest parameters
•Make sure that the initial capital and order size make sense. Since you can use pyramiding in your strategy with safety orders, the sum of all deals should not be bigger than the initial capital
Wyszukaj w skryptach "bot"

Customizable Non-Repainting HTF MACD MFI Scalper Bot Strategy v2Customizable Non-Repainting HTF MACD MFI Scalper Bot Strategy v2
This script was originally shared by Wunderbit as a free open source script for the community to work with. This is my second published iteration of this idea.
WHAT THIS SCRIPT DOES:
It is intended for use on an algorithmic bot trading platform but can be used for scalping and manual trading.
This strategy is based on the trend-following momentum indicator . It includes the Money Flow index as an additional point for entry.
This is a new and improved version geared for lower timeframes (15-5 minutes), but can be run on larger ones as well. I am testing it live as my high frequency trader.
HOW IT DOES IT:
It uses a combination of MACD and MFI indicators to create entry signals. Parameters for each indicator have been surfaced for user configurability.
Take profits are now trailing profits, and the stop loss is now fixed. Why? I found that the trailing stop loss with ATR in the previous version yields very good results for back tests but becomes very difficult to deploy live due to transaction fees. As you can see the average trade is a higher profit percentage than the previous version.
HOW IS MY VERSION ORIGINAL:
Now instead of using ATR stop loss, we have a fixed stop loss - counter intuitively to what some may believe this performs better in live trading scenarios since it gives the strategy room to move. I noticed that the ATR trailing stop was stopping out too fast and was eating away balance due to transaction fees.
The take profit on the other hand is now a trailing profit with a customizable deviation. This ensures that you can have a minimum profit you want to take in order to exit.
I have depracated the old ATR trailing stop as it became too confusing to have those as different options. I kept the old version for others that want to experiment with it. The source code still requires some cleanup, but its fully functional.
I added in a way to show RSI values and ATR values with a checkbox so that you can use the new an improved ATR Filter (and grab the right RSI values for the RSI filter). This will help to filter out times of very low volatility where we are unlikely to find a profitable trade. Use the "Show Data" checkbox to see what the values are on the indicator pane, then use those values to gauge what you want to filter out.
Both versions
Delayed Signals : The script has been refactored to use a time frame drop down. The higher time frame can be run on a faster chart (recommended on one minute chart for fastest signal confirmation and relay to algotrading platform.)
Repainting Issues : All indicators have been recoded to use the security function that checks to see if the current calculation is in realtime, if it is, then it uses the previous bar for calculation. If you are still experiencing repainting issues based on intended (or non intended use), please provide a report with screenshot and explanation so I can try to address.
Filtering : I have added to additional filters an ABOVE EMA Filter and a BELOW RSI Filter (both can be turned on and off)
Customizable Long and Close Messages : This allows someone to use the script for algorithmic trading without having to alter code. It also means you can use one indicator for all of your different alterts required for your bots.
HOW TO USE IT:
It is intended to be used in the 5-30 minute time frames, but you might be able to get a good configuration for higher time frames. I welcome feedback from other users on what they have found.
Find a pair with high volatility (example KUCOIN:ETH3LUSDT ) - I have found it works particularly well with 3L and 3S tokens for crypto. although it the limitation is that confrigurations I have found to work typically have low R/R ratio, but very high win rate and profit factor.
Ideally set one minute chart for bots, but you can use other charts for manual trading. The signal will be delayed by one bar but I have found configurations that still test well.
Select a time frame in configuration for your indicator calculations.
Select the strategy config for time frame (resolution). I like to use 5 and 15 minutes for scalping scenarios, but I am interested in hearing back from other community memebers.
Optimize your indicator without filters : customize your settings for MACD and MFI that are profitable with your chart and selected time frame calculation. Try different Take Profits (try about 2-5%) and stop loss (try about 5-8%). See if your back test is profitable and continue to optimize.
Use the Trend, RSI, ATR Filter to further refine your signals for entry. You will get less entries but you can increase your win ratio.
You can use the open and close messages for a platform integration, but I choose to set mine up on the destination platform and let the platform close it. With certain platforms you cannot be sure what your entry point actually was compared to Trading View due to slippage and timing, so I let the platform decide when it is actually profitable.
Limitations: this works rather well for short term, and does some good forward testing but back testing large data sets is a problem when switching from very small time frame to large time frame. For instance, finding a configuration that works on a one minute chart but then changing to a 1 hour chart means you lose some of your intra bar calclulations. There are some new features in pine script which might be able to address, this, but I have not had a chance to work on that issue.

BTCUSDTPERP MEGABOT 60min [ALERTS VERSION]BINANCE:BTCUSDTPERP
Hello, this is my alerts version of BTCUSDTPERP MEGABOT 60min
THIS BOT IS ONLY FOR BTCUSDTPERP ON BINANCEFUTURES !!!!!!!!!!!!!!!!!!!!!!!!!!!!!!!!!!!!!!!!!
This configs are only for this pair on this market,
It depends of volume , and others indicator
Bot is making amazing results at configs
TP - 4.5%
SL - 7%
Strategy using 4 indicators :
ADX
RSI
VOLUME
MACD
ADX - makes a solid view to trend without any scam wick :
Long only on green bars
Shorts only on red bars
That's helps my strategy to define a right trend
there is also a orange option for unidentified trends
RSI - value helps strategy to stop trade in right time
When RSI is overbought strategy don't open new longs
also when RSI is oversold strategy don't open new shorts
Volume - volume is the most important indicator for the strategy,
to avoid open trades on flat chart, new trades are open after a strong volume
wicks
MACD - this indicator is for define the trend
So the way this bot is working is simple
when every arguments are confirmed , then strategy open trades
Enjoy !!!

Scalping Trading System bot Crypto and StocksThis is a trend trading strategy scalping bot that can work with any type of market. However I concluded my tests so far with Crypto, Stocks and Forex, and with optimizations always could be found some profitable settings.
Indicators
SImple Moving Average
Exponential Moving Average
Keltner Channels
MACD Histogram
Stochastics
Rules for entry
long= Close of the candle bigger than both moving averages and close of the candle is between the top and bot levels from Keltner. At the same time the macd histogram is negative and stochastic is below 50.
short= Close of the candle smaller than both moving averages and close of the candle is between the top and bot levels from Keltner. At the same time the macd histogram is positive and stochastic is above 50.
Rules for exit
We exit when we meet an opposite reverse order.
This strategy has no risk management inside, so use it with caution !

7-RSI strategyHello, I've only been trying to learn PineScript for two months on my own, here I am posting a version of the strategy for a grid bot with 20 orders, order size 5%, earlier I tried to find something similar, but could not. Perhaps others, those who, like me, are just starting to learn PineScript, will find something useful. In the process of using grid bots, I noticed that the RSI indicator is sufficient, so the strategy uses 7 RSI indicators on different timeframes, but it is not necessary to use all 7, usually 3 is enough, therefore, by default, the RSI values are set to limit so that there is no effect on the settings of others. The step between bot orders is set in the settings. The code can of course be simplified, but it's better for understanding, I think.

Simple and Sinister Scalp BotThis is a dollar cost averaging bot with additional buy algo to ensure you are buying support levels on the time period of your chart.
Signals Generated Based On
RSI
Volume
Cost Basis
Simple Moving Averages
It buys when there is a signal to buy and requires that the price is below your cost basis.
The bot is smart enough to track number of open signals and cost basis.
It features a safety shut off feature based on simple moving averages. This prevents you from opening new trades during market declines. The options are
No Filter
Safe
Safer
Safest
This does not generate a signal to sell based on an algorithm. This generates a sell signal based on your cost basis and open entries. It will not generate a sell signal unless it hit your target profit. The script will continue to DCA down until you are out of the hole. You can configure the Take Profit from the options menu.
The script generates labels in realtime and calculates current position profit and what your profit would have been if you used the bot from the start of the year with the settings set as they are in the options menu.
Authors Notes:
This was designed to work for both stocks and crypto.
Best time period to use it on varies depending on the ticker. Because it displays how much profit would be made in realtime, please adjust the settings/chart period and see what settings work best for that stock/crpto symbol. Please note that past performance does not dictate future results.

Stochastic TrendDear community,
I've made another simple trading bot for you to use. This bot is based on the Stochastic Oscillator. It only produces long trades currently.
I changed the oscillation period to a much longer one, which in turn creates opportunities to trade long term trends.
The bot goes long when the Entry lines is crossed from below and it will close its long position once the Exit line has been crossed from above.

RSI Mean Reversion Bot StrategyI started developing this strategy as a way to plug in and test values before defining them in the bots on 3Commas, Coinrule, and Quadency. None of those bots performed the same way my script did and I kept working on it until the strategy finally yielded the same simulated results when paired with the Tradingview bot on Quadency. I looked at all the different RSI strategies already published and saw what each was missing and changed it in mine to make it better:
1. Backtest an actual timeframe by date and time
2. Define the RSI price source
3. Fully manipulate the RSI length
4. Define a stop loss that works
5. Pick Long or Short, or both, based on market conditions. Or compare side by side to decide which you want.

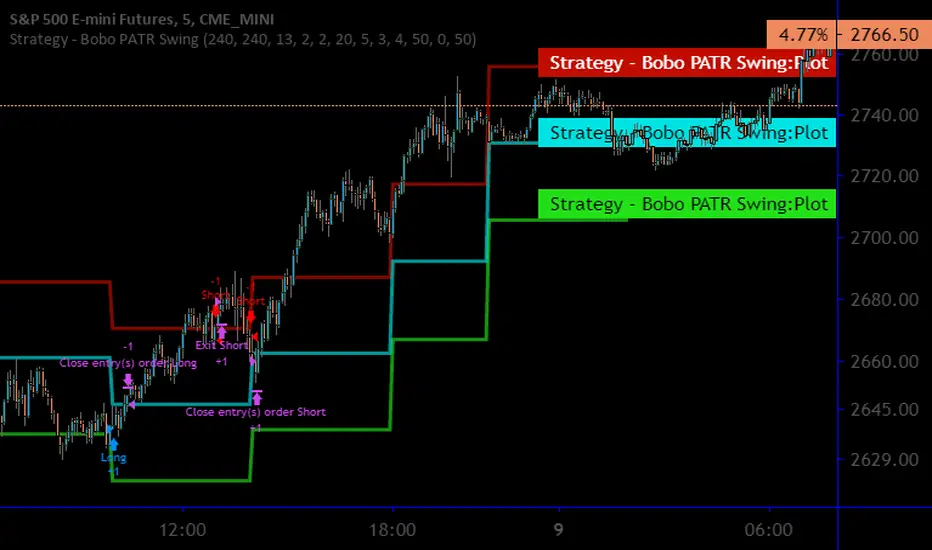
Strategy - Bobo Intraday Swing Bot with filtersThis is an adapted version of my swing bot with additional filters that mean it works quite well on lower timeframes like 1min, 5 mins as long as you adjust the setting accordingly (reduce pivot timescale, band width)
Entry conditions are filtered by an invisible trend calculation running in the background so the bot doesn't repeatedly try and fail to fade a strong trend. It has just about everything you should need for basic use, stop losses and targets, automatically close trade at pivot.
I get good results on rangey instruments like major indices such as SPX / ES that kind of thing. Make sure you understand the minmum tick value of an index so the stop setting on the bot work properly
Hope it's useful!
UT Bot AlertsUT Bot indicator was initially developer by @Yo_adriiiiaan
The idea of original code belongs @HPotter
These are v4 alerts for my previously published strategy:
Original script:

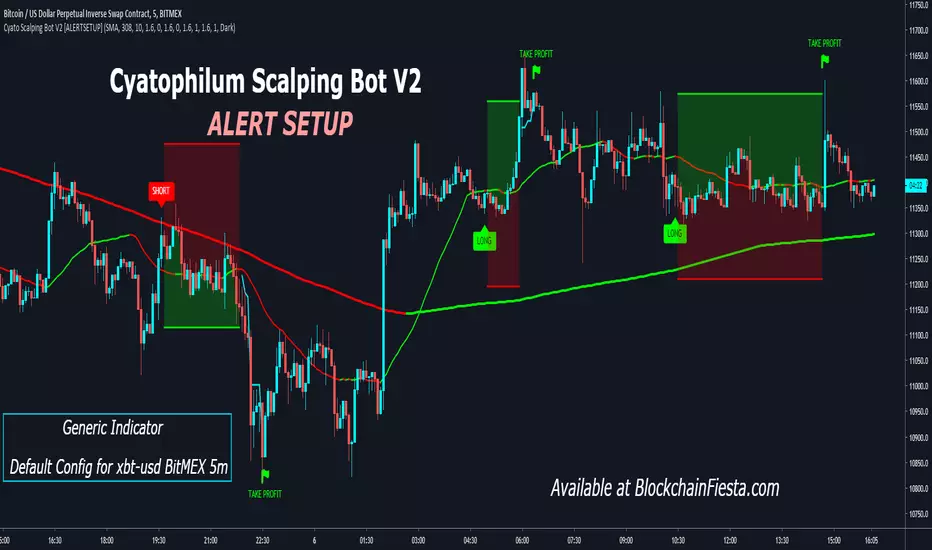
Cyatophilum Scalping Bot V2 [ALERTSETUP]Alert Setup version of Cyatophilum Scalping Bot V2.
Improved version of Cyatophilum Scalping Bot
Default settings for BITMEX:XBTUSD 5m
2% stop loss
2% trailing take profit
Release Notes: Added SMA, EMA and TEMA to the Trend Detector options.
Dolar/Tl Trend bot / Daily chartDolar/Tl Trend bot / Daily chart.
bot should be used for daily chart.
Bot günlük grafikte kullanılır.

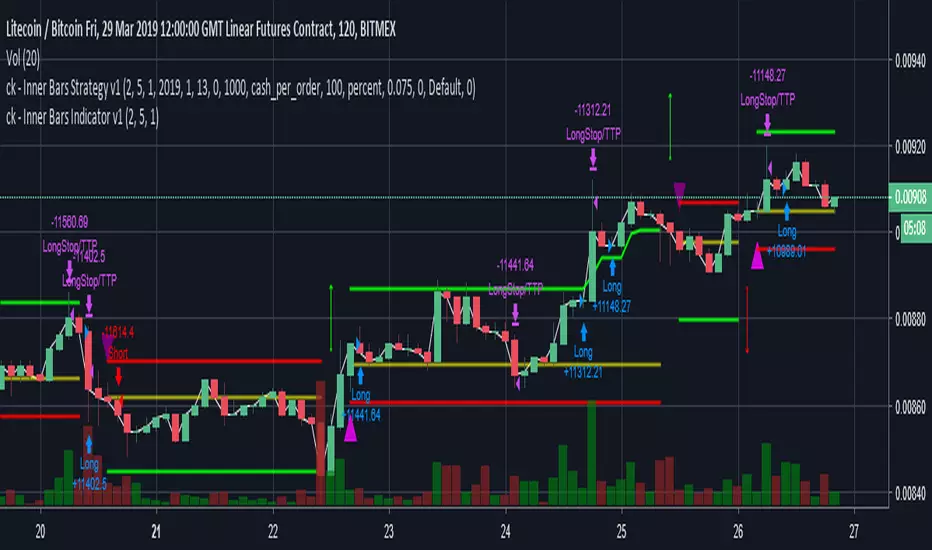
ck - Inner Bars Indicator with Alerts and Trailing Stop v1*** Please check out the matching Strategy to accompany this Indicator to allow you to fully backtest! ***
Inner Bar trading strategy is where the "inside" bar (or candle to the right) within a pair is smaller and within the high to low range of the prior bar, as this pattern tends to be somewhat predictable; especially in "chop" or sideways trading, it is useful to have in your tool box.
Features include:
Complimentary strategy you can add as well as the indicator to backtest and tune your settings before live trading
Trailing Stoploss to wring every cent from a trade
Clear Alert labels have been coded in for use with trading bots, 3commas is recommended.
Enable/Disable Shorts in addition to Longs
Visual chart shapes - Pink Triangle = Long, Purple Triangle = Short, Thin Green Arrow = Profit, Thin Red Arrow = Loss
Realtime Deal Status - Plotlines include Yellow = Entry Price, Green = Trailing Stop Profit, Red - Hard Stoploss
A further feature is that you can disable Shorts (therefore only Longing) for use with exchanges
that only allow you to Long, such as Binance & Coinbase.
Additionally, this Indicator will close a trade before opening the next, so a single exchange
account (BitMEX for example) is all that is required versus having separate accounts to long or
short on the same chart.
This strategy is intended to use $100 of capital, traded at 2.5% per order with 10x lev on Bitmex.
If you like my work, please use my referral links (you will receive discounts!)
3commas trading bots (now with Bitmex support and a lot more!) - 3commas.io
BitMEX - www.bitmex.com
If you have any comments or suggestions, please message me via TradingView.
Based on the core "Inner Bars" concept found at:
backtest-rookies.com
with original inspiration/idea from babypips.com

ck - Inner Bars Strategy v1*** Please check out the matching Indicator to accompany this Strategy to allow you to fully backtest! ***
Inner Bar trading strategy is where the "inside" bar (or candle to the right) within a pair is smaller and within the high to low range of the prior bar, as this pattern tends to be somewhat predictable; especially in "chop" or sideways trading, it is useful to have in your tool box.
Features include:
Complimentary Indicator you can add as well as this strategy to backtest and tune your settings before live trading
Trailing Stoploss to wring every cent from a trade
Indicator only: Clear Alert labels have been coded in for use with trading bots, 3commas is recommended.
Enable/Disable Shorts in addition to Longs
A further feature is that you can disable Shorts (therefore only Longing) for use with exchanges
that only allow you to Long, such as Binance & Coinbase.
Additionally, this Indicator will close a trade before opening the next, so a single exchange
account (BitMEX for example) is all that is required versus having separate accounts to long or
short on the same chart.
This strategy is intended to use $100 of capital, traded at 2.5% per order with 10x lev on Bitmex.
If you like my work, please use my referral links (you will receive discounts!)
3commas trading bots (now with Bitmex support and a lot more!) - 3commas.io
BitMEX - www.bitmex.com
If you have any comments or suggestions, please message me via TradingView.
Based on the core "Inner Bars" concept found at:
backtest-rookies.com
with original inspiration/idea from babypips.com
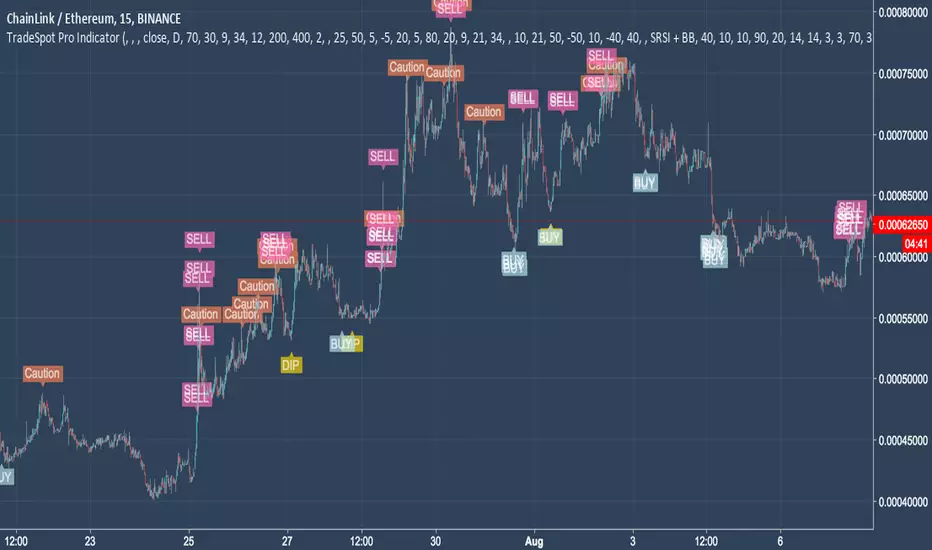
TradeSpot Pro || All Purpose Advanced Trading Indicator & AlertsTradeSpot Pro Indicator
Version: 1.0
TradeSpot Community Website
TradeSpot is a community of traders that specialise in using automated bots to execute spot & margin trading, you can join up via the above link where you too can discuss cryptocurrency, general trading, investments and get informed on the latest botting tools to enhance your day to day trading.
For an in-depth explanation and briefing on what this indicator is capable of, please contact me directly.
Features
Inclusion of all 4 highly regarded indicators previously used by the indicator and combined into one cross-functional powerhouse script sporting different strategies eg. EMA, RMI, RSI, BB based signals (and more!
Neat presentable UI for easily displaying the quality of your current settings.
Incredible customisation, one of the most heavily parameterised scripts on TradingView - this is not a plug and play solution but rather a script you can learn and tweak to really fine tune your strategy, ultimately improving results.
Big list of features listed on the community Discord server that will be developed and added to the indictor in good time (and a backtesting script!).
Combine indicators, a heavily asked for feature finally here - being able to match the signals between included indicators to create an even more robust trading signal.
Scripted with a full array of custom and alerts and more coming for use in manual trading endeavours to never miss a trade or for use with automated bot solutions that can be seen on the community site.
Access
Discord Server
For trial access please follow the link the server above and use the '!trial' command on the chat channel. If you don't use Discord please private message me on here.
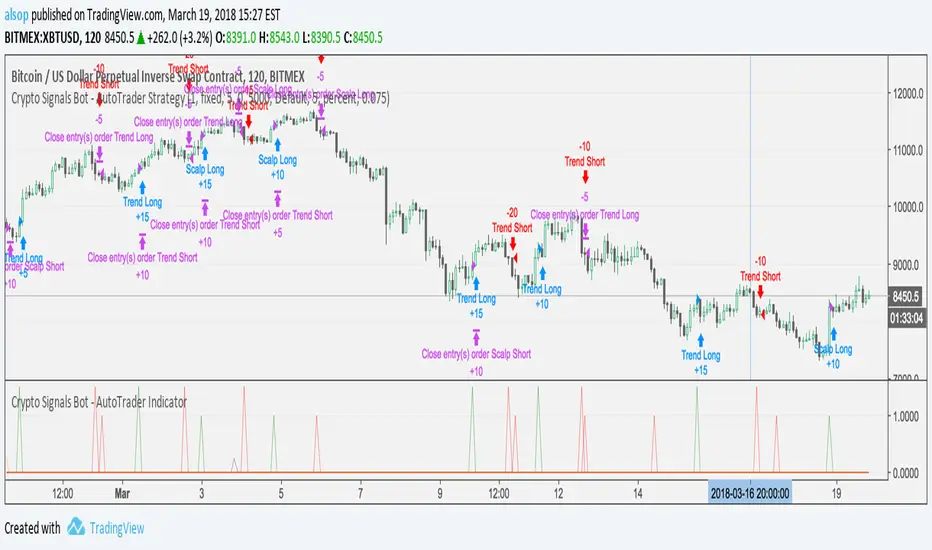
Crypto Signals Bot - AutoTrader IndicatorVery excited to release our new fully automated trading bot specifically for Bitcoin.
We use this system with AutoView to trade on Bitmex and it is specifically designed for Bitcoin on the 2 Hour charts.
It includes everything you will need:
AutoTrader Strategy
AutoTrader Indicator
All Alerts Syntax for AutoView
This has been producing amazing results and is a fully automated trading system that will take buys (long) and sells (short) on Bitcoin with supported crypto exchanges.
To signup, go to this URL: www.cryptosignalsbot.com
Crypto Signals Bot - AutoTrader Strategy - BitcoinVery excited to release our new fully automated trading bot specifically for Bitcoin.
We use this system with AutoView to trade on Bitmex and it is specifically designed for Bitcoin on the 2 Hour charts.
It includes everything you will need:
AutoTrader Strategy
AutoTrader Indicator
All Alerts Syntax for AutoView
This has been producing amazing results and is a fully automated trading system that will take buys (long) and sells (short) on Bitcoin with supported crypto exchanges.
To signup, go to this URL: www.cryptosignalsbot.com

ETH Scalping Bot V2.1(normal) [Tori System]🚀 ETH Scalping Strategy v2.1 (Major Update) "Stop Gambling. Start Automating."
Are you tired of emotional trading and staring at charts 24/7? This is the v2.1 Updated Version of my high-winrate scalping strategy. We have significantly improved the logic to make it safer and more profitable in volatile markets.
This strategy is designed for fully automated trading via alerts (Signal -> Whop -> Execution).
💎 What's New in v2.1? (Update Log)
1. ⚡ "Fast Fail-Loss" Logic Added We introduced a smart cut-loss mechanism.
Previously, the bot might hold a losing position hoping for a reversal.
Now: If the momentum fades or a false breakout is detected, the bot instantly closes the trade to minimize drawdown. Small losses, Big wins.
2. 🛡️ Enhanced Stability We optimized the parameters to filter out market noise (chop). The equity curve is now much smoother and safer for long-term compounding.
🔥 Key Features
✅ No Repainting: What you see in the backtest is what you get in real-time. ✅ High Net Profit: Optimized for compounding growth (See the backtest results above). ✅ Automated Ready: Perfect for connecting with Binance/Bybit via 3rd party tools. ✅ Risk Management: Built-in Stop Loss and Trailing Profit logic.
🤖 How to get Access?
This script is Invite-Only. To start automating your trading with this strategy, please check the link in my Signature below or visit my Profile.
👉 Check the "Signature" section below 👇 (Or click my profile name to find the website link)
⚠️ Disclaimer
Past performance does not guarantee future results.
This script is for educational purposes. Always test with paper trading first.
Cryptocurrency trading involves high risk.

UT Bot Alerts [2026 Elite Edition]🚀 Overview
The UT Bot 2026 Elite Edition is the ultimate evolution of the legendary volatility trading system originally conceptualized by QuantNomad. While the original tool revolutionized trend following, this "Elite Edition" introduces Asymmetric Sensitivity—a professional feature that acknowledges a fundamental market truth: Assets do not fall the same way they rise.
This script allows you to decouple your Long and Short strategies, offering surgical precision for both bull runs and bear crashes, all while monitoring trade health via a new real-time Safety Dashboard.
🧠 The Logic: Why "Elite"?
Most trailing stop systems use a single setting (e.g., Key: 2, ATR: 10) for both buying and selling. This is efficient but often suboptimal.
Bull Markets often grind up slowly (requiring looser stops to avoid shakeouts).
Bear Markets often crash quickly (requiring tighter, faster stops to protect capital).
The Dual-Engine Solution: This script runs two separate calculation engines simultaneously:
The Buy Engine (Ceiling): Calculates the resistance ceiling using its own Sensitivity (Key) and Smoothness (ATR) settings.
The Sell Engine (Floor): Calculates the support floor using entirely different settings.
This means you can have a "Slow & Steady" settings for buying Bitcoin, but a "Fast & Aggressive" setting for shorting it, all within the same indicator.
✨ Key Features
1. Asymmetric "Dual-Key" Sensitivity
Buy Key & ATR: Tune your entry sensitivity for long positions.
Sell Key & ATR: Tune your short parameters independently.
Why this matters: You can now set a wide stop for trending up, but a tight stop for trending down to capture profit instantly when momentum breaks.
2. The Safety Dashboard (HUD) A professional Heads-Up Display (HUD) located in the top-right corner. It provides critical "Flight Data" that simple buy/sell labels hide:
Status: Instantly see if you are net Long or Short.
Stop Price (The Kill Level): The exact price where the trend will flip. Use this for your hard Stop Loss orders.
Active ATR: Displays the current volatility width. High ATR = High Volatility (Wide Stops). Low ATR = Consolidation (Tight Stops).
3. Heikin Ashi Smoothing
Includes a built-in toggle to calculate signals based on Heikin Ashi candles while viewing standard candles. This filters out "noise" and wicks, often keeping you in a trend longer.
4. Pine Script v6 Optimization
Refactored for the latest Pine Script v6 standards, ensuring faster execution and compatibility with the latest TradingView features.
🛠️ How to Use (Best Practices)
For Scalping (1m - 5m Timeframes):
Suggestion: Set Sell Key lower (e.g., 1.5) and Sell ATR lower (e.g., 5) to react quickly to drops. Keep Buy Key higher to avoid choppy fake-outs. I personally use the default settings on the 3M time frame with Gold and NQ with a high rate of success.
For Swing Trading (4h - Daily):
Suggestion: Increase Buy ATR (e.g., 30-100) to smooth out the noise of daily fluctuations.
The Dashboard:
Always check the Stop Price on the dashboard before entering. If the Stop Price is too far away from the current price, your risk might be too high for the trade size.
🙏 Credits & Appreciation
This script stands on the shoulders of giants.
Original Logic: Huge props and credit to QuantNomad for the original UT Bot strategy. His work laid the foundation for volatility-based trailing stops on TradingView.
Concept: Based on the "Ceiling/Floor" volatility theory.
Development: Enhanced and refactored by for the 2026 market environment.
Disclaimer: This tool is for information purposes only. Past performance does not guarantee future results.

4 EMA + VWAP + UT Bot + SuperTrend + Daily Pivot Checklist📌 Description
This indicator is a multi-indicator trend confirmation checklist designed to simplify decision-making by combining several widely used technical tools into one clean on-chart dashboard.
The goal of this script is clarity, not complexity — helping traders quickly see market bias, trend strength, and trade direction without switching between multiple indicators.
🔹 Indicators Included
EMA 10 / 20 / 50 / 200
VWAP
UT Bot (ATR-based trailing stop with BUY / SELL signals)
SuperTrend (correct trend color logic)
Daily Pivot Point (today only)
All conditions are displayed in a YES / NO + BUY / SELL checklist panel for fast confirmation.
🔹 How to Use
Follow UT Bot BUY / SELL as the primary direction
Use EMA 200 & SuperTrend for overall trend bias
VWAP and Daily Pivot act as intraday filters
Stronger setups occur when most checklist conditions align
This indicator works best when combined with proper risk management and price action.
👥 Credits / Author Note
This script was conceptualized, tested, and refined by the publisher based on real trading use cases.
The development, logic structuring, and UI optimization were done collaboratively with AI-assisted scripting support to ensure clean code, clarity, and non-repainting behavior.
Final responsibility for trading decisions always remains with the user.
⚠️ Disclaimer
This indicator is provided for educational and informational purposes only.
It does not guarantee profits and should not be considered financial advice.
Always trade responsibly.

Valex Bot - V3Valex Bot V3 is a macro trend intelligence indicator designed to cut through market noise and highlight the most important directional shifts in price. Built for traders who prioritize clarity and confidence, it delivers clean, visually intuitive trend guidance along with precise buy and sell signals that align with major market cycles. By anchoring its analysis to higher-timeframe market structure, Valex Bot V3 helps users stay on the right side of powerful trends while avoiding emotional overtrading and false signals common on lower timeframes. Whether used as a standalone trend system or as a directional filter for entries, it excels at identifying high-probability market phases across crypto, forex, and traditional markets.

CODY BOT – Breakout SignalsCODY BOT is a minimalist, high-probability breakout indicator designed to keep your chart clean while highlighting actionable trading opportunities.
Unlike traditional indicators that generate too many signals, CODY BOT only alerts you to strong directional moves following consolidation, helping you focus on high-quality entries.
Key Features:
Detects breakouts above recent highs and below recent lows.
Filters weak moves using minimum candle body size.
Includes a cooldown period to prevent signal spam.
Clean and intuitive visual signals with large arrows for easy interpretation.
Optional customization for consolidation lookback bars, minimum candle size, and arrow visibility.
Alerts built-in for server-side and mobile notifications.
How to Use:
Look for BUY arrows when price breaks above consolidation highs.
Look for SELL arrows when price breaks below consolidation lows.
Combine with your preferred risk management and trend confirmation strategies.

VWAP SESSION BUY SELL STRATEGY (INDICATOR) (PDK1977)VWAP SESSION BUY SELL STRATEGY (INDICATOR) (PDK1977)
This indicator combines the proven UT Bot breakout engine but with VWAP directional filtering and ATR-based take profit levels.
It delivers clean, high-probability trend entries and automatic volatility-calibrated exits.
How it works:
Buy only when price is above VWAP
Sell only when price is below VWAP
UT Bot confirms momentum with ATR-based trailing logic
ATR Take Profit gives consistent exits based on volatility
Bars turn green/red only while in a trade, back to normal after TP
Best For:
Intraday and swing trading
Indices, FX, crypto, and high-volume stocks but also for Forex with right TF and settings
Traders who want clean signals and minimal noise
2. Trade Checklist:
Use this before every entry. Quick, simple, reliable.
BUY Checklist:
Price confirmed above VWAP
Label prints BUY
Enter on Buy label (on bar close)
→ Hold until ATR TP hits
SELL Checklist:
Price below VWAP
Label prints SELL
Enter on Sell label
→ Hold until ATR TP hits
Avoid Entries When:
Price is chopping tightly around VWAP
Major news events are about to release
Volume is extremely low
ATR is shrinking rapidly (market compression)
3. Risk-Management Guide
This is tailored to how your system actually behaves.
1. Use ATR TP as Primary Exit:
The system automatically calculates a TP based on volatility:
High volatility → larger TP
Low volatility → smaller TP
This keeps trades consistent and avoids lingering too long.
2. Stop-Loss Recommendation
This strategy is designed for TP-only exits, but if you want a SL:
Recommended Stop-Loss:
Use ATR’s opposite trail, OR
Use 1 × ATR behind your entry candle
This matches the system's internal logic.
3. Position Sizing
Since this system enters during momentum expansions, use:
1–2% max risk per trade
Reduce risk during high-impact news sessions
4. Understand VWAP Environment
Different VWAP conditions require different expectations:
Strong Trend (price far from VWAP)
Higher TP probability
Fewer whipsaws
Excellent continuation setups
Chop Zone (price flips above/below VWAP)
Do NOT trade
Signals lose edge
Wait for a clean break + UT confirmation
5. Choose Correct VWAP Reset for your trading and session
This dramatically improves results.
Market Recommended VWAP Reset
US Stocks New York Session
Indices Daily
Forex London or New York
Crypto Daily or None
4. Final Tips for Best Performance
✔ Enter only in the direction of VWAP
✔ Don’t chase signals far away from entry candle
✔ Avoid trading right into major support/resistance
✔ ATR TP will handle exits mostly
Disclaimer
This script is provided for educational and informational purposes only.
It does not constitute financial advice, investment advice, trading advice, or any form of recommendation to buy or sell any financial instrument. The auto take no responsibility for loss or error in the script.
