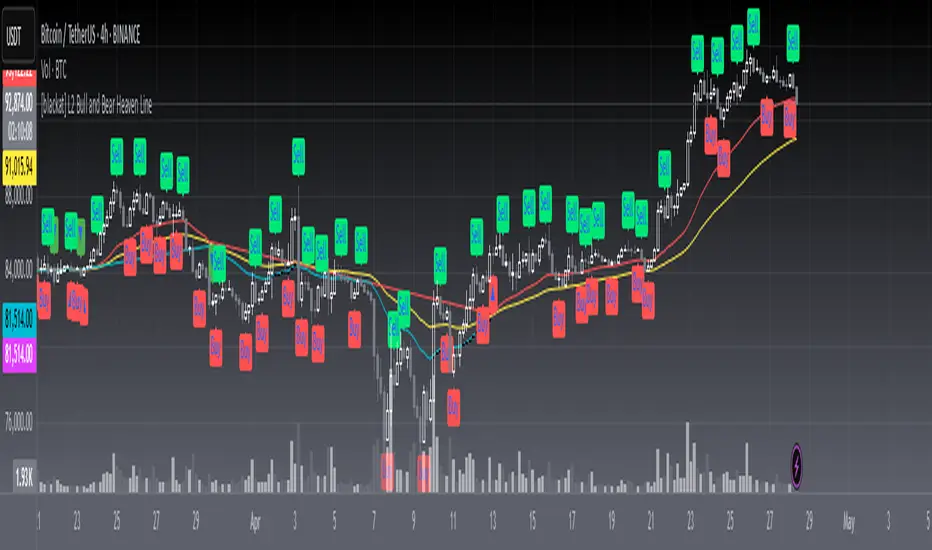
ATR Volatility Impulse Candles (Bull & Bear)This indicator highlights unusually strong momentum candles using ATR as a volatility filter. Treyding Stocks was the inspiration behind this powerful swing indicator!
A candle is marked only when its body is larger than the Average True Range, meaning price moved farther than normal for that timeframe. This filters out noise and focuses attention on candles that often matter most.
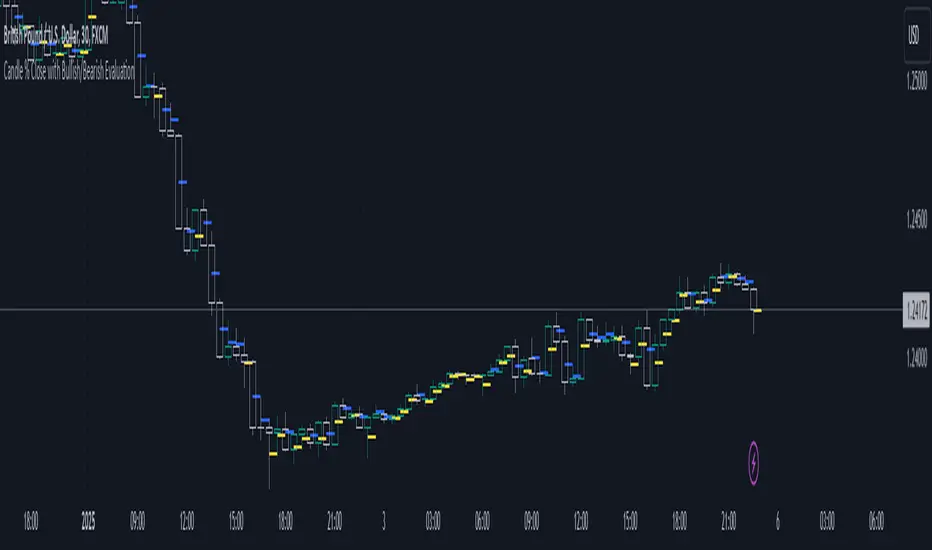
Lime green candles represent strong bullish impulse. They occur when price closes above the open and the candle body is larger than ATR. These candles often show aggressive buying, late-stage momentum, or exhaustion before a reversal.
Blue candles represent strong bearish impulse. They occur when price closes below the open and the candle body is larger than ATR. These candles often signal aggressive selling, liquidation, stop runs, or breakdown confirmation.
The indicator includes alerts for both bullish and bearish impulse candles, allowing traders to monitor multiple charts without watching them constantly.
Traders commonly use this tool to identify momentum exhaustion, reversal zones, and high-impact candles near VWAP, key moving averages, or important price levels. It works on any timeframe, does not repaint, and is designed to keep the chart clean while highlighting only the most meaningful price moves.
The Red (Blue) candle is very useful for swings especially on the Daily chart
*When the Blue (RED) candle appears, mark the high/low, and enter when the next candle breaks /closes above it.
Wskaźnik Pine Script®