Volume Risk Avoidance IndicatorPrice Pattern Analysis is the core of trading. But price patterns often fails.
VRAI (Volume Risk Avoidance Indicator) shows Volume Pressure, so that you can avoid volume-based risks.
For example, never short when you see green (buying pressure). Never long when you see red (selling pressure).
You still need to pick good price patterns, because the crossover of volume pressure is not reliable.
Enjoy!
Price Volume Trend (PVT)

Money Flow LineWhat is this? The Money Flow Line (MFL) indicator is at its core a more even-tempered version of the Price-Volume-Trend (PVT). The primary difference is the usage of `hlc3` ((high + low + close) / 3) rather than `close` to use the "typical price" that it critical to the calculation of the Money Flow Index (MFI). Other similar indicators include the Accumulation Distribution Line (ADL) and the On Balance Volume (OBV) indicators. The purpose of all of these indicators is to attempt to measure the strength of the money flow by combining price and volume into a rolling measurement that can be compared over time to look for confirmations and divergences.
The indicator also includes an optional averaging (smoothing) line that can be enabled in the display settings. Enabling this smoothing line with a desired period allows for simpler trend comparisons and also allows the user to view how far the line has diverged from the mean. This creates an indicator very similar to Elder's Force Index (EFI), which is also a `close * volume` style indicator.
Why is this important? After an extreme movement or volume spike the MFI will "snap back" sharply as that bar eventually exits the set period. This produces a result that is meaningless and skews the indicator away from the market structure. Because of this behavior, range clamping, and the loss of comparative history I prefer to shy away from oscillator style indicators. The Money Flow Line instead gives you all of the history so you may compare and see the broader trend without sharp snaps in history based on an arbitrary period setting.
Why is this better? This produces a no-lag indicator that isn't subject to the harsh skewing produced by they Money Flow Index's period calculation. It doesn't lose history like MFI or EFI, is clear about the trend direction, and prefers a "typical price" (averaging the entire range of each bar) rather than whatever happens to be the closing price for a given bar.
How can I use it? The indicator is attempting to measure supply and demand in the markets. No indicator is perfect, but we can use all of the information we have available to make our best predictions. There are only 3 pieces of data the market gives us:
1. Price (action)
2. Volume
3. Time
The Money Flow Line combines all of these data points into a readable rolling data set that attempts to show subtle balance of power shifts based on changes in volume and "smart money" (or "big money") stepping in and out of the picture. Much like PVT, we look for the same things:
- Trend Identification: an up or down trend appears in the MFL
- Confirmations: the MFL agrees with price action in direction and magnitude
- Divergence: the MFL disagrees with price action, indicating a reversal may be coming soon
When applying the smoothing line we can also look for similar things we would with EFI. The primary case would be to look for the MFL to jump very far away from the mean (a high magnitude movement) which indicates that price may be reverting towards the mean soon (a "mean reversion"). On the other hand, it may indicate strength in the current price direction. All of these predictions depend heavily on price action and market structure. Good luck!

VINA for Futures Trading Volume Imbalance Analysis 30min+Price pattern is critical for trading. So is volume analysis, but volume is so hard to read.
Introducing VINA, the Volume Imbalance Next Action indicator. VINA is similar to OBV, the key being the volume being measured. VINA is developed over many years, using ideas from PVT and Accumulation / Distribution, normalized as an oscillator, and not just adding/subtracting like OBV, instead considering the size of the move like PVT.
It's not perfect, but VINA catches almost all of the major trends. Like all indicators, VINA gets whipsawed in choppy environments. VINA has been very accurate for trading futures, so I'm presenting it here with signals shown for 30 minute or higher timeframes.
Let me know what you think.

COSMO TREND👉 What is this indicator ?
This indicator is made up with the help of Multiple SuperTrend and Price Action , In this awesome indicator, The buy and sell entry is taken by comparing the trend using our secret logic.
👉 What is special about this indicator ?
More than Ten Takeprofit price points can be seen in this indicator , The Stoploss price point can be seen as well . You can simply adjust take profit percentage and stop loss percentage in indicator settings
👉 What kind of Take Profit signal is there on this indicator ?
Ten types of take profit signals are displayed on this indicator, each marked as TP1,TP2,TP3,TP4,TP5,TP6,TP7,TP8,TP9 and TP10 respectively. The take profit signals available for both buy and sell entries. The take profit of the buy entry is shown in Green Color and the take profit of the sell entry is shown in Red Color.
👉 What kind of Exit signal is there on this indicator ?
Exit signals can be seen at the end of the trend
👉 How many alarms does this indicator have ?
This indicator has 13 types of alarm for Buy , Sell , Take Profit and Exit signal, and it is best to set the alarm by selecting the Alert Once Bar Close option to avoid repaint.
👉 On which coins can this indicator be used ?
This indicator is best used on all cryptocurrencies, forex markets and stocks , This indicator is very helpful to get high returns on all cryptocurrencies with low price and high voltality
Note : This indicator only works well in all time frames ( 1s,5s,10s,1m,5m,1h etc...) , Use appropriate values when using other coins. If you have difficulty finding the value, you can contact us.
Default Setup Instructions 👇
Time Frame : 1 Minute
Default Coin : C98USDT
The following settings can be found in this indicator
You can simply adjust take profit percentage and stoploss percentage in indicator settings
Orgin Factor : This is the ATR Factor Value for High Time Frame trend. You can change this value according to the volatility , the ATR Factor value is also used to reduce the chance of a fake signal
Mid Factor : This is the ATR Factor Value for Low Time Frame trend. You can change this value according to the volatility , the ATR Factor value is also used to reduce the chance of a fake signal
Low Factor : This is the ATR Factor Value for Second Low Time Frame trend.
Take Profit - TP1 Percentage : Give What percentage for take First TP
Take Profit - TP2 Percentage : Give What percentage for take Second TP
Take Profit - TP3 Percentage : Give What percentage for take Third TP
Take Profit - TP4 Percentage : Give What percentage for take Fourth TP
Take Profit - TP4 Percentage : Give What percentage for take Fifth TP
Take Profit - TP4 Percentage : Give What percentage for take Sixth TP
Take Profit - TP4 Percentage : Give What percentage for take Seventh TP
Take Profit - TP4 Percentage : Give What percentage for take Eighth TP
Take Profit - TP4 Percentage : Give What percentage for take Nineth TP
Take Profit - TP4 Percentage : Give What percentage for take Tenth TP

PT FVG ImbalancesVersion 1.0 of the PT FVG Gaps & Flat Opens was developed to visually identify any imbalances in price. This indicator can be used on all timeframes.
Fair Value Gaps are a key component when trading price action. They are derived from zones in liquidity where price moved quickly in a certain direction leaving gaps behind. These areas tend to act as magnets to price throughout the trading session of that timeframe.
PT FVG Features:
-Gaps that have been partially filled will shade darker to show price has already attempted to fill that gap before (Toggle Highlight Gap Fill).
-Gaps that have been partially filled will remove a portion of the background zone to indicate how much gap is left to fill in the full zone (Toggle Highlight Remaining Gap).
Flat Open Candles are derived from candles that open without a wick (wickless candles). Price more often than not tends to gravitate towards these areas in the near future to fill the wickless candle before continuing on with the trend. Can be used on all timeframes, but the higher the timeframe holds more weight.
PT Flat Open Features:
-Flat open sensitivity would recommend keeping it around 30-50. If scalping keep it sub 30. This feature determines how many flat opens you want on your chat at one time.
-Delete flat open line allows us to delete the line once price has filled the wickless candle.
Video with strategy will be uploaded shortly! It is included as part of the library. Just message us for access!

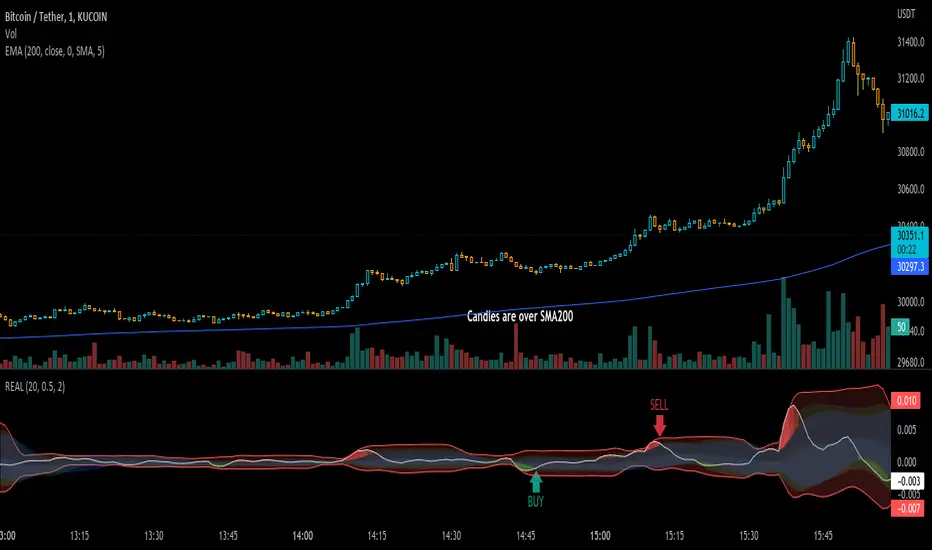
Real IndicatorReal indicator is an indicator to convert ohlcv charts to one oscilator!
there is an effective thing in all charts: "Volume", and I used this thing to mix it by price
Buy: on crossing above to Bollinger-lower-band (on Up-trends)
Sell: on crossing under Bollinger-upper-band (on Down-Trends)
use an SMA-200 to determine trends ;)
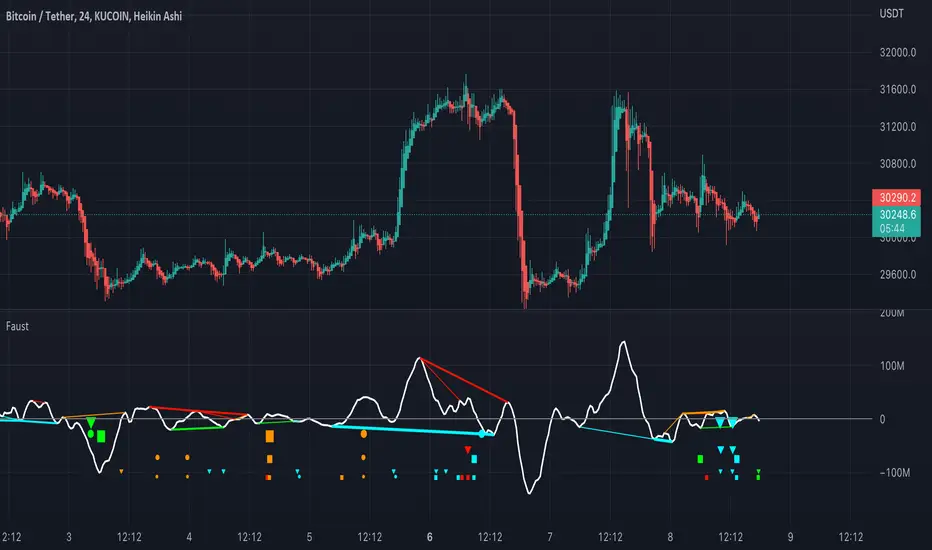
FaustFaust is a composite indicator that combines 3 volume indicators: TSV, OBV, and PVT.
TSV moving average is plotted as an oscillator. OBV and PVT are calculated internally.
Four divergences are calculated for each indicator (regular bearish, regular bullish, hidden bearish, and hidden bullish) with three look-back periods (high, mid, and small).
For TSV, the fattest plotted line is the divergence with the highest look-back period, and the thinnest line is the divergence with the shortest look-back period.
For PVT, the larger the circle, the higher the divergence look-back period.
For OBV, the larger the triangle, the higher the divergence look-back period.
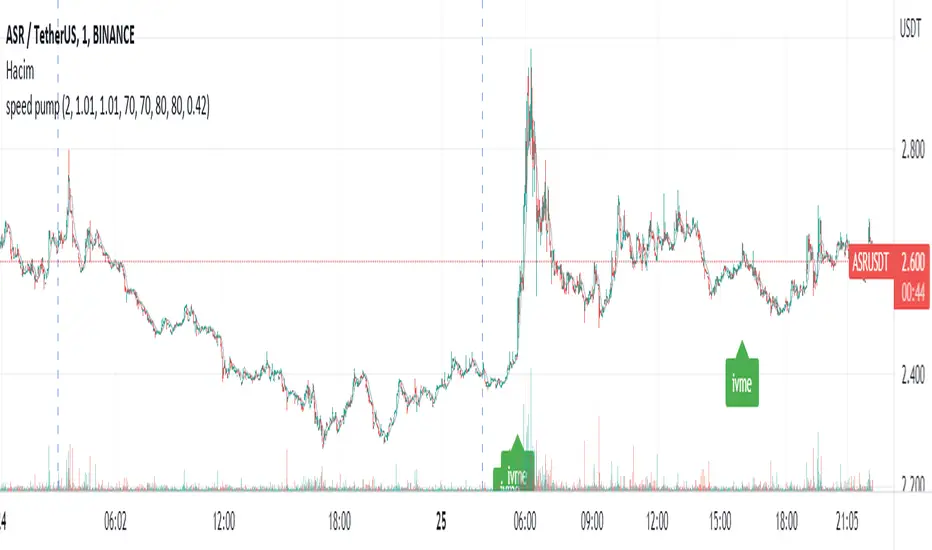
speed pumpIn my basic formula that I calculated with volume and price variables, I determined RSI 7, RSI 14, MF 7, MF 14, CMF 20 and average price deviation difference as limiting. My goal is to detect sudden rising altcoins and quickly buy and sell. I added an alarm for this. I'm sure I didn't write a perfect signal, and you may even get false signals at many points. You should know that this market is always insecure, and it is entirely your responsibility to use the signals. I will continue my analysis to do better. Good luck to all of us.
Hacim ve fiyat değişkenleri ile hesapladığım temel formülümde RSİ 7, RSİ 14, MFİ 7, MFİ 14, CMF 20 ve ortalama fiyat sapması farkını sınırlayıcı olarak belirledim. Hedefim ani yükseliş yapan altcoinleri tespit edip hızlıca al ve sat yapmak. Bunun için alarm ekledim. Kusursuz bir sinyal yazmadığıma eminim ve hatta bir çok noktada hatalı sinyaller alabilirsiniz. Bu piyasanın herzaman güvensiz olduğunu unutmadan bilmelisiniz ki sinyalleri kullanmak tamamen sizin sorumluluğunuzda. Daha iyisini yapabilmek için analizlerime devam edeceğim. Hepimize bol kazançlar.
Alien Brain👉 What is this indicator ?
This indicator is made up with the help of Multi Trend , Moving Average and Price Action , In this beautiful indicator, The buy and sell entry is taken by comparing the trend in the higher time frame with the Trend in the short time frame using our secret logic.
👉 What kind of Buy and Sell signal is there on this indicator ?
Four types of buy and sell signals are displayed on this indicator, each marked as M.Buy(Master Buy) , M.Sell (Master Sell) , Buy1, Sell1, Buy2 , Sell2, Buy3 and Sell3 respectively. These four types of indications are obtained by comparing the trend in the higher time frame with the Trend in the short time frame.
👉 What kind of Take Profit signal is there on this indicator ?
Four types of take profit signals are displayed on this indicator, each marked as TP1,TP2,TP3 and TP4 respectively. The take profit signals available for both buy and sell entries. The take profit of the buy entry is shown in Green Color and the take profit of the sell entry is shown in Red Color.
Note : Take Profit Signals Only Available for Master Buy and Master Sell
👉 What kind of Exit signal is there on this indicator ?
Exit signals can be seen at the end of the trend
Note : Exit Signals Only Available for Master Buy and Master Sell
👉 How many alarms does this indicator have ?
This indicator has 18 types of alarm for Buy , Sell , Take Profit and Exit signal, and it is best to set the alarm by selecting the Alert Once Bar Close option to avoid repaint.
👉 On which coins can this indicator be used ?
This indicator is best used on all cryptocurrencies, forex markets and stocks , This indicator is very helpful to get high returns on all cryptocurrencies with low price and high voltality
Note : This indicator only works well in 1 min time frame , Use appropriate values when using other coins. If you have difficulty finding the value, you can contact us.
Default Setup Instructions 👇
Time Frame : 1 Minute
Default Coin : OGNUSDT
The following settings can be found in this indicator
TOP BRAIN - Factor : This is the ATR Factor Value for High Time Frame trend. You can change this value according to the volatility, the ATR Factor value is also used to reduce the chance of a fake signal
MID BRAIN - Factor : This is the ATR Factor Value for Low Time Frame trend. You can change this value according to the volatility, the ATR Factor value is also used to reduce the chance of a fake signal
MID BRAIN - Threshold : This is the difference between price and moving average. Changing the value of this option will change the accuracy of the trading signal
LOW BRAIN - Factor : This is the ATR Factor Value for Second Low Time Frame trend.
Take Profit - TP1 Percentage : Give What percentage for take First TP of Master Signal
Take Profit - TP2 Percentage : Give What percentage for take Second TP of Master Signal
Take Profit - TP3 Percentage : Give What percentage for take Third TP of Master Signal
Take Profit - TP4 Percentage : Give What percentage for take Fourth TP of Master Signal

Treat Sideways👉 What is this indicator ?
Understanding the Sideways Trend is the best trading method, and we have written this script intending to make you a better sideways filter indicator. Treat Sideways helps you understand the sideways trend and trade in a risk free manner.
👉 On which coins can this indicator be used ?
This indicator is best used on all cryptocurrencies, stocks , forex markets
👉 How work this indicator ?
We understand the trend using our secret logic and price action, and After that, we mark the sideways movement in a box. The moving average line helps us to construct this indicator.
👉 Default Coin and Time Frame ?
XRPUSDT
Time Frame : 1 min
MA Line Color Details 👇
The Blue color of the MA line indicates the Sideways Trend
The Red color of the MA line indicates the Down Trend
The Green color of the MA line indicates the Up Trend
Indicator Settings 👇
Box Height : This setting can be used to set the size of the Sideways trend
Time Gap : This option is used to control unexpected down trend and up trend
Up Down Threshold : This option should be adjusted according to the time frame and voltality
Color :
Option to change the color of the box that appears in the sideways trend
Border Color : Option to change the color of the box border that appears in the sideways trend
Opacity : Option to change the opacity of the box border that appears in the sideways trend
Line Width : You can adjust the width of the MA line with this option

VSA with Smart Volume-Atropine
Volume spread analysis is a new way of looking at the market. It more like the candlestick analysis taking into consideration the volume . Volume Spread Analysis is one of the most important concepts of technical analysis .
Volume plays a very important role for traders. It is one of the key movers of the market because the market is mostly moved by fear and greed among the participants. Volume is also important in confirming a trend and chart patterns.
How Does This Indicator Works ?
1. It indicates Strengths and Weakness Signals on the basis of Tom Williams Volume Spread Analysis.
2. It Automatically Draws Potential Zones and you can extend them.
3. It Draws zones over Strength or Weakness Signal for whole session.
4. Gives Options to hide Historical Action to avoid noise over the chart.
5. Shows Cumulative Volume over the Candle to get clear Picture of buyer and seller.
6. It Indicates most important signal of Effort vs Result.
7. Automatically draws zone of High Volume Candle from Higher Time frame.
8. Draws 60min(1Hr) Initial Balance Range.

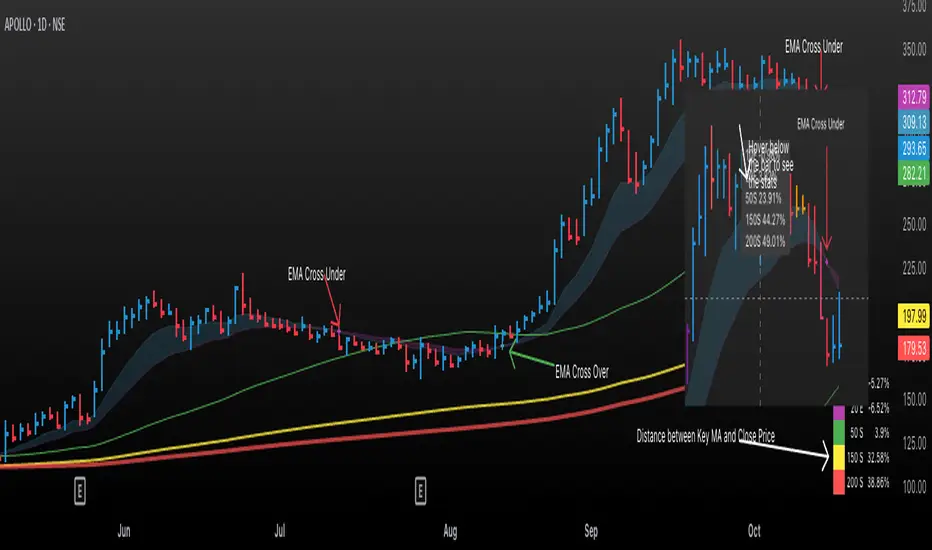
Stage Analysis - Short TermImproved stage analysis by adding short term trend
Within the base of stage 2 stocks, price tends to consolidate on a swings where short term moving averages cross each other,
wait for price to be consolidating with in the base around the short term moving averages where the distance between two moving averages would be shrinking as well + volume dryness.
To capture pull backs with the short term moving averages within the base
To make the chart analysis clear, short term averages are hidden in the chart apart from Daily time period
Bogdan Ciocoiu - MakaveliDescription
This indicator integrates the functionality of multiple volume price analysis algorithms whilst aligning their scales to fit in a single chart.
Having such indicators loaded enables traders to take advantage of potential divergences between the price action and volume related volatility.
Users will have to enable or disable alternative algorithms depending on their choice.
Uniqueness
This indicator is unique because it combines multiple algorithm-specific two-volume analyses with price volatility.
This indicator is also unique because it amends different algorithms to show output on a similar scale enabling traders to observe various volume-analysis tools simultaneously whilst allocating different colour codes.
Open source re-use
This indicator utilises the following open-source scripts:


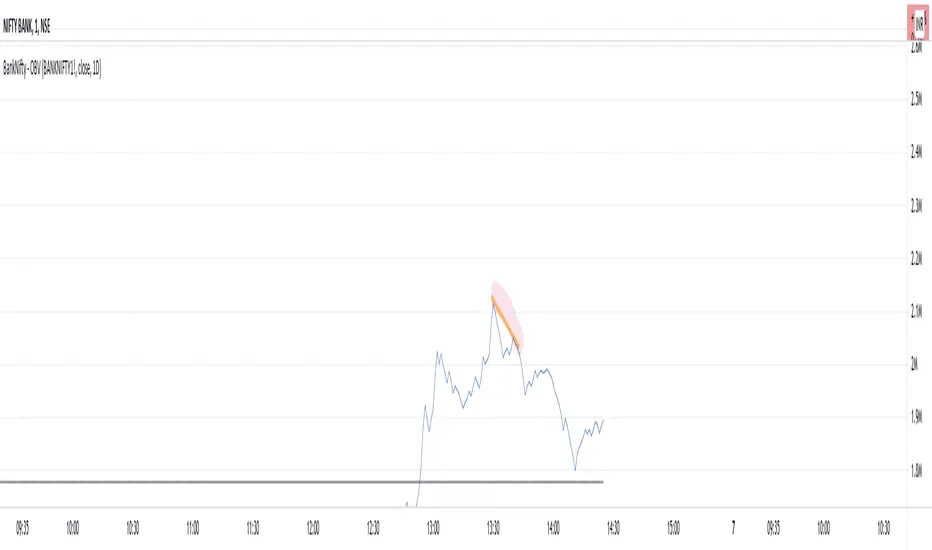
BankNifty - OBVThis script tries to draw OBV for BankNifty using Futures Volume along with Average OBV. For Nifty50 just change the Futures Volume symbol in settings. Look at devations in Price vs OBV or Average OBV breakout.
NSE:NIFTY
NSE:BANKNIFTY
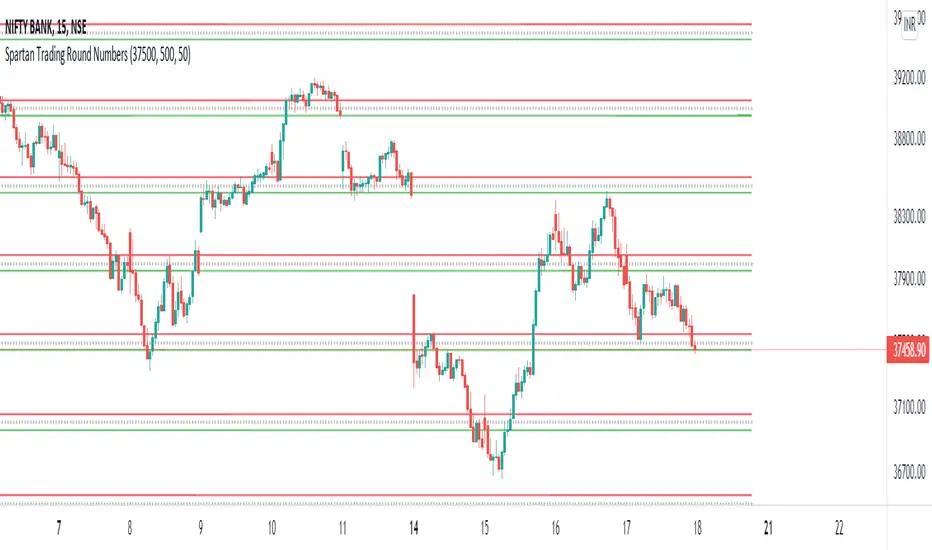
Spartan Trading Round NumbersRound number Swing Trading System:
Setup part 1: Set Near Round Number And Specific Gap in indicator input session
Setup part 2: What is the direction of the trend? Use Dow Theory, moving averages or your preferred technical analysis to determine the trend. Only trade with the trend.
Setup part 3: Wait for the price to swing in the direction of the trend
Setup part 4: Wait for a correction to begin after a high in an uptrend or low in a downtrend near a round number.
Entry price: Set your entry price at the next round number up in a downtrend or down in an uptrend
Stop loss: Set your stop loss at the next but one round number or the fifty level
Take profit: Set your profit target 200-300 Points from your entry price.
Intrabar OBV/PVTI got this idea from @fikira's script Intrabar-Price-Volume-Change-experimental
The indicator calculates OBV and PVT based on ticks. Since, the indicator relies on live ticks, it only starts execution after it is put on the charts. The script can be useful in analysing intraday buy and sell pressure. Details are color coded based on the values.
Data is presented in simple tabular format.
Formula for OBV and PVT can be found here:
www.investopedia.com
www.investopedia.com

Monkey D Luffy RSI+SMA OscillatorIts a basic rsi sma crossover indicator
you can use in any market
just adjust settings to your preference
M.Right_Relative Volume and PVT (cc)Hello Traders,
I hope you're all doing well and enjoying your holiday!
Today I am releasing a Relative Volume and Price Volume Trend indicator that will help traders assess current price action based on its volume and trend.
Volume is one of the most important aspects of trading that is often overlooked by new traders. Generally, when the volume is higher than normal, something is happening with said equity. Whether that's selling or buying volume it shows importance.
The higher the volume the higher the interest of traders in the equity, so a sudden increase in volume relative to its average volume (relative volume) can cause an increased probability that the price will move.
Relative volume is very self-explanatory , it’s the volume relative to its average. In this indicator, I use several different average calculations to give the trader a clear picture of where the volume stands and added a few different trends using these averages. One is a modified Price Volume Trend.
PVT or Price Volume Trend is a momentum-based indicator that measures money flow in relation to volume. It is usually used to confirm trends, but can be used as a trading signal; as I’ve created some in here. I didn’t added divergences, but using divergences in PVT is another strong way to use it. PVT tends to mirror the market price movements; hence, confirm trends.
You will find this indicator to be jam packed full of features.
-Fully customizable: colors, shapes, lines, on/off toggles for everything.
-Includes:
---Relative Volume Wave.
---Shadow Waves that can help with trend confirmation.
---Vibrant Relative Price Spike in the forefront.
---Additional Volume Trend on bottom of volume bars
---Stat box: showing the Current, Average, and Relative volume on the current user selected timeframe.
---Signals.
---Alerts: prefilled.
Enjoy!
Please add a thumbs up if you like this and follow the instructions for access.
Leave any other questions in the comments section.
Cheers,
Mike

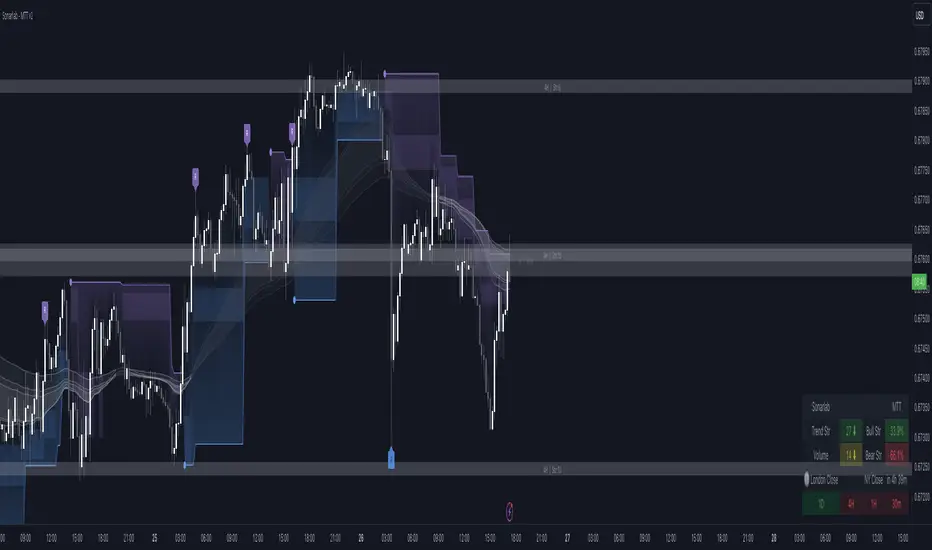
Multi Trend Tool - SonarlabVersion 1 (releasing new updates every 2 weeks
The Sonarlab Liquid Script included a lot of indicators at once, so you have all the tools you need in hand reach.
Features:
01_ Revision Band (Reversal Cloud)
The reversal cloud can be used for many options. These zones can be great areas to take profit or find early entries to use alongside the confirmation or contrarian signals.
02_Supply & Demand Levels / Imbalances (still need some improvement)
The driving force behind changes in price is supply and demand. When there are more buyers than sellers, the market price will move up. Conversely, when there are more sellers than buyers, the market price will move down. When buyers and sellers are more or less even, the market will range. Know where the world’s biggest buyers & sellers are entering and exiting their trades, so you can too.
03_Support and Resistance (Multi Timeframe)
04_Trading Dashboard
Get a quick overview of the current market situation.
- Multi Timeframe Trend Structures
- Volatility %
- Trend Strength %
- Directional Bias: Strong/ Weak/ Neutral
- Trading Sessions
05_Imbalances
See Imbalances within a wink of an eye. Draw them out and make better decisions using those zones (those zones needs to be filled.)
06_Filter options
Filter the signals with Moving averages or with a second trend structure
07_Trend Lines
08_Pivot Highs and Lows
09_Alerts
Even the option to automate the signals true 3Commas (Please wait for our Strategy version of this indicator before using this function).
10_Reduce Risk/ Exit Points
Grey circles on the chart
A lot of things can be changed and customize as you want. You can change/set:
- Colors of Body and Top/Bottom Wicks separately
- Moving Average Values
- Supply and demand values
- Trend Line values
- Colors of the shapes
Sonarlab can be adjusted To All Trading Styles to simply create your own, unique trading strategies around this Powerful Indicator.
Support
For questions, you can reach out on discord or send us a private message on Tradingview or discord group.
We kindly suggest you to test this indicator out on a demo account first.
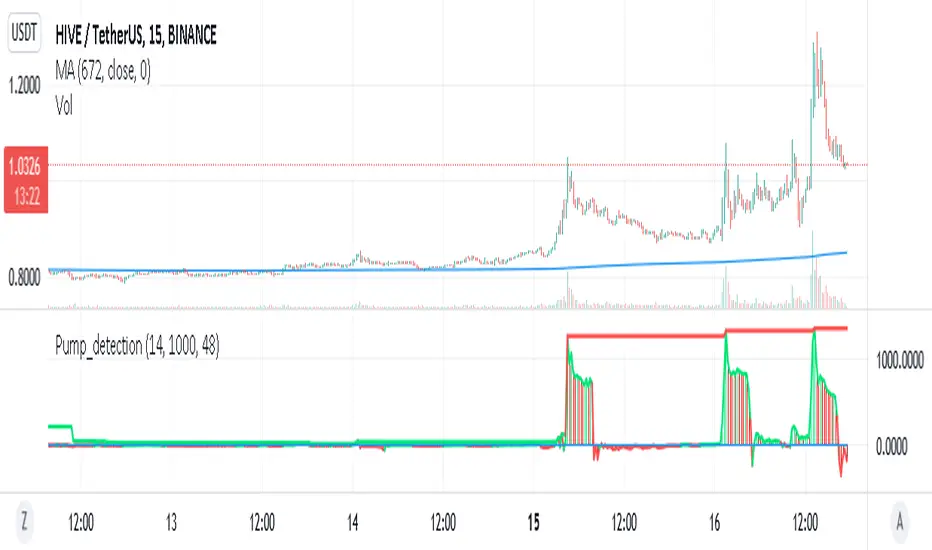
Pump_Detection_price_and_volume_15mThis indicator is very useful for spotting pump.
It is highly inspired from Pump_Doctor_Trend indicator of LARP_Capital.
This indicator is design for 15m timeframe but can be adapted for other timeframe.
If you find any way to optimized it please keep me updated !
Volume Price Trend with Divergence and Pivot Points The volume price trend indicator is used to determine the balance between a security’s demand and supply. The percentage change in the share price trend shows the relative supply or demand of a particular security, while volume indicates the force behind the trend. The VPT indicator is similar to the on-balance volume (OBV) indicator in that it measures cumulative volume and provides traders with information about a security’s money flow.
This is Volume Price Trend or VPT recalculated to be an Oscillator, a Divergence hunter was added, also Pivot Points and Alerts.
VPT is considered a "leading indicator" - in contrast to a "lagging indicator" just as Moving Averages it does not show a confirmation what already happened, but it shows what can happen in the future. For example: The chart is climbing while the VPT oscillator is slowly declining, gets weaker and weaker, maybe even prints bearish divergences? That means that a reversal might be occurring soon. Leading indicators are best paired with Stop and Resistance Lines, general Trendlines , Fib Retracements etc...Your chart is approaching a very important Resistance Trendline but the VPT shows a very positive signal? That means there is a high probability that the Resistance is going to be pushed though and becomes Support in the future.
What are those circles?
-These are Divergences. Red for Regular-Bearish. Orange for Hidden-Bearish. Green for Regular-Bullish. Aqua for Hidden-Bullish.
What are those triangles?
- These are Pivots . They show when the VPT oscillator might reverse, this is important to know because many times the price action follows this move.
Please keep in mind that this indicator is a tool and not a strategy, do not blindly trade signals, do your own research first! Use this indicator in conjunction with other indicators to get multiple confirmations.

Realtime Volume Stats Panel w Delta, Buy/Sell%, Cumulative DeltaWhat is it?
Displays several realtime volume stats for each bar/candle.
Although it was originally created to be an assist tool for the Market Footprint (available as a separate indicator) to consolidate the numbers into a neat panel below, it can be used independently as an Orderflow Analysis tool as well.
It currently displays the following:
(1) Net Delta Volume for the bar; (2) Total Volume for the bar; (3) Cumulative Delta Volume for bars plotted up till this point (i.e., from the time the tool started collecting realtime data);
(4) Buy Volume for the bar as a percentage of the total volume for the bar; and, (5) Sell Volume for the bar as a percentage of the total volume for the bar.
All labels/colors etc. are configurable to suit your aesthetics.
All data are ONLY AVAILABLE FOR REAL-TIME BARS. The longer you keep a chart open with the study enabled, the more data it collects and displays, and the better your analysis can potentially be.
Note that the data gets reset every time (a) any of the options is changed, (b) the market is switched, (c) the browser is refreshed, or (d) the script is reloaded
DATA ISN'T STORED. I.e., every time a new symbol is loaded, the previous symbol's data is lost. So if you intend to monitor a symbol closely, you would need to keep it loaded all the time (and without tinkering with any of the Settings).
Who is it for?
For ultra short term traders who are used to looking at short term auction orderflow (and price action) to catch buy/sell anomalies and accurate trade entries
For traders who are already using Market Footprint but want the volume stats to be displayed on the bottom pane making for a cleaner interface.
For traders (, irrespective of their method of trading,) who wish to understand what is happening under the hood when a certain price action unfolds. (Who is in control, who got trapped, what does liquidity or the lack thereof look like, etc.)
