Spełniamy byczy „Megaphone Pattern”! Wkrótce 85 000$? 👀Już od ponad 3 lat budujemy formację byczego megafonu i patrząc na oś czasową 1T jesteśmy coraz bliżej przebicia go górą.
Czym jest Megaphone Pattern
Ta formacja składa się z 5 swingów czyli co najmniej dwóch wyższych szczytów i dwóch niższych dołków. Jest ona stosunkowo rzadka w porównaniu do in
Siła społeczności
Zdobądź inspirację do następnej transakcji. Nie wymyślaj koła na nowo.

BTC - Dwa istotne zagrożenia dla wzrostów. W sieci huczy ostatnio od sprzecznych analiz dalszego zachowania ceny więc krótko zwięźle i na temat:
Zbierając wszystkie przesłanki jaki udostępnia wykres i cena jestem nastawiony mocno pro wzrostowo w długim terminie i średnio pro wzrostowo w krótkim terminie. Podsumowując … pro wzrostowo.
Jedyn

Grenevia - dawny FamurDzisiaj swoje wyniki opublikowała spółka Grenevia. Zachęcam do zapoznania się z listem do akcjonariuszy, który znajdziecie na pierwszych stronach sprawozdania finansowego.
Wykres 1 - W
Obecnie kurs przebywa w kanale spadkowym, którego początek to październik 2023 jako forma wybicia z klina. Spadki

XTB bez niespodzianek. Jak to XTB po ruchu w górę mała konsolidacja a teraz z korektą. Na ten moment korekta 1/1 co widać na wykresie. To na co warto zwrócić uwagę to mocne dywergencje na RSI i MACD. W przypadku głębszej nie powinna przekroczyć zielonej strefy wsparcia. Docelowo u mnie TP1 w okolicach 90 zł. SLe ustawione

Doge USDT CoinEX H4 ( H12) Początek analizy :
Czy wszystkie warunki spełnia sie na spadek do 0,14 - 0.13 ? (linia czerwona przerywana poziom 1.127 - ostatni wykres z kolejna juz formacją )
Wg formacji motyla (juz drugiej ) mamy trzy spaelnione warunki na wzrost i kolejno spadek do 0.15-0.16 ) ale wg przewag to cena musi utr

Aktualizacja strategii na PepcoCześć,
na wstępie chciałbym zaznaczyć, że mimo iż w większości spółek, które opisuje na TV nie posiadam w swoim portfelu, aby być bardziej obiektywnym, to akurat Pepco od jakiegoś czasu kolejny raz zasiliła mój portfel. Spółkę analizuję raz na kilka miesięcy, ze względu na duży odzew w komentarzach

Kwietniowe ochłodzenie z filiżanką - SOLUSDTChciałbym, aby tytuł analizy nie był, aż tak mroźny, jak wskazałem. Dotyczy to tego nie tylko, tego jak zakończy się kwiecień, ale również jak zakończy się maj. W wyjaśnieniu, o co chodzi mam na na myśli świece na interwale miesięcznym - rys. 1 . Obecnie buduje nam się świeca zmiany trendu.
Czy t

Rynek miedzi nabiera rozpęduChociaż globalny przemysłowy cykl wydaje się osiągać punkt zwrotny, co ogólnie wspiera czynnik popytowy, wsparcie ze strony kanałów przejścia na zieloną energię jest bardziej zróżnicowane, podobnie jak względny stan dynamiki podaży.
Dla miedzi, kombinacja wysokiego wpływu popytu związany z przejśc

oRGR na SrebrzeSrebro oRGR
Odwrócona formacja głowy i ramion także należy do klasycznych struktur cenowych,
które odwracają trend. Tym razem jednak ta struktura cenowa zapowiada zakończenie
trendu spadkowego. Podobnie jak w przypadku formacji głowy i ramion mamy tutaj
do czynienia z trzema punktami zwrotnymi.

TESLA - czas na wzrostyKorekta 75% to dużo - daje nam to sygnał jak bardzo przehajpowany jest dany walor. No ale czemu się dziwić, skoro o Tesli w 2020-2022 słyszeliśmy w każdym źródle informacji. Po głębokim wdechu pojawia się głęboki wydech, cena ma szansę niebawem wkroczyć w strefę, w której spadki się zatrzymają i roz

Zobacz wszystkie pomysły wyboru redakcji
Poznaj tajniki handlu.
Jak zostać zyskownym traderem? (cz.1)Pewien trader powiedział mi, że już od kilku lat jest na rynku, ale musiał zweryfikować swoje oczekiwania. Frustruje go to, że nie może zarabiać więcej i jego marzenia, dla których zaczął trading się nie spełnią. Zarabia dobrze, ale nie na tyle, by prowadzić taki styl życia jaki by chciał. Myślał o

Najważniejsze problemy prowadzące do strat i jak sobie radzić?„Odniosłem serię dotkliwych strat i do dziś nie potrafię się z tego pozbierać” – w ten sposób znajomy inwestor opisywał trudniejszy okres jaki przechodził. Wydarzenia życiowe sprawiły, że miał więcej stresu niż zazwyczaj a do tego, jak na złość, zdarzyła mu się seria strat.
W efekcie nie był w sta

Fale Elliotta - narzędzie do "przewidywania" wzrostów i spadkówFale Elliotta - narzędzie pozwalające przewidzieć najbardziej gwałtowne wzrosty i spadki
22 stycznia 2020 zakończył się cykl wzrostowy na S&P i zaczął się cykl spadkowy. Poza tym jednym narzędziem nic nie wskazywało, że mamy przed sobą historyczne spadki i największą jak do tej pory panikę na rynk

Jak wybrać system tradingowy?Dziś chcę zająć się odpowiedzią na pytanie, które pada bardzo rzadko a ma krytyczne znaczenie dla długofalowych wyników. To pytanie ma następujący kształt:
Jaki jest najlepszy system dla ciebie?
Wyobraź sobie, że masz łatwy do zrozumienia i użycia system. Spędzasz na rynku nie więcej niż połowę

Jak skutecznie zacząć uczyć się systemuDroga od „zera” do „Top Investora” wymaga wiedzy o tym, jak najszybciej uczy się nasz mózg. Jest to część wiedzy na temat ścieżki sukcesu w tradingu.
Najlepsi traderzy zaczynali od zera – nie wiedzieli nic. Jednym z krytycznych momentów ich rozwoju była chwila, kiedy zaczynali rozumieć system. Częs

TradingView - jak skorzystać z platformy | Tips&TricksTradingView to w mojej ocenie jedno z najlepszych narzędzi do analizy spółek.
I nie, nie mówię tutaj o samej Analizie Technicznej. Mówię tu o wszystkich możliwych narzędziach jakie być może potrzebujcie do analizy spółki, a może nawet nie wiecie, że są.
W obszarze dla inwestora na TradingView znajdz

MACD - trochę teorii Wstęp:
Na początek pragnę zaznaczyć, że żaden wskaźnik nie jest bezbłędny i jeśli ktoś zdecyduje się oprzeć swoje decyzje o MACD to powinien wykonać dodatkowe analizy, przejrzeć aktualne raporty czy też trzymać się swojej przyjętej strategii zarządzania ryzykiem. Wskazane jest również robienie test

Bollinger Bands; Klucz do zwiększenia zysków na ForexWskaźnik Bollinger Bands jest jednym z popularnych narzędzi analizy technicznej stosowanych w handlu na rynku Forex. Oto kilka sposobów, w jaki można wykorzystać Bollinger Bands w handlu na rynku Forex:
Wykorzystanie:
Identyfikacja poziomów wsparcia i oporu
Wskaźnik Bollinger Bands może pomóc w

5 Wskazówek Dotyczących Zarządzania Stratnymi Pozycjami Stratne transakcje się zdarzają. To część tej gry. Nie ma czegoś takiego jak trader lub inwestor, który cały czas wygrywa - wszyscy, których znasz, przegrywali wiele razy w swojej karierze. To zupełnie normalne. Wiedziałeś, że słynny menedżer funduszy hedgingowych Ray Dalio stracił wszystko w wieku

Przewaga Haiken Ashi nad zwykłymi świecami japońskimi [CRYPTO]Świece Haiken Ashi to bardzo popularny rodzaj wykresów wykorzystywanych w handlu na rynku Forex. W przeciwieństwie do tradycyjnych japońskich świec, wykres Haiken Ashi wykorzystuje specjalny algorytm do przetwarzania danych cenowych, dzięki czemu łatwiej jest odczytać trendy i kierunek rynku.
K

Zobacz wszystkie pomysły wyboru redakcji
Dogłębne objaśnienia wideo przygotowane dla Ciebie przez traderów.
Wszystko o BITCOINIE - Skrupulatna analizaBTC Bitcoin jest w mocnym impulsie i nie próbujemy na chwilę obecną go zatrzymać ale musimy zwrócić uwagę co będzie się działo na W1 i jak świeca tygodniowa nam się zamknie.
Z interwału D1 mamy dogodnie miejsca gdzie jeżeli cena wróci dalej będziemy podkupować BTC
Jeżeli przejdziemy na jeszcze mniej


BITCOIN (BTC), FALA 5 W DÓŁ CZY FALA 2 KOREKCYJNA?Troche mi ucielo wideo, nie zwrocilem uwagi na czas, ale w zakonczeniu chodzilo o fakt, ze golden pocket zakladamy dla fali B w ruchu globalnym o ile bedzie to fala B. W korektach ABC ciezko jest wyznaczyc dlugosci dla fali B jak i dla fali C, dlatego istotne by miec plan/poziomy/strategie i z danyc


Złoto - Spojrzenie zarówno długo jak i krótko terminowe Wideo.Witam wszystkich. Dzisiaj przedstawiam Wam analizę złota z wielu perspektyw rynkowych.
Złoto dało sygnał że ktoś już sprzedał z okolic 2022$. Jest to dla nas kluczowa informacja jeżeli chcemy próbować prawdopodobnie przewidzieć dalsze ruchy rynku złota. Po więcej szczegółów zapraszam do obejrzenia

Czy ropa dalej będzie drożała? Analiza globalna:Witajcie,
W powyższym nagraniu chciałbym zwrócić Waszą uwagę na rynek ropy globalnie.
Uważam, że jest bardzo prawdopodobne iż powtórzy się nam scenariusz, który miał miejsce po 1979 roku gdy cena wystrzeliła o ponad 100% po rozpoczęciu dziewięcioletniej wojny Związku Radzieckiego wspierającego rz

Bitcoin - Spojrzenie Długoterminowe Wideo Nagranie. 19.03.2022Witam wszystkich. W tym materiale poświęcam większość czasu na omówienie BTC z perspektywy długoterminowej.
Zapraszam do obejrzenia materiału.
-------------------------------------------------------------------------------------------------
Jeżeli ktoś nie ma czasu na obejrzenie materiału to opisze

BITCOIN 21.02.2022. Aktualizacja WIDEO NAGRANIEZapraszam do pełnego obejrzenia nagrania. Oczywiście nie jest to porada inwestycyjna. Odkrywam kolejne "karty" mojej analizy rynkow, zdradzając przy tym jakie mechanizmy rynkowe można wykorzystac by stworzyć swoją przewagę na rynku! Jeśli chodzi o Bitcoina to w dalszej części nagrania ( minuta 14) p

Zobacz wszystkie pomysły wyboru redakcji
Wskaźniki handlowe i strategie stworzone przez naszą społeczność.
Percent Rank HistogramThis Pine script indicator is designed to create a visual representation of the percent rank for multiple financial instruments. Here's a breakdown of its key features:
Percent Rank Calculation:
The core functionality of this Pine script indicator revolves around the calculation of the percent r

Heat Map SeasonsHeat Map Seasons indicator
Indicator offers traders a unique perspective on market dynamics by visualizing seasonal trends and deviations from typical price behavior. By blending regression analysis with a color-coded heat map, this indicator highlights periods of heightened volatility and helps

Index Generator [By MUQWISHI]▋ INTRODUCTION :
The “Index Generator” simplifies the process of building a custom market index, allowing investors to enter a list of preferred holdings from global securities. It aims to serve as an approach for tracking performance, conducting research, and analyzing specific aspects of the glob

Higher-timeframe requests█ OVERVIEW
This publication focuses on enhancing awareness of the best practices for accessing higher-timeframe (HTF) data via the request.security() function. Some "traditional" approaches, such as what we explored in our previous `security()` revisited publication, have shown limitations

Trailing Management (Zeiierman)█ Overview
The Trailing Management (Zeiierman) indicator is designed for traders who seek an automated and dynamic approach to managing trailing stops. It helps traders make systematic decisions regarding when to enter and exit trades based on the calculated risk-reward ratio. By providing a cle

Periodic Activity Tracker [LuxAlgo]The Periodic Activity Tracker tool periodically tracks the cumulative buy and sell volume in a user-defined period and draws the corresponding matching bars and volume delta for each period.
Users can select a predefined aggregation period from the following options: Hourly, Daily, Weekly, and Mo

Gaps Profile [vnhilton]Note: If you get an error preventing indicator from executing due to a loop running longer than >500ms, please lower the amount of boxes shown and/or increase the minimum gap % threshold.
OVERVIEW
The Gaps Profile (GP) simply shows the remaining gaps on the chart that have yet to be closed. Gaps
TTrades Daily Bias [TFO]Inspired by @TTrades_edu video on daily bias, this indicator aims to develop a higher timeframe bias and collect data on its success rate. While a handful of concepts were introduced in said video, this indicator focuses on one specific method that utilizes previous highs and lows. The following des

Risk Management Chart█ OVERVIEW
Risk Management Chart allows you to calculate and visualize equity and risk depend on your risk-reward statistics which you can set at the settings.
This script generates random trades and variants of each trade based on your settings of win/loss percent and shows it on the chart as dif

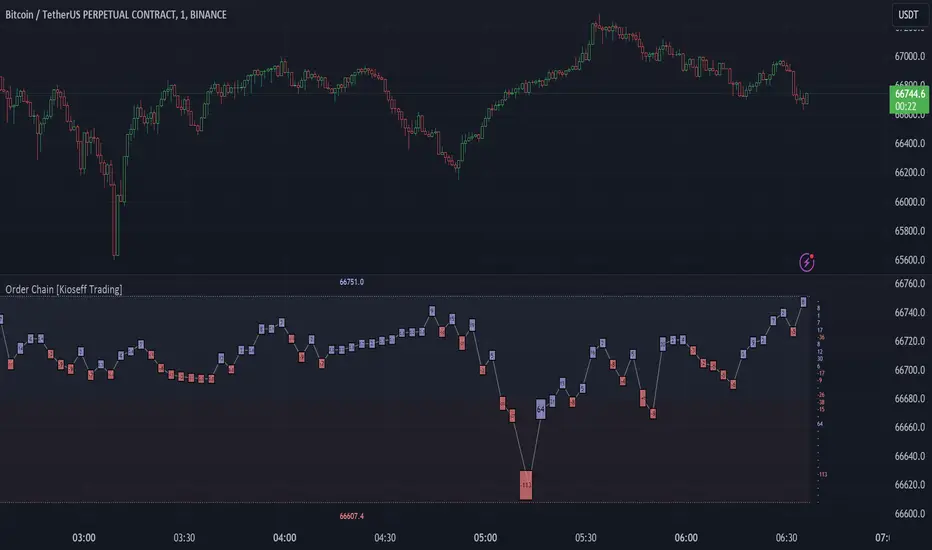
Order Chain [Kioseff Trading]Hello!
This indicator "Order Chain" uses live tick data (varip) to retrieve live tick volume.
This indicator must be used on a live market with volume data
Features
Live Tick Volume
Live Tick Volume Delta
Orders are appended to boxes, whose width and height are scaled proportional to th
Zobacz wszystkie skrypty wyboru redakcji