Crypto Buy/Sell Signals[alt] Autoview/Gunbot -CryptoProToolsA second version of Buy/Sell signals with the basis being EMAGain with an EMA channel filter.
I'm having success using this one to ladder in and out of the market.
Regresja liniowa

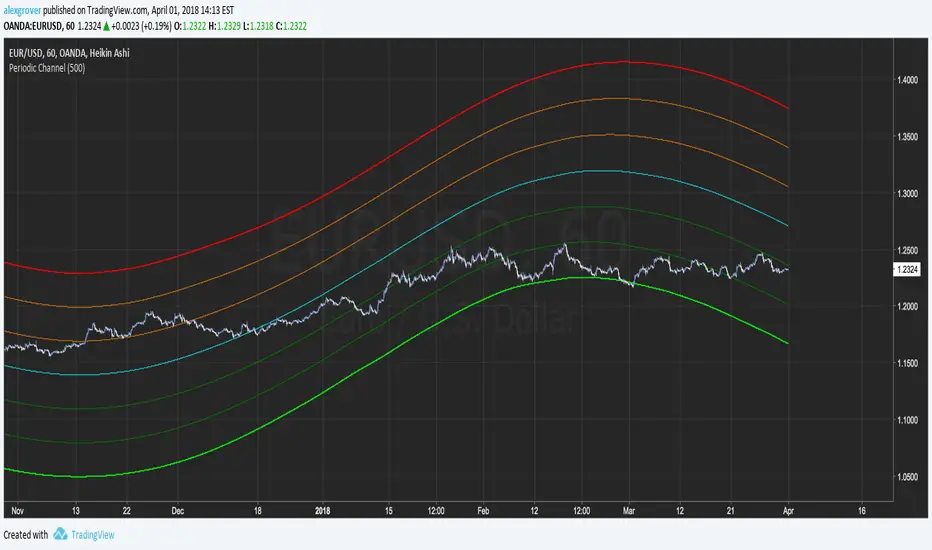
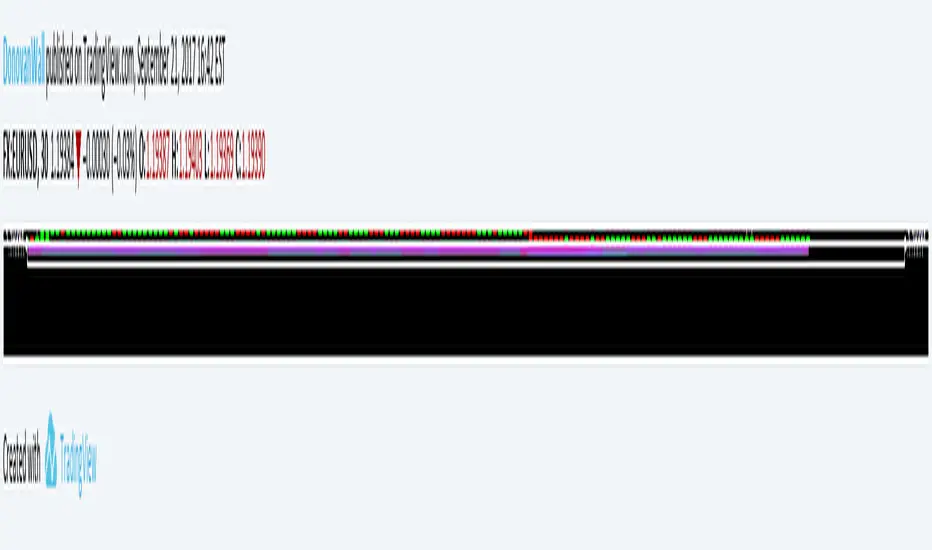
Periodic ChannelThis indicator try to create a channel by summing a re-scaled and readapted sinusoidal wave form to the price mean.
The length parameter control the speed of the sinusoidal wave form, this parameter is not converted to a sine wave period for allowing a better estimation, higher length's work better but feel free to try shorter periods.
The invert parameter invert the sinusoidal wave.
Each bands represent possible return points, the higher the band the higher the probability.
Inverted sin wave exemple
The performance of the indicator is subjective to the main estimation (blue line), select the parameter that best fit the blue line to the price.
Best ragards
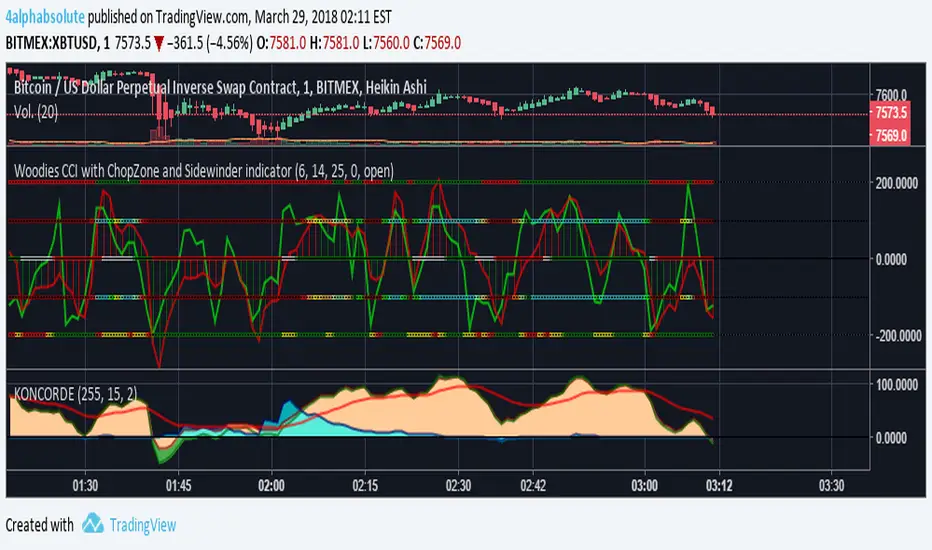
Woodies CCI with ChopZone and Sidewinder indicatorExcelente indicador a mi parecer, bastante complejo pero muy bien acoplado; dejo aquí las fuentes para aprender a utilizarlo:
www.x-trader.net
www.x-trader.net www.x-trader.net www.x-trader.net
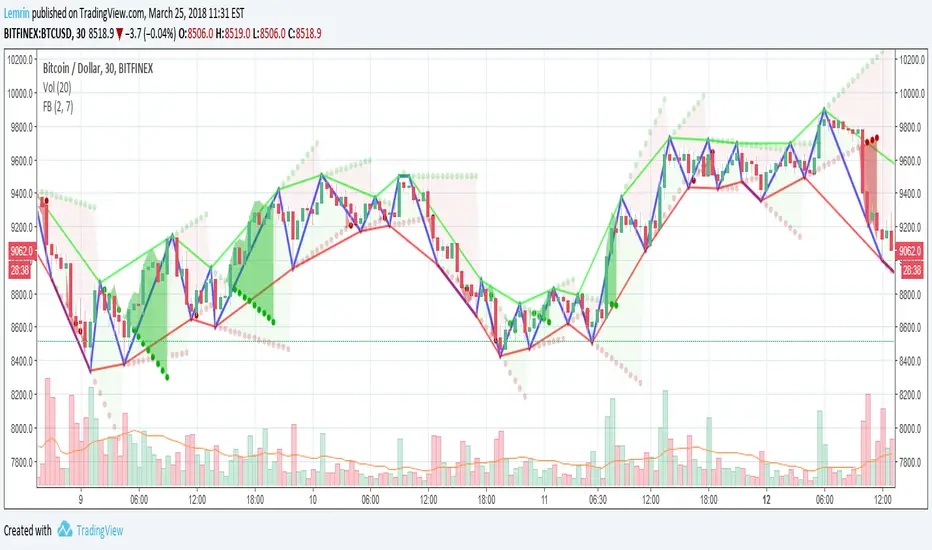
Fractal Breakout V2Version 2 of my fractal pattern aid ( Version 1 ).
I added a bouncing line between the high and low trend lines, connecting consecutive extreme points. I also chased down a pesky bug in the slope calculation...and for now I have disabled the ability to change resolution basis for extreme detection (e.g. 30m on a 1hr chart).
For fun, I added some shading to make it more apparent at a glance what is happening, but if you find it gimmicky, there's an option to turn that off.
I am inexperienced with pattern recognition, so please send feedback if you have any ideas that would make this more useful.
Thanks!
Lemrin
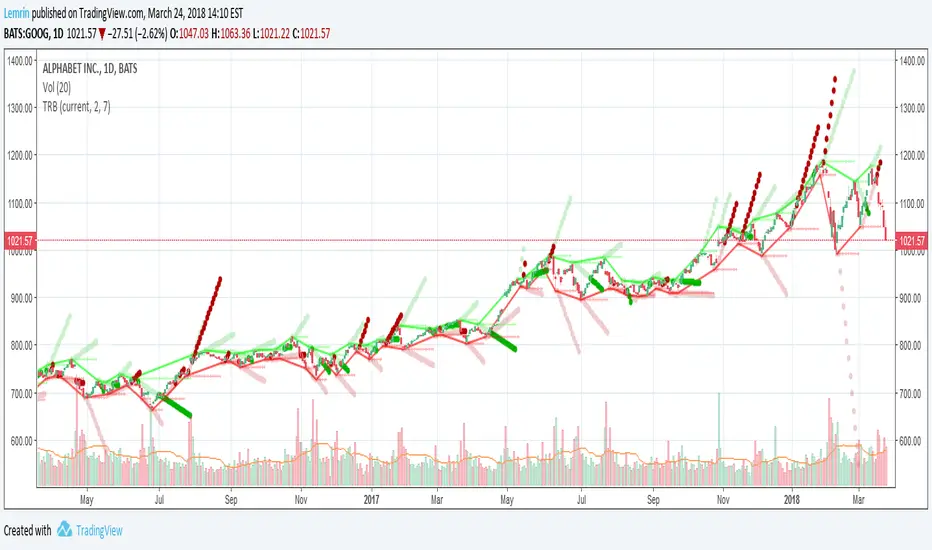
Fractal BreakoutFirst of all, huge credit to synapticEx , whose brilliant use of the security function inspired me to figure out a way to get quasi-shape boundaries automatically drawn on a chart.
This study draws upper and lower trend lines, based on configurable fractal*** reversal detection, calculates slope from the last two upper or lower reversal points, and then extends a dotted line along the same slope...until the next upper (or lower) reversal occurs. If the high (or low) breaks this extension, the dotted line becomes solid to aid visibility. Reversal detection is configurable to use any number of ticks, but probably four to eight will work best.
I made the inclusion of volume in the reversal logic optional (off by default) and left the existing SMA input found in synapticEx's code intact, albeit with a lower default. With the addition of trend lines, I found volume hindered identification of reversals, although I could try various other filters than the SMA included originally.
I have also left intact the very nice ability to change the period and use the requested period identify reversals, courtesy of synapticEx.
This could be used in a strategy, as the values plotted are actual values that are available to include in logic and do not include knowledge of the future. However , information is not available until the floor of half the number of ticks used in reversal detection (I then offset by that number to line things up visually). Having never heard of it until now, I just Googled the Bill Williams Alligator strategy, which looks interesting, so maybe I could see how this could be ported to that.
***As I typed this, I remembered that while making reversal detection configurable, I changed the detection logic simply to look for highest (or lowest) of the desired length of ticks. I don't know whether this is not strictly fractal anymore, but if desired, with a little work, I could make it require consecutive, consistent changes before and after each reversal again.
Here are a few screenshots from hourly ticks, using the "current" (hourly) period, with and without volume, and playing with the number of points used to identify reversals.
Not using volume
Using volume
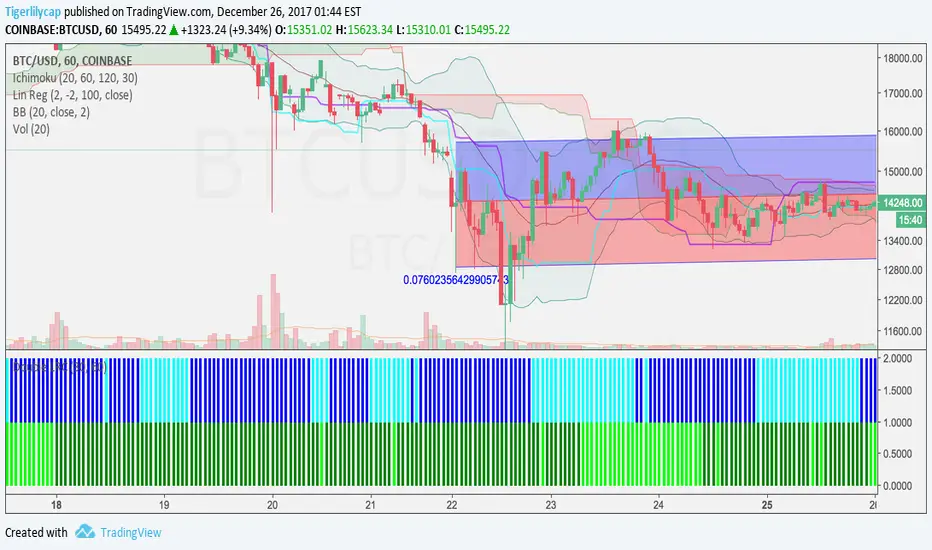
DepthHouse - Trend & Reversal CandlesticksDepth House Trend and Reversal Candlestick Indicato r is a custom trading tool designed to help traders determine trend direction, and possible trend reversal points.
Here is a video which I give a brief overview and show it in action:
youtu.be
How it works:
Based on the default settings, there are 5 primary colors that each have their own possible signal.
The colors are:
Green - Trending upwards
Red – Trending downwards
Lime –Trending upwards with a chance of reversal
Orange – Trending downwards with a chance of reversal
Grey – General trend is unknown
Please Note: There are NOT trading signals. Each colored candle represents nothing other than a possibility of which way the trend may go. Be sure to use your own adequate analysis. Use at your own financial risk.
How to get:
As you can see this is an invite only script. In the coming months this indicator, along with many others will become pay to use only. (website on my profile page)
However all my indicators will be FREE until May 1, 2018 . So please try them out!
To take advantage of this FREE trial:
1. Subscribe to my YouTube channel. I have many more videos to come! Maybe even leave a comment of what you would like to see next!
2. Comment on this indicator post! Maybe even give me a follow :D
I hope you all enjoy!!
Indicator website: depthhouse.com

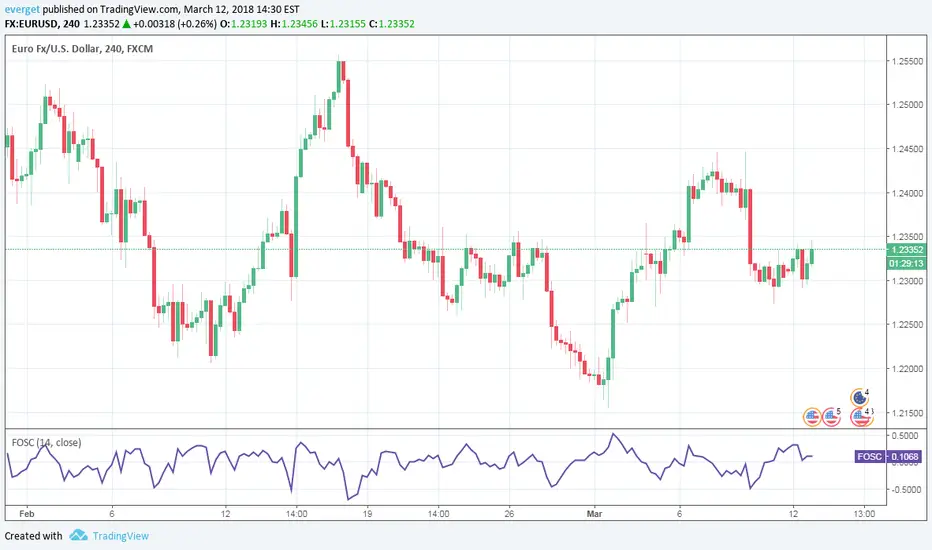
Forecast OscillatorForecast Oscillator indicator script. This indicator was originally developed by Tushar Chande.


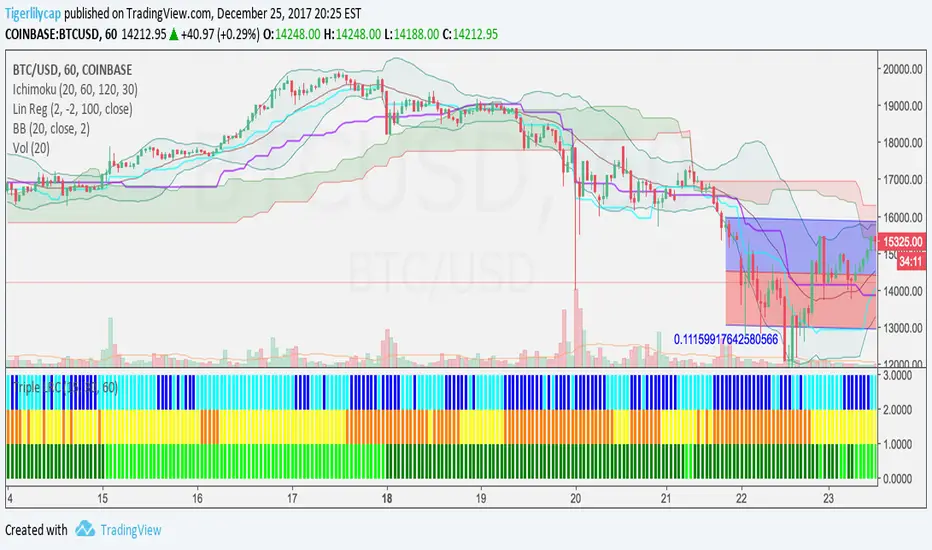
3 Linear Regression CurveFast 3LRC - 15/30/60 standard settings - 15/30 give a lot of noise, but give you a some time to prepare for the 60 to flip
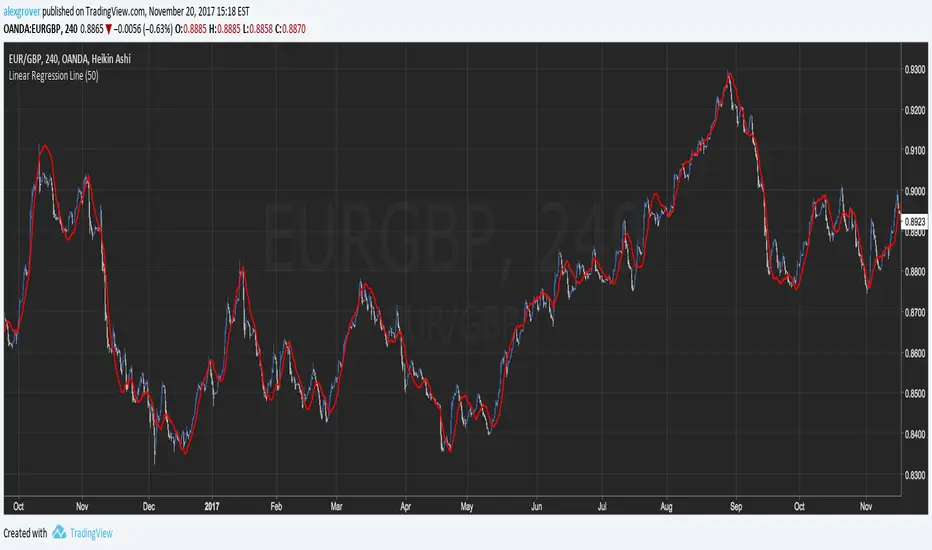
Regression Line Formula
A regression line is simply a single line that best fits the data.
In the pinescript you can plot a linear regression line using the linreg function.
Here i share the entire calculation of the linear regression line, you are free to take the code and modify the functions in the script for creating your own kind of filter.
Hope you enjoy :)
MoD Soleman Double RSI + HTF HLuses HTF trend and provides specific input on lower timeframe using a combo of RSI and HHLL criteria. tested on M5/H1 timeframes
red/green background highlights retracement zone before HTF trend should continue.
blue bar is entry point. Look for 1:1 RR before closing off 75% and riding the wave up/down :-)
Works best with trending markets but should be also work with sideways markets.

Linear Regression TrendChannel Lines based on linear regression combined with fractal divergence indicator bands.
Taylor

LRS CloudModified framework of my ULRS oscillator.
-New Cloud Visualization
-New Algorithm
PM me for access.
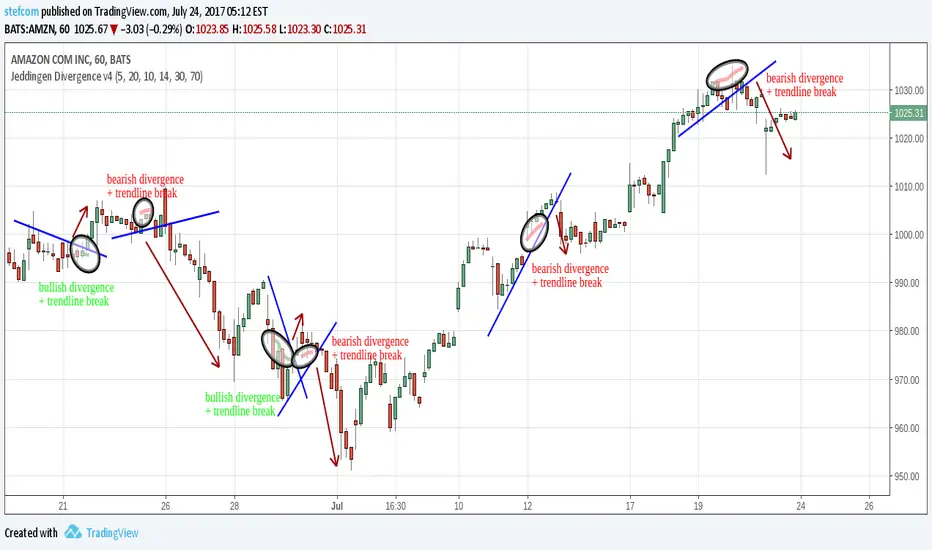
Jeddingen Divergence v4Momentum vs. price divergence. Sell signals on bearish divergence, buy signals on bullish divergence .
Indicator includes an RSI filter, alert-conditions and lots of other configuration options.
There is also a TradingView strategy available to backtest everything!
Jeddingen Divergence Strategy v4Momentum vs. price divergence. Sell signals on bearish divergence, buy signals on bullish divergence .
Strategy includes an RSI filter, limit the time-range for back-testing and lots of other configuration options.
The below example uses stop-losses.
There is also a matching TradingView study with alert-conditions available!

Candele Reg linThis are candels using 20 period Linear regression of close ,open, mim, max. Lime color if close > open and close > of last previus close. Red if close

Stefan Krecher: Jeddingen Divergence v2This is an update to my script:
Stefan-Krecher-Jeddingen-Divergence/
The behaviour is exactly the same, I just added the option to create alerts based on this indicator

ORDINARY LEAST SQUARES Slope by @XeL_ArjonaORDINARY LEAST SQUARES Slope by @XeL_Arjona
Ver. 1 by Ricardo M Arjona @XeL_Arjona
DISCLAIMER:
The Following indicator/code IS NOT intended to be a formal investment advice or recommendation by the author, nor should be construed as such. Users will be fully responsible by their use regarding their own trading vehicles/assets.
The embedded code and ideas within this work are FREELY AND PUBLICLY available on the Web for NON LUCRATIVE ACTIVITIES and must remain as is.
WHAT'S THIS?
This is a REAL mathematically approach of an ORDINARY LEAST SQUARES LINE FITTING SLOPE as TradingView currently don't have a native one embedded, neither as a pine function. Other "Sope" indicators from this linear regression model I found on public library are currently based on "momentum" rather tan slope.
Any modifications or additions are quite welcome!
Cheers!
@XeL_Arjona
BUY & SELL PRESSURE by RegressionBUY & SELL PRESSURE by Regression Analysis at candle price/volume (Rate-Of-Change)
Ver. 3 By Ricardo M Arjona @XeL_Arjona
DISCLAIMER:
The Following indicator/code IS NOT intended to be a formal investment advice or recommendation by the author, nor should be construed as such. Users will be fully responsible by their use regarding their own trading vehicles/assets.
The embedded code and ideas within this work are FREELY AND PUBLICLY available on the Web for NON LUCRATIVE ACTIVITIES and must remain as is.
WHAT'S THIS?
This is my 3rd. revision of the original implementation for AmiBroker by Karthik Marar's of it's BUY AND SELL PRESSURE INDICATORS but this time, constructed under a complete REGRESSIVE ANALYSIS premise based in Rate Of Change (A kind of Slope but measured in % Performance).
Some minimal adaptation's (and cleaning) have been made:
Instead of simple Range calculation at price, Rate Of Change (Regressive) is used.
Oscillator of Pressure can be deactivated in favor of a simple RoC Cumulative Pressures at candle.
Oscillator can read Volume data from external tickers for accurate Index calculation. ( NYA can use TVOL as example.)
Code is small, cleaner and faster =) !
Cheers!
Any feedback will be welcome...
@XeL_Arjona

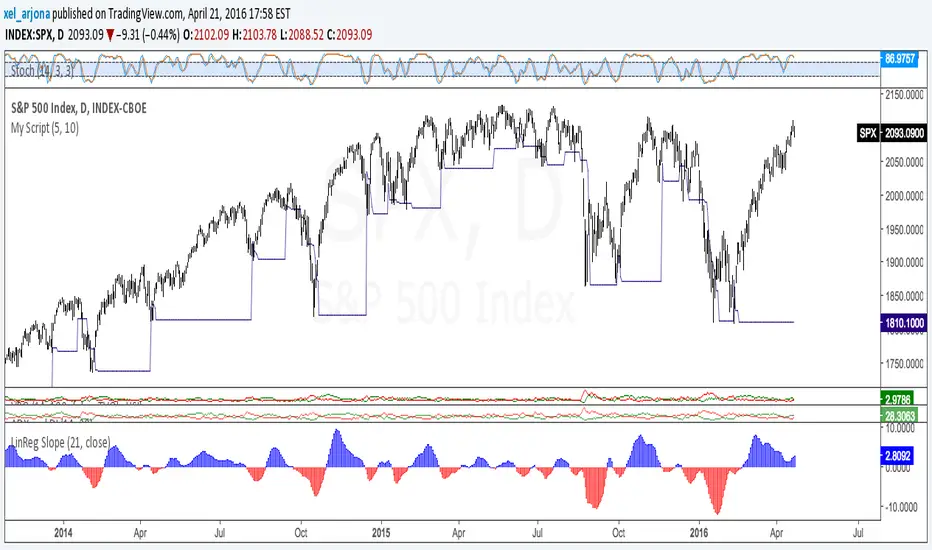
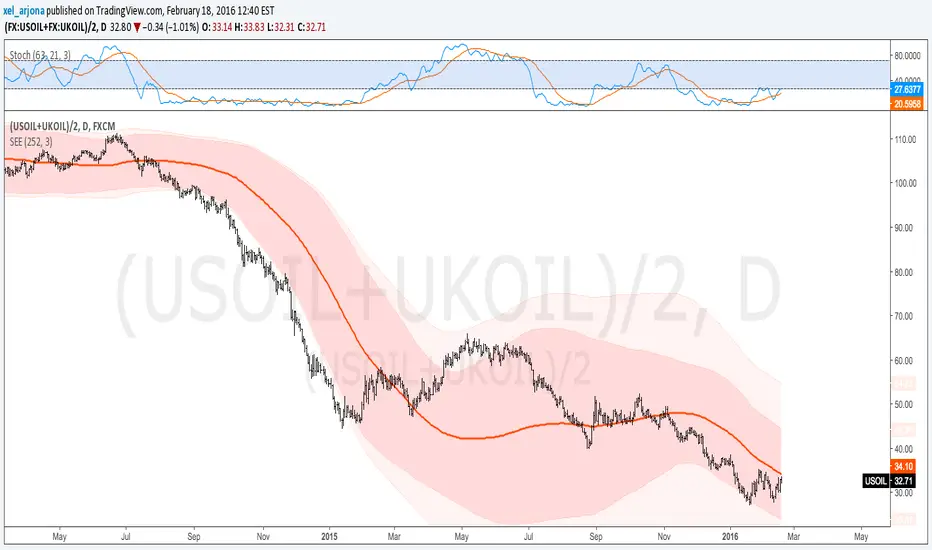
Standard Error of the Estimate -Composite Bands-Standard Error of the Estimate - Code and adaptation by @glaz & @XeL_arjona
Ver. 2.00.a
Original implementation idea of bands by:
Traders issue: Stocks & Commodities V. 14:9 (375-379):
Standard Error Bands by Jon Andersen
This code is a former update to previous "Standard Error Bands" that was wrongly applied given that previous version in reality use the Standard Error OF THE MEAN, not THE ESTIMATE as it should be used by Jon Andersen original idea and corrected in this version.
As always I am very Thankfully with the support at the Pine Script Editor chat room, with special mention to user @glaz in order to help me adequate the alpha-beta (y-y') algorithm, as well to give him full credit to implement the "wide" version of the former bands.
For a quick and publicly open explanation of this truly statistical (regression analysis) indicator, you can refer at Here!
Extract from the former URL:
Standard Error Bands are quite different than Bollinger's. First, they are bands constructed around a linear regression curve. Second, the bands are based on two standard errors above and below this regression line. The error bands measure the standard error of the estimate around the linear regression line. Therefore, as a price series follows the course of the regression line the bands will narrow, showing little error in the estimate. As the market gets noisy and random, the error will be greater resulting in wider bands.
[RS]Linear Regression Bull and Bear Power Accumulation V1EXPERIMENTAL:
Bull and Bear power based on linear regression (this is a non lagging oscillator, the parameter are for the lookup window for the donchian extremes)
this indicator can also be used for convergence/divergence.
(accidentjev2) added multi timeframe support (indicator may repaint values)
