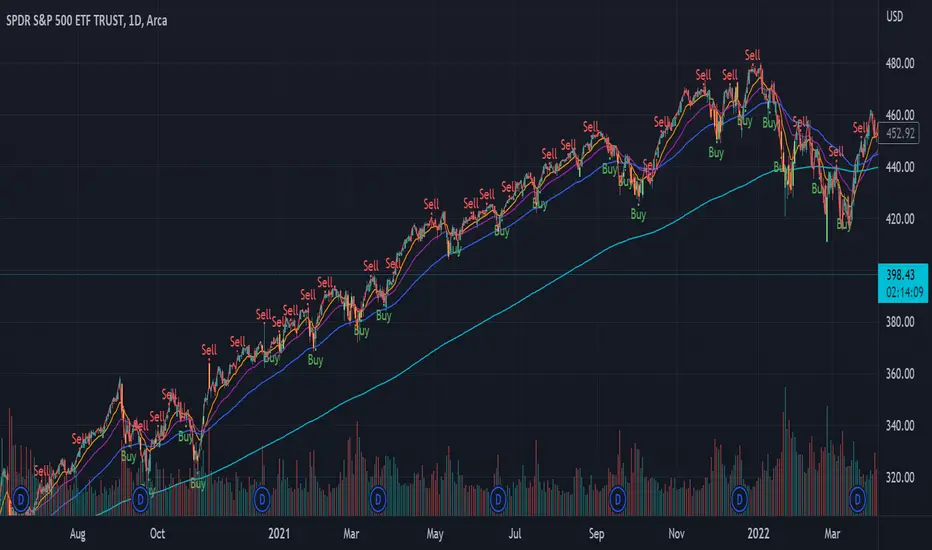
Blocky's EMA RibbonA classic EMA ribbon setup.
The script uses eight EMAs, with default lengths ranging from 21 to 55 periods, with an additional EMA with a default length of 200 periods.
The lengths of the EMAs can be customized, when customizing, the shortest time frame should be first and the longest time frame last.
The ribbons gradient strength is calculated based on the EMA's sequence, and their separation.
The color and transparency are set based on the calculated strength. The bolder the color, the stronger the strength.
Use the opacity multiplier to increase/decrease the strength of the gradient. BITSTAMP:BTCUSD
Wykładnicza średnia krocząca (EMA)
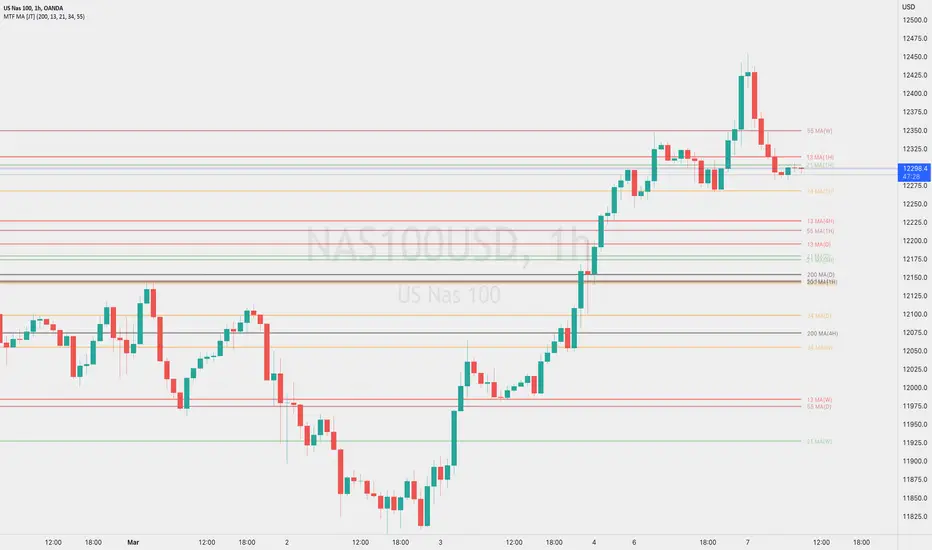
Multi Timeframe Moving AveragesThis indicator is designed to help traders analyze market trends by displaying five exponential moving averages (EMA) of their choice across four fixed intervals: weekly, daily, 4-hourly, and hourly.
The user can choose which moving averages and intervals to display, and can enable or disable these options as needed. The moving averages are drawn as lines and are updated in real-time based on the current EMA values in the respective intervals.
This indicator can help traders identify potential areas of support and resistance, as well as identify trends in the market. By displaying multiple EMAs across multiple time intervals, traders can get a more complete picture of the market and make more informed trading decisions.
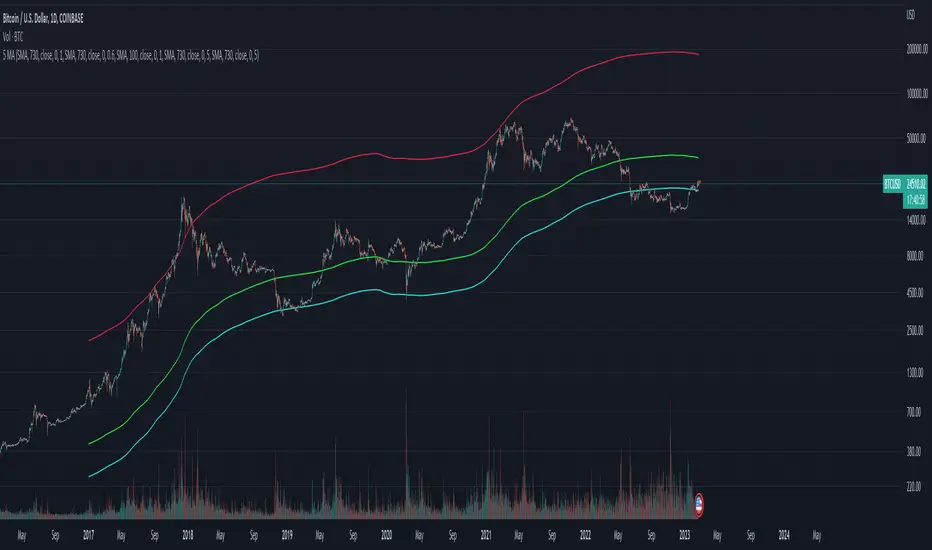
Rainbow Moving AverageA Rainbow Moving Average script. There are many like it, but this one is mine. It is designed to be easy to read without too much noise in the number of lines and shading, with the moving average to be some of the commonly used ones. Using commonly referenced moving average values help us to understand "the crowd" and what moving average or trend lines they might be looking at. The default values are derived from hourly charts, but work well on any time frame.
The moving average function is simple to change so you can use it for any moving average type that you like, including volume-weighted.
Inspired by my daughter's love of rainbows, she has approved the colors.

Zazzamira 50-25-25 Trend System Alerts OnlyPublishing my trading system script. It consist of several conditions to happen in order to open a trade. Work best on ES/MES 5 minute timeframe.
I like to use it with this settings:
- UTC -6 (don't tick Exchange Timezone)
and rest as default
To enter a trade, the following conditions must be met: Entry 1: the opening range (8:30AM - 9:15AM UTC-6) must be defined and the price must close above or below the opening range on the 5-minute timeframe. This entry condition defines the trade direction (above = long / below = short). Once the opening range is defined, the Trend-Based Fib Extension is applied from the range high to the range low (and vice versa). Fib levels are required for Exit conditions. Entry 2: the 8 - 27 - 67 - 97 EMAs must be defined. If the EMAs value order is 8 > 27 > 67 > 97, long-only trades are allowed. If the EMAs value order is 8 < 27 < 67 < 97, short-only trades are allowed. This entry condition filters fake breakouts of Entry 1. Entry 3: no trades are allowed after 12:59 UTC-6 (2PM EST). Entry 4: if Entry 1, Entry 2, and Entry 3 conditions are valid and the price hasn't reached the 23.6% Fib line, an entry order can be set at the range high/long with 4 contracts. To exit a trade, the following conditions must be met: Exit 1 (Stop loss): set a trailing stop based on 2.1x ATR (14) from entry. Exit 2: take 50% profits at the 23.6% Fib and leave trailing stop untouched. Exit 3: if Exit 2 triggers, take 50% (25% of total entry) off at 61.8% Fib, leaving Exit 2 trailing stop values valid. Exit 4: exit the full position at the FIB 100% value. Exit 5: all trades must be closed at 3pm UTC-6 (4PM EST). So basically Take Profit are 50%-25%-25% of position.
Code has been written by © Hiubris_Indicators who has been an amazing coder and gave me the possibility to make this script public so a really big shoutout to him.
This indicator only works for alerts, please check version without alerts to backtest or tweaks. This indicator is meant to be used to automate the system via webhooks

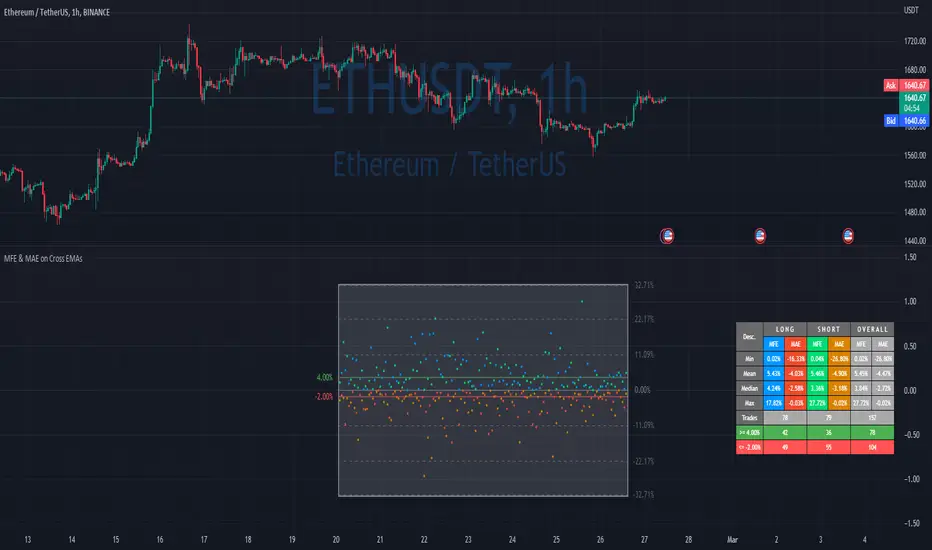
MFE & MAE ToolThis is a simple implementation of the MFE/MAE Tool for TradingView.
It's a quite powerful tool and pretty useful in systematic trading, but I don't see many trader using it these days.
It's created for EMA cross, but you can easily change it to use your own signals.
What is MAE/MFE Tool
MAE stands for Maximum Adverse Excursion - Worst P&L during the trade
MFE stands for Maximum Favorable Excursion - Best P&L during the trade
The idea is pretty simple. We take only signals without any position management or exits and measure the best/worst P&L for the next X bars after the signal was.
The primary use case for it is to understand how good your signals are .
If you'll add complicated money management tools, exits, and SL/PT to your strategy, it brings quite a lot of noise. After that, it's pretty tricky to understand if your signals bring much information about future price movements. In other words, bad money management can ruin good signals, and you might discard the entire strategy without knowing that. So this is why I think it's important to check the quality of your signals separately.
Another simple way to use it is to estimate where to put SL/PT
In this example, we're computing MAE/MFE in percent. We're plotting it both on the chart and computing some statistics based on it. This is why it's pretty easy to get a quick understanding of what is your SL/PT should be.
MAE/MFE tool consists of a:
Chart - it displays a point for every signal. Long/Short trades can have different colors. On hover you'll see details for this signal.
Table with stats - we're computing basic metrics for these Signals like average/min/median/max MAE/MFE, number of trades, and how many trades hit selected SL and PT. Stats are also separated by the side so you can see performance separately for longs and shorts.
The indicator is highly customizable, you can configure:
Bars you want to use to compute MAE/MFE
Side selection
SL and R:R
Styling of the chart
Position and style of the table
Parameters for the EMA
EMA cross and its parameter were selected randomly, so don't estimate to see a great performance here.
MFE/MAE tool is a pretty powerful concept. At some point, I'll create an entire article in my blog with more examples and descriptions.
Thanks to @MUQWISHI for helping code it.
Disclaimer
Please remember that past performance may not indicate future results.
Due to various factors, including changing market conditions, the strategy may no longer perform as well as in historical backtesting.
This post and the script don’t provide any financial advice.
Crossing TableCrossing Table V1
I created this indicator as it had been asked for a number of times to create a crossover/under table screen and here it is!!!
The indicator is set up to be selected from SMA, EMA and Volume.
The SMA is defaulted to 2/10 but it is customizable to whatever SMA you choose to use.
Volume is based off a volume formula and the volume settings in the indicators settings, and the table will show either buyers/sellers on the last candle on the volume in the settings.
Just like the SMA the EMA option will be based off the default value of 5/13 but can be customized to your choosing.
If there are any question or comments just let me know :)

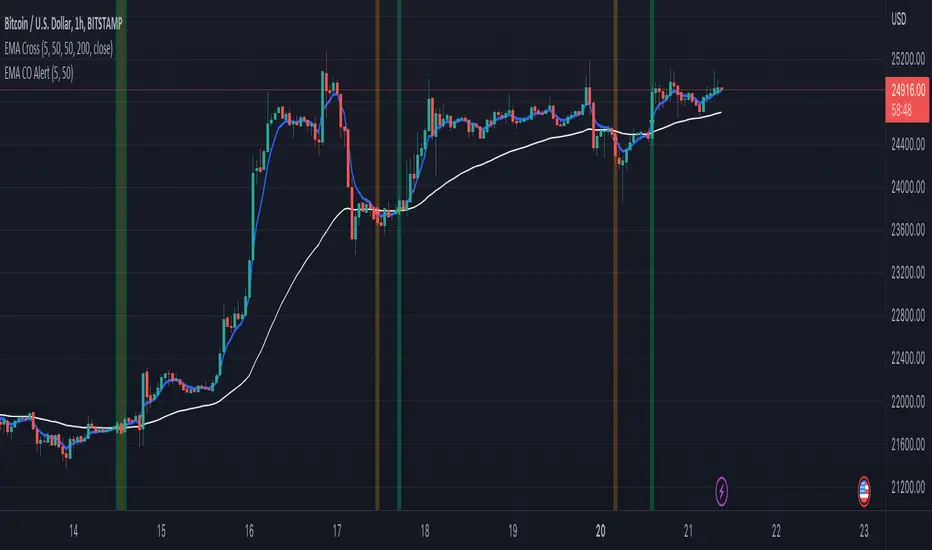
EMA CO AlertEMAs play an important role in identifying the mood of the market.
Frequently used short term EMA is 5 and long term EMA is 50.
This script detects the crossover (+ve and -ve) and generates alerts accordingly.
Steps to apply:
1) Open the script on a desired timeframe.
2) Add this indicator on the chart
3) Choose the values of the 2 EMAs from settings
4) Go to the alert window.
5) Select this indicator from the 'Condition' dropdown
6) Create the alert.
This alert will then run in the background and notify you.
Need to apply a one time alert on the scripts.
In addition to above, you can also add this indicator on the chart and it will show green/red lines on the chart for signals.
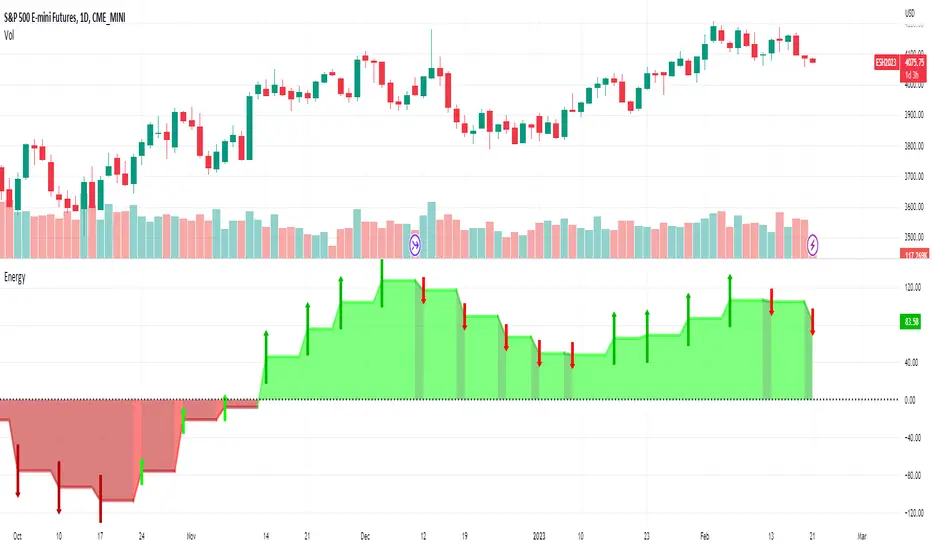
Energy_Arrows[Salty]This script quantifies the energy in a price move by comparing the relationship of 3 configurable exponential moving averages present on a slightly higher timeframe (chosen automatically based on the charts current period). It uses the closing price by default, but this is also configurable using the Source input. There are a few ways to use the information in this indicator. One is to use the values above zero (colored green) to provide a bullish bias for future price, and values below zero (colored red) indicating a bearish bias for future prices. This bias can be shown to be increasing or decreasing base on the upward or downward slope of the indicator. The green and red arrows can be enabled to show if the bias is strengthening or weakening based on the direction they are pointing. Finally, the height changes in the peaks of the indicator can be used to show divergence in the strength of extreme price moves to show when a pull back or reversal may occur.
5 Moving AveragesFive Moving averages. Choose from several types, SMA, EMA, SMMA etc... Has X and Y offset.
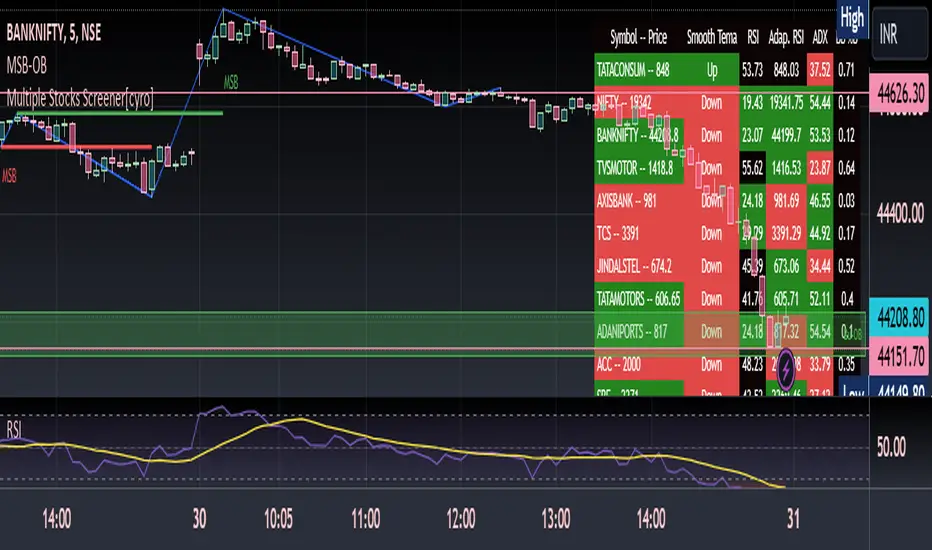
Multiple Indicators ScreenerThis is a stock screener that incorporates open source code by QuantNomad, with the addition of slow and fast EMA pullback and crossover functions. It is designed for intraday scalping and quick trades, using 1, 3, and 5 minute candles. The RSI, Supertrend, and ADX indicators help to confirm trade setups, and the use of discount, premium, and equilibrium zones can improve results. With the ability to screen 40 stocks, the screener ensures that no quick action is missed. ]
Disclaimer
It is important to note that any trade initiated using this screener should be well researched, as the creator is not responsible for any profit or loss incurred.
Advanced ADX[Intellection]█ OVERVIEW
"ADX" is a popular technical analysis indicator used to determine trend strength.
Advanced ADX is divided in two main sectors:
Default ADX
Higher time frame ADX analysis and trend phase
█ DESCRIPTION
You have two ADX's, One has the same time frame as your chart and the other one can be set by yourself in settings, Named Vision time frame.
Default value of "Vision ADX" is on 240minutes means 4hour, We recommend for time frames less than 1h using 4h "Vision time frame".
"Vision main plot" is also based on higher time frame analysis. The higher time frame analysis uses a combination of Three exponential moving averages (67, 89 and 111 periods) and the ADX to determine the position for long or short trades. The "Vision main plot" is shaded and changes color:
Green means bull phase
Red means bear phase
Gray means not defined or neutral
█ TRADING GUIDES
You can filter your signals based on "Vision ADX" value and color
Some trading tips:
When in green zone we don't recommend going short or just lower your risk for short positions. Simply for when ever your position is opposite of the color.
When ADX stays for a long period under 30 then it crosses 30 you might consider a volatility is about to come!
Good volatilities come when there is huge distance between default "ADX" and "Vision ADX"
█ Recap
"Advanced ADX" indicates three analysis:
1-Indicates default "ADX" based on your time frame.
2-Indicates higher time frame "ADX" based on the time frame you choose in settings.
3-Indicates higher time frame trend phase.
Don't forget to take time and learn it before trading it.

Momentum Trend Fusion (MTF)The Momentum Trend Fusion (MTF) is a composite indicator that combines the Awesome Oscillator and the Relative Strength Index to provide a unique perspective on market momentum and trend strength. The MTF is calculated by first running the Relative Strength Index (RSI) on the Awesome Oscillator (AO) and then applying an Exponential Moving Average (EMA) on the RSI value. The MTF is designed to help traders detect market phases and confirm trend direction by analyzing the cross of the EMA and RSI, as well as divergences between the AO and price. The MTF can be customized by the user by providing the lengths of the RSI and EMA calculations, making it an ideal tool for traders with different time frames and risk tolerances.

Moving Average Cross and RSIThis is the updated version of the MAC cross Short/ Long indicator i had posted earlier in 2022.
This script includes a RSI and EMA of the RSI with fixed OB and OS Levels.
The purpose is to refine the amount of trades taken from the moving average cross on the 30 minute timeframe.
In the overlay, the red and green dots indicate weather the moving cross is a long or a short signal.
The theory when back tested is:
When the short signal is given, the EMA must be below 30 to enter a short.
When the long signal is given, the EMA must be above 64 to enter a long, anything in between is a false signal.
Only the first dot is meant to be a long or a short signal, not meant to be interpreted as being consecutive.
The data window is meant to be built in a way to easily set up indicators or strategies using Tradelab.ai software.

Arron Meter With Alerts [Skiploss]Arron Meter With Alerts is an indicator to identify the trend, and a meter shows the percentage of AroonUP and AroonDown.
Alert Settings
It will be part of a display of bullish and bearish signals by using the condition of the upper line cross lower line and HMA 200 cross under/over EMA 12, and also upper/lower line must be higher than 70%
ATR PivotsThe "ATR Pivots" script is a technical analysis tool designed to help traders identify key levels of support and resistance on a chart. The indicator uses various metrics such as the Average True Range (ATR), Daily True Range ( DTR ), Daily True Range Percentage (DTR%), Average Daily Range (ADR), Previous Day High ( PDH ), and Previous Day Low ( PDL ) to provide a comprehensive picture of the volatility and movement of a security. The script also includes an EMA cloud and 200 EMA for trend identification and a 1-minute ATR scalping strategy for traders to make informed trading decisions.
ATR Detail:-
The ATR is a measure of the volatility of a security over a given period of time. It is calculated by taking the average of the true range (the difference between the high and low of a security) over a set number of periods. The user can input the number of periods (ATR length) to be used for the ATR calculation. The script also allows the user to choose whether to use the current close or not for the calculation. The script calculates various levels of support and resistance based on the relationship between the security's range ( high-low ) and the ATR. The levels are calculated by multiplying the ATR by different Fibonacci ratios (0.236, 0.382, 0.5, 0.618, 0.786, 1.000) and then adding or subtracting the result from the previous close. The script plots these levels on the chart, with the -100 level being the most significant level. The user also has an option to choose whether to plot all Fibonacci levels or not.
DTR and DTR% Detail:-
The Daily True Range Percentage (DTR%) is a metric that measures the daily volatility of a security as a percentage of its previous close. It is calculated by dividing the Daily True Range ( DTR ) by the previous close. DTR is the range between the current period's high and low and gives a measure of the volatility of the security on a daily basis. DTR% can be used as an indicator of the percentage of movement of the security on a daily basis. In this script, DTR% is used in combination with other metrics such as the Average True Range (ATR) and Fibonacci ratios to calculate key levels of support and resistance for the security. The idea behind using DTR% is that it can help traders to better understand the daily volatility of the security and make more informed trading decisions.
For example, if a security has a DTR% of 2%, it suggests that the security has a relatively low level of volatility and is less likely to experience significant price movements on a daily basis. On the other hand, if a security has a DTR% of 10%, it suggests that the security has a relatively high level of volatility and is more likely to experience significant price movements on a daily basis.
ADR:-
The script then calculates the ADR (Average Daily Range) which is the average of the daily range of the security, using the formula (Period High - Period Low) / ATR Length. This gives a measure of the average volatility of the security on a daily basis, which can be useful for determining potential levels of support and resistance .
PDH /PDL:-
The script also calculates PDH (Previous Day High) and PDL (Previous Day Low) which are the High and low of the previous day of the security. This gives a measure of the previous day's volatility and movement, which can be useful for determining potential levels of support and resistance .
EMA Cloud and 200 EMA Detail:-
The EMA cloud is a technical analysis tool that helps traders identify the trend of the market by comparing two different exponential moving averages (EMAs) of different lengths. The cloud is created by plotting the fast EMA and the slow EMA on the chart and filling the space between them. The user can input the length of the fast and slow EMA , and the script will calculate and plot these EMAs on the chart. The space between the two EMAs is then filled with a color that represents the trend, with green indicating a bullish trend and red indicating a bearish trend . Additionally, the script also plots a 200 EMA , which is a commonly used long-term trend indicator. When the fast EMA is above the slow EMA and the 200 EMA , it is considered a bullish signal, indicating an uptrend. When the fast EMA is below the slow EMA and the 200 EMA , it is considered a bearish signal, indicating a downtrend. The EMA cloud and 200 EMA can be used together to help traders identify the overall trend of the market and make more informed trading decisions.
1 Minute ATR Scalping Strategy:-
The script also includes a 1-minute ATR scalping strategy that can be used by traders looking for quick profits in the market. The strategy involves using the ATR levels calculated by the script as well as the EMA cloud and 200 EMA to identify potential buy and sell opportunities. For example, if the 1-minute ATR is above 11 in NIFTY and the EMA cloud is bullish , the strategy suggests buying the security. Similarly, if the 1-minute ATR is above 30 in BANKNIFTY and the EMA cloud is bullish , the strategy suggests buying the security.
Inside Candle:-
The Inside Candle is a price action pattern that occurs when the current candle's high and low are entirely within the range of the previous candle's high and low. This pattern indicates indecision or consolidation in the market and can be a potential sign of a trend reversal. When used in the 15-minute chart, traders can look for Inside Candle patterns that occur at key levels of support or resistance. If the Inside Candle pattern occurs at a key level and the price subsequently breaks out of the range of the Inside Candle, it can be a signal to enter a trade in the direction of the breakout. Traders can also use the Inside Candle pattern to trade in a tight range, or to reduce their exposure to a current trend.
Risk Management:-
As with any trading strategy, it is important to practice proper risk management when using the ATR Pivots script and the 1-minute ATR scalping strategy. This may include setting stop-loss orders, using appropriate position sizing, and diversifying your portfolio. It is also important to note that past performance is not indicative of future results and that the script and strategy provided are for educational purposes only.
In conclusion, the "ATR Pivots" script is a powerful tool that can help traders identify key levels of support and resistance , as well as trend direction. The additional metrics such as DTR , DTR%, ADR, PDH , and PDL provide a more comprehensive picture of the volatility and movement of the security, making it easier for traders to make better trading decisions. The inclusion of the EMA cloud and 200 EMA for trend identification, and the 1-minute ATR scalping strategy for quick profits can further enhance a trader's decision-making process. However, it is important to practice proper risk management and understand that past performance is not indicative of future results.
Special thanks to satymahajan for the idea of clubbing Average True Range with Fibonacci levels.

Exponential Bollinger Bands (EBB)This script is a variation of the popular Bollinger Bands indicator, which uses exponential moving averages (EMA) instead of simple moving averages (SMA) as its core calculation. The indicator is designed to provide a visual representation of volatility, with the distance between the upper and lower bands being determined by the standard deviation of the underlying data.
The script starts by defining a number of helper functions that are used to calculate the moving averages and standard deviations required for the indicator. The first helper function is sma(), which calculates the simple moving average of the input data over a specified length. This function uses linear interpolation to smooth the data when the length is not an integer. The stdev() function calculates the standard deviation of the input data using the simple moving average calculated by the sma() function.
The bes() function calculates the exponential moving average of the input data over a specified length. The estdev() function calculates the standard deviation of the input data using the exponential moving average calculated by the bes() function.
The estdev function calculates the standard deviation using an exponential moving average method, rather than the traditional simple moving average method used by the stdev function. The exponential moving average method gives more weight to recent data, which can make the estdev more responsive to recent changes in volatility. This can make it more useful in certain types of analysis, such as identifying trends in volatility. Additionally, it also uses the same EMA algorithm to calculate the average value of the data set, which can help to keep the output of the estdev and average functions consistent.
The script also defines two more helper functions, average() and standard_deviation(), which allow the user to switch between using simple moving averages (SMA) and exponential moving averages (EMA) as the basis for the indicator. These functions take three arguments, the input data, the length of the moving average, and a string that specifies whether to use SMA or EMA.
The script then defines the input parameters for the indicator. The user can choose whether to use SMA or EMA as the basis for the indicator using the select parameter. The user can also specify the length of the moving average and the multiplier for the standard deviation using the length and multiplier parameters, respectively.
Finally, the script calculates the average and standard deviation of the input data using the selected method (SMA or EMA), and plots the upper and lower bands of the indicator. The upper band is calculated as the average plus the standard deviation multiplied by the specified multiplier, while the lower band is calculated as the average minus the standard deviation multiplied by the specified multiplier.

Power Indicator - EMAs + VWAP + Volume BarThe Power Indicator is intended to return some exponential moving average, vwap, volume bar, and others. With this compilation, you will be able to use them as one indicator in Trading View.
The components are:
- EMA9 - Exponential Moving Average of 9 days
- EMA21 - Exponential Moving Average of 21 days
- EMA50 - Exponential Moving Average of 50 days
- EMA200 - Exponential Moving Average of 200 days
- Volume Bar - This indicator provides the volume of the candle and its strength by showing different colors. It's a way to check expressive volume in one bar.
- Vwap line
- Indicator
If you have any questions, let me know!
Ma PullbackThis indicator is based on ema band....
condition for buy =>
1) price should crossover ema band
2) price pullback on ema band but price should not close below lower band
3)after pullback green candle should close above ema band
4)check candle size when its crossing ema band
5)check previous canlde 7 should not touching cloud so (we can reduce range signal)
condition for sell =>
1) price should crossunder ema band
2) price pullback on ema band but price should not close above upper band
3)after pullback red candle should crossunder ema band
4)check candle size when its crossing ema band
5)check previous canlde 7 should not touching cloud so (we can reduce range signal)
this indicator also for education purpuse how we can make pullback condition....

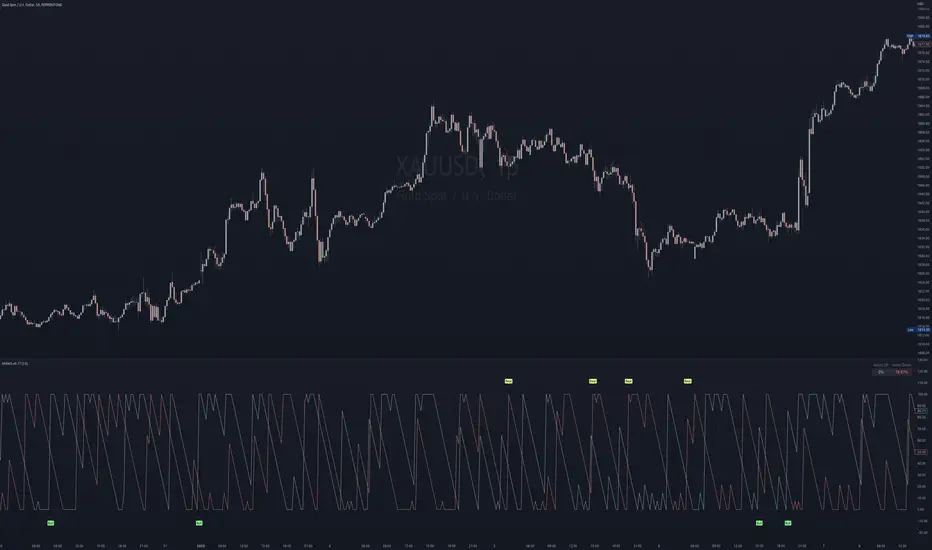
Multi SMI Ergodic OscillatorThe Multi SMI Ergodic Oscillator (Multi SMIEO) indicator can be used to identify potential buy and sell signals based on the relationship between the TSI and EMA lines.
The script is creating an indicator that plots multiple (3) sets of Time Series Indicator (TSI-Indicator) and Exponential Moving Average (EMA-Signal) lines as a single indicator.
The TSI is a momentum oscillator that helps identify overbought and oversold conditions. It is calculated using the close prices of an asset, a short-term moving average, and a long-term moving average. The script uses three different pairs of input values for the short-term and long-term periods, which can be adjusted by the user.
The EMA is a type of moving average that gives more weight to recent prices. It is calculated by applying a weighting factor to the most recent price, and then adding that weighted value to the previous EMA value. The script uses three different input values for the length of the EMA, which can also be adjusted by the user.
After calculating the TSI and EMA for each set, the script plots them on the same graph, with different colors and widths to differentiate them. The three sets of TSI and EMA lines are plotted to allow the user to compare the results of different periods. The script also plots a horizontal line at zero, which is used as a reference point for the oscillations of the indicator lines.
One way to use this indicator is to look for crossovers between the TSI and the EMA lines. A bullish crossover occurs when the TSI crosses above the EMA. This suggests that the buying pressure is increasing and a potential buy signal is generated. A bearish crossover occurs when the TSI crosses below the EMA. This suggests that the selling pressure is increasing and a potential sell signal is generated.
Some other ways that the indicator can be used include:
1. Identifying trends: The TSI and EMA lines can be used to identify the direction of the trend. An uptrend is present when the TSI and EMA lines are both trending upwards, while a downtrend is present when the TSI and EMA lines are both trending downwards.
2. Overbought and oversold conditions: The TSI can be used to identify overbought and oversold conditions. When the TSI is above the upper limit of the range, the asset is considered overbought and may be due for a price correction. Conversely, when the TSI is below the lower limit of the range, the asset is considered oversold and may be due for a price rebound.
3. Confirming price action: The Multi SMIEO indicator can be used to confirm price action. If a bullish divergence is present, it confirms a potential bullish reversal. If a bearish divergence is present, it confirms a potential bearish reversal.
4. Multiple time frame analysis: By using different periods for the TSI and EMA lines, the indicator can be used to analyze the asset on multiple time frames. It can be useful to compare the results of different periods to get a better understanding of the asset's price movements.
5. Risk management: This indicator can be used as an element of risk management strategy, it can help traders to identify overbought and oversold conditions to set stop loss or take profit levels.
The Multi SMI Ergodic Oscillator (Multi SMIEO) is a versatile indicator that can be used in a number of ways to analyze the price movements of an asset. It can be used to identify potential buy and sell signals, trends, overbought and oversold conditions, and to confirm price action. By using different periods for the TSI and EMA lines, the indicator can also be used to analyze the asset on multiple time frames. However, it is important to remember that indicators are based on historical data, and past performance does not guarantee future results.
It is important to use the indicator as part of a comprehensive trading strategy that includes risk management and other analysis techniques, such as fundamental and technical analysis. It is also important to keep in mind that indicators are not a standalone solution for trading, they should be used in conjunction with other market analysis and research techniques to generate better results.
Lastly, it is important to keep in mind that trading in financial markets comes with a certain level of risk and it is crucial to always have a proper risk management plan in place. Never invest more than you can afford to lose.

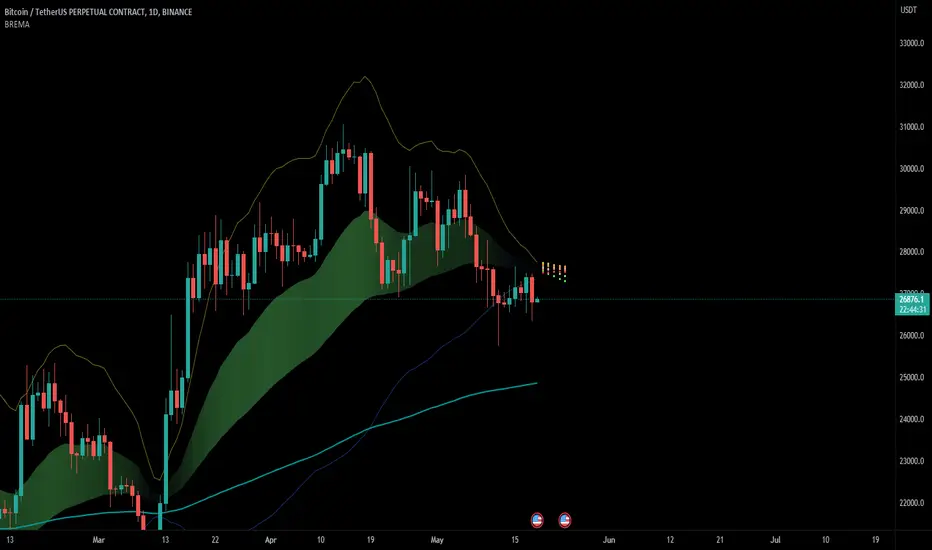
Market Structure MA Based BOS [liwei666]
🎲 Overview
🎯 This BOS(Break Of Structure) indicator build based on different MA such as EMA/RMA/HMA, it's usually earlier than pivothigh() method
when trend beginning, customer your BOS with 2 parameters now.
🎲 Indicator design logic
🎯 The logic is simple and code looks complex, I‘ll explain core logic but not code details.
1. use close-in EMA's highest/lowest value mark as SWING High/Low when EMA crossover/under,
not use func ta.pivothigh()/ta.pivotlow()
2. once price reaching EMA’s SWING High/Low, draw a line link High/Low to current bar, labled as BOS
3. find regular pattern benefit your trading.
🎲 Settings
🎯 there are 4 input properties in script, 2 properties are meaningful in 'GRP1' another 2 are display config in 'GRP2'.
GRP1
MA_Type: MA type you can choose(EMA/RMA/SMA/HMA), default is 'HMA'.
short_ma_len: MA length of your current timeframe on chart
GRP2
show_short_zz: Show short_ma Zigzag
show_ma_cross_signal: Show ma_cross_signal
🎲 Usage
🎯 BOS signal usually worked fine in high volatility market, low volatility is meaningless.
🎯 We can see that it performs well in trending market of different symbols, and BOS is an opportunity to add positions
BINANCE:BTCUSDTPERP
BINANCE:ETHUSDTPERP
🎯 MA Based signal is earlier than pivothigh()/pivotlow() method when trend beginning. it means higher profit-loss rate.
🎯 any questions or suggestion please comment below.
Additionally, I plan to publish 20 profitable strategies in 2023; indicatior not one of them,
let‘s witness it together!
Hope this indicator will be useful for you :)
enjoy! 🚀🚀🚀

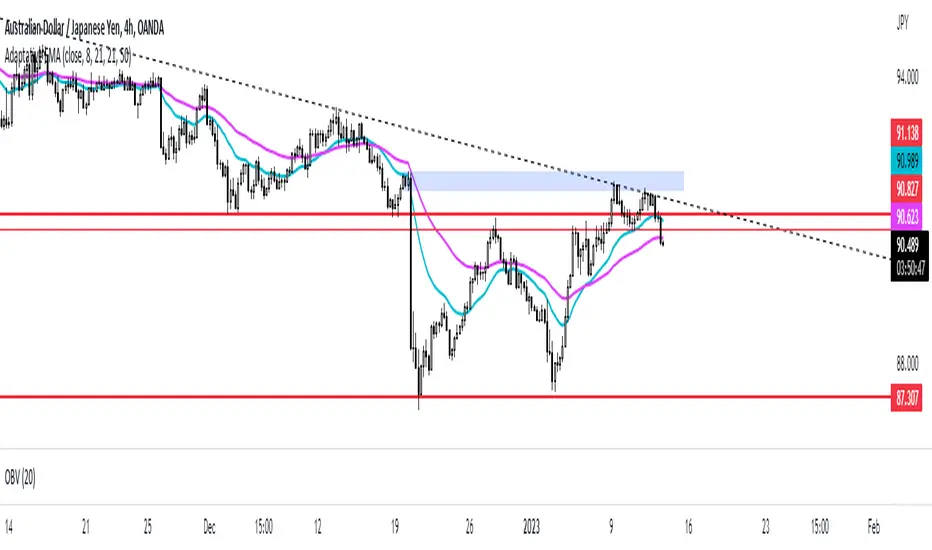
Adaptative EMAThis script prints different EMA if I am on a intraday timeframe or a daily or higher timeframe by using one indicator only.
It helps me to bring confluences for my price action strategy.
Multi-Timeframe MA Based Zigzag[liwei666]🎲 Overview
🎯 This Zigzag indicator build based on different MA such as EMA/HMA/RMA/SMA, support multi-timeframe setting .
you can get customer zigzag indicator by change short/long ma length and high-timeframe config(5m/15m/30m/1h/2h) in any symbol.
🎲 Indicator design logic
🎯 entired logic is simple and code looks complex, I‘ll explain core logic here, code already equipped with detailed comments.
1. use close-in EMA's highest/lowest value mark as SWING High/Low when EMA crossover/under, not use func ta.pivothigh()/ta.pivotlow()
2. when EMA crossover/under plot a char as signal like ●/❄/▲, crossover get blue char crossunder get red char
3. latest zigzag line is not drawn until EMA is turned (crossover/under), but signal is realtime
4. you can see diff zigzag structure when you open high-timeframe config, then find regular pattern benefit your trading.
🎲 Settings
🎯 there are 3 group properties in script, just focus on 5 properties in 'GRP1' ,
'GRP2' and 'GRP3' are display config.
'GRP1':
MA_Type: MA type you can choose(EMA/RMA/SMA/HMA/WMA), default is EMA
short_ma_len: short MA length of your current timeframe on chart
long_ma_len: long MA length of your current timeframe on chart
htf_ma_len: MA length of high timeframe, MA type same as 'MA_Type' config
htf_ma_tf: high timeframe ma length, 15/30/60/120 minute
'GRP2':
• show_short_zz • show_long_zz • show_htf_zz:
'GRP3':
• show_short_ma_line • show_short_ma_signal
• show_long_ma_line • show_long_ma_signal
• show_htf_ma_line • show_htf_ma_signal
🎲 Usage
🎯 As we know, MA based signal usually worked fine in trend market , low volatility is unprofitable.
🎯 One of pattern as the chart show below.
1. success example : after a blue ▲ signal, entry long when blue ● signal appear, marked with green box.
2. failed example: after a blue ▲ signal, a red ▼ signal appear, marked with white box.
🎯 BoS(Break of Structure) based on ma zigzag is a good idea I'm implementing, it will be published in next script.
Additionally, I plan to publish 20 profitable strategies in 2023; this indicatior not one of them,
let‘s witness it together!
Hope this indicator will be useful for you :)
enjoy! 🚀🚀🚀

Price Cross ━ [whvntr]This oscillator is an attractive way to view hidden price divergence... The formula originated from the Lark, but I have cleanly displayed this information. When the two moving averages (ema) cross with a simple moving average, you find the hidden price divergence. What kind of market should you use this in? It works well when a trend is already established.
Disclaimer: This indicator does not constitute investment advice. Trade at your own
risk with this method of identifying hidden price divergence.
