OverUnder Yield Spread🗺️ OverUnder is a structural regime visualizer , engineered to diagnose the shape, tone, and trajectory of the yield curve. Rather than signaling trades directly, it informs traders of the world they’re operating in. Yield curve steepening or flattening, normalizing or inverting — each regime reflects a macro pressure zone that impacts duration demand, liquidity conditions, and systemic risk appetite. OverUnder abstracts that complexity into a color-coded compression map, helping traders orient themselves before making risk decisions. Whether you’re in bonds, currencies, crypto, or equities, the regime matters — and OverUnder makes it visible.
🧠 Core Logic
Built to show the slope and intent of a selected rate pair, the OverUnder Yield Spread defaults to 🇺🇸US10Y-US2Y, but can just as easily compare global sovereign curves or even dislocated monetary systems. This value is continuously monitored and passed through a debounce filter to determine whether the curve is:
• Inverted, or
• Steepening
If the curve is flattening below zero: the world is bracing for contraction. Policy lags. Risk appetite deteriorates. Duration gets bid, but only as protection. Stocks and speculative assets suffer, regardless of positioning.
📍 Curve Regimes in Bull and Bear Contexts
• Flattening occurs when the short and long ends compress . In a bull regime, flattening may reflect long-end demand or fading growth expectations. In a bear regime, flattening often precedes or confirms central bank tightening.
• Steepening indicates expanding spread . In a bull context, this may signal healthy risk appetite or early expansion. In a bear or crisis context, it may reflect aggressive front-end cuts and dislocation between short- and long-term expectations.
• If the curve is steepening above zero: the world is rotating into early expansion. Risk assets behave constructively. Bond traders position for normalization. Equities and crypto begin trending higher on rising forward expectations.
🖐️ Dynamically Colored Spread Line Reflects 1 of 4 Regime States
• 🟢 Normal / Steepening — early expansion or reflation
• 🔵 Normal / Flattening — late-cycle or neutral slowdown
• 🟠 Inverted / Steepening — policy reversal or soft landing attempt
• 🔴 Inverted / Flattening — hard contraction, credit stress, policy lag
🍋 The Lemon Label
At every bar, an anchored label floats directly on the spread line. It displays the active regime (in plain English) and the precise spread in percent (or basis points, depending on resolution). Colored lemon yellow, neither green nor red, the label is always legible — a design choice to de-emphasize bias and center the data .
🎨 Fill Zones
These bands offer spatial, persistent views of macro compression or inversion depth.
• Blue fill appears above the zero line in normal (non-inverted) conditions
• Red fill appears below the zero line during inversion
🧪 Sample Reading: 1W chart of TLT
OverUnder reveals a multi-year arc of structural inversion and regime transition. From mid-2021 through late 2023, the spread remains decisively inverted, signaling persistent flattening and credit stress as bond prices trended sharply lower. This prolonged inversion aligns with a high-volatility phase in TLT, marked by lower highs and an accelerating downtrend, confirming policy lag and macro tightening conditions.
As of early 2025, the spread has crossed back above the zero baseline into a “Normal / Steepening” regime (annotated at +0.56%), suggesting a macro inflection point. Price action remains subdued, but the shift in yield structure may foreshadow a change in trend context — particularly if follow-through in steepening persists.
🎭 Different Traders Respond Differently:
• Bond traders monitor slope change to anticipate policy pivots or recession signals.
• Equity traders use regime shifts to time rotations, from growth into defense, or from contraction into reflation.
• Currency traders interpret curve steepening as yield compression or divergence depending on region.
• Crypto traders treat inversion as a liquidity vacuum — and steepening as an early-phase risk unlock.
🛡️ Can It Compare Different Bond Markets?
Yes — with caveats. The indicator can be used to compare distinct sovereign yield instruments, for example:
• 🇫🇷FR10Y vs 🇩🇪DE10Y - France vs Germany
• 🇯🇵JP10Y vs 🇺🇸US10Y - BoJ vs Fed policy curves
However:
🙈 This no longer visualizes the domestic yield curve, but rather the differential between rate expectations across regions
🙉 The interpretation of “inversion” changes — it reflects spread compression across nations , not within a domestic yield structure
🙊 Color regimes should then be viewed as relative rate positioning , not absolute curve health
🙋🏻 Example: OverUnder compares French vs German 10Y yields
1. 🇫🇷 Change the long-duration ticker to FR10Y
2. 🇩🇪 Set the short-duration ticker to DE10Y
3. 🤔 Interpret the result as: “How much higher is France’s long-term borrowing cost vs Germany’s?”
You’ll see steepening when the spread rises (France decoupling), flattening when the spread compresses (convergence), and inversions when Germany yields rise above France’s — historically rare and meaningful.
🧐 Suggested Use
OverUnder is not a signal engine — it’s a context map. Its value comes from situating any trade idea within the prevailing yield regime. Use it before entries, not after them.
• On the 1W timeframe, OverUnder excels as a macro overlay. Yield regime shifts unfold over quarters, not days. Weekly structure smooths out rate volatility and reveals the true curvature of policy response and liquidity pressure. Use this view to orient your portfolio, define directional bias, or confirm long-duration trend turns in assets like TLT, SPX, or BTC.
• On the 1D timeframe, the indicator becomes tactically useful — especially when aligning breakout setups or trend continuations with steepening or flattening transitions. Daily views can also identify early-stage regime cracks that may not yet be visible on the weekly.
• Avoid sub-daily use unless you’re anchoring a thesis already built on higher timeframe structure. The yield curve is a macro construct — it doesn’t oscillate cleanly at intraday speeds. Shorter views may offer clarity during event-driven spikes (like FOMC reactions), but they do not replace weekly context.
Ultimately, OverUnder helps you decide: What kind of world am I trading in? Use it to confirm macro context, avoid fighting the curve, and lean into trades aligned with the broader pressure regime.
Curve

Birdies [LuxAlgo]The Birdies indicator uses a unique technique to provide support/resistance curves based on a circle connecting the last swing high/low.
A specific, customizable part of this circle acts as a curve of interest, which can trigger visual breakout signals.
🔶 USAGE
The script projects a bird-like pattern when a valid Swing point is found. Multiple customization options are included.
🔹 Trend & Support/Resistance Tool
The color fill patterns and the wing boundaries can give insights into the current trend direction as well as serve as potential support/resistance areas.
In the example above, "Birdies" coincide with pullback and support/resistance zones.
🔹 Swing Length & Buffer
Besides the "Swing Length", with higher values returning longer-term Swing Levels, the script's behavior can be fine-tuned with filters ("Settings" - "Validation").
🔹 Validation
To minimize clutter, three filters are included:
Minimum X-Distance: The minimum amount of bars between subsequent Swings
Minimum Y-Distance: The minimum amount of bars between subsequent Swings
Buffer (Multiple of ATR)
The "Minimum X/Y-Distance" creates a zone where a new Swing is considered invalid. Only when the Swing is out of the zone, can it be considered valid.
In other words, in the example above, a Swing High can only be valid when enough bars/time have passed, and the difference between the last Swing and the previous is more than the ATR multiplied by the "Minimum Y-Distance" factor.
The "Buffer" creates a line above/below the "Birdy", derived from the measured ATR at the conception of the "Birdy" multiplied with a factor ("Buffer").
When the closing price crosses the "Birdy", it must also surpass this buffer line to produce a valid signal, lowering the risk of clutter as a result.
🔶 DETAILS
Birdies are derived from a circle that connects two Swing points. The left-wing curve originates from the most recent "Swing point" to the last value on the circle before crossing its midline. The mirror image of the left wing creates the right wing.
Enabling "Origine" will draw a line from the last Swing to the first.
🔹 Style
The publication includes a style setting with four options.
The first, "Birdy," shows a bird-like shape derived from a circle connecting the last Swing High and Swing Low.
The second option holds everything from the first option but connects both wingtips, providing potential horizontal levels of interest.
When setting "Birdy" to "None", the visual breakout signals will not defer from previous settings, but the focus is shifted towards the fill color, which can help detect potential trend shift.
A fourth setting, "Left Wing", will only show the left part of the "Birdy" pattern, removing the right part from the equation. This will change the visual breakout signals, providing alternative signals.
🔶 SETTINGS
Swing Length: The period used for swing detection, with higher values returning longer-term Swing Levels.
🔹 Validation
Minimum X-Distance: The minimum amount of bars between subsequent Swings
Minimum Y-Distance: The minimum amount of bars between subsequent Swings
Buffer (Multiple of ATR)
🔹 Style
Bullish Patterns: Enable / color
Bearish Patterns: Enable / color
Buffer Zone: Show / Color
Color Fill: Show color fill between two Birdies (if available)
Origine: Show the line between both Swing Points
🔹 Calculation
Calculated Bars: Allows the usage of fewer bars for performance/speed improvement

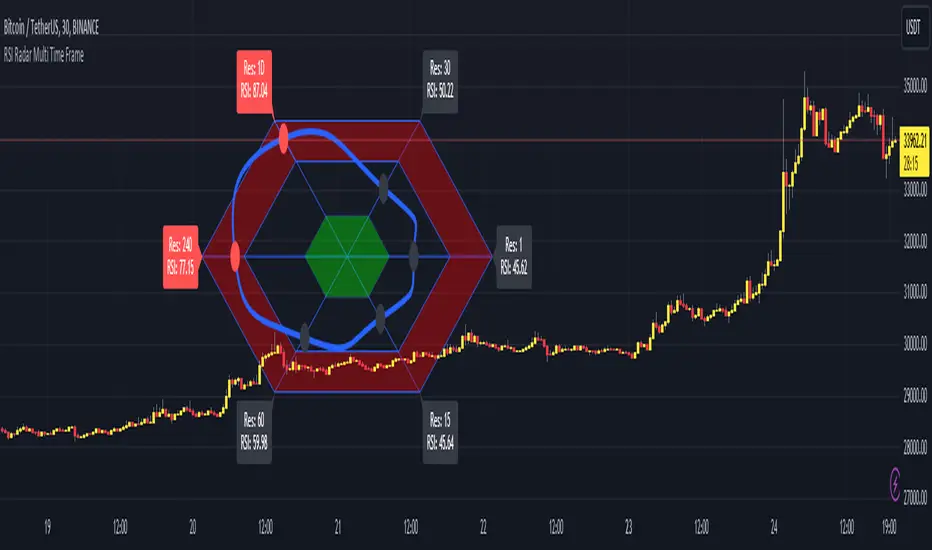
RSI Radar Multi Time FrameHello All!
First of all many Thanks to Tradingview and Pine Team for developing Pine Language all the time! Now we have a new feature and it's called Polylines and I developed RSI Radar Multi Time Frame . This script is an example and experimental work, you can use it as you wish.
The scripts gets RSI values from 6 different time frames, it doesn't matter the time frame you choose is higher/lower or chart time frame. it means that the script can get RSI values from higher or lower time frames than chart time frame.
It's designed to show RSI Radar all the time on the chart even if you zoom in/out or scroll left/right.
You can set OB/OS or RSI line colors. Also RSI polyline is shown as Curved/Hexagon optionally.
Some screenshots here:
Doesn't matter if you zoom out, it can show RSI radar in the visible area:
Another example:
You can change the colors, or see the RSI as Hexagon:
Time frames from seconds to 1Day in this example while chart time frame is any ( 30mins here )
Enjoy!
Normal Distribution CurveThis Normal Distribution Curve is designed to overlay a simple normal distribution curve on top of any TradingView indicator. This curve represents a probability distribution for a given dataset and can be used to gain insights into the likelihood of various data levels occurring within a specified range, providing traders and investors with a clear visualization of the distribution of values within a specific dataset. With the only inputs being the variable source and plot colour, I think this is by far the simplest and most intuitive iteration of any statistical analysis based indicator I've seen here!
Traders can quickly assess how data clusters around the mean in a bell curve and easily see the percentile frequency of the data; or perhaps with both and upper and lower peaks identify likely periods of upcoming volatility or mean reversion. Facilitating the identification of outliers was my main purpose when creating this tool, I believed fixed values for upper/lower bounds within most indicators are too static and do not dynamically fit the vastly different movements of all assets and timeframes - and being able to easily understand the spread of information simplifies the process of identifying key regions to take action.
The curve's tails, representing the extreme percentiles, can help identify outliers and potential areas of price reversal or trend acceleration. For example using the RSI which typically has static levels of 70 and 30, which will be breached considerably more on a less liquid or more volatile asset and therefore reduce the actionable effectiveness of the indicator, likewise for an asset with little to no directional volatility failing to ever reach this overbought/oversold areas. It makes considerably more sense to look for the top/bottom 5% or 10% levels of outlying data which are automatically calculated with this indicator, and may be a noticeable distance from the 70 and 30 values, as regions to be observing for your investing.
This normal distribution curve employs percentile linear interpolation to calculate the distribution. This interpolation technique considers the nearest data points and calculates the price values between them. This process ensures a smooth curve that accurately represents the probability distribution, even for percentiles not directly present in the original dataset; and applicable to any asset regardless of timeframe. The lookback period is set to a value of 5000 which should ensure ample data is taken into calculation and consideration without surpassing any TradingView constraints and limitations, for datasets smaller than this the indicator will adjust the length to just include all data. The labels providing the percentile and average levels can also be removed in the style tab if preferred.
Additionally, as an unplanned benefit is its applicability to the underlying price data as well as any derived indicators. Turning it into something comparable to a volume profile indicator but based on the time an assets price was within a specific range as opposed to the volume. This can therefore be used as a tool for identifying potential support and resistance zones, as well as areas that mark market inefficiencies as price rapidly accelerated through. This may then give a cleaner outlook as it eliminates the potential drawbacks of volume based profiles that maybe don't collate all exchange data or are misrepresented due to large unforeseen increases/decreases underlying capital inflows/outflows.
Thanks to @ALifeToMake, @Bjorgum, vgladkov on stackoverflow (and possibly some chatGPT!) for all the assistance in bringing this indicator to life. I really hope every user can find some use from this and help bring a unique and data driven perspective to their decision making. And make sure to please share any original implementaions of this tool too! If you've managed to apply this to the average price change once you've entered your position to better manage your trade management, or maybe overlaying on an implied volatility indicator to identify potential options arbitrage opportunities; let me know! And of course if anyone has any issues, questions, queries or requests please feel free to reach out! Thanks and enjoy.

Branch CurveLibrary "branch"
Generates a branch made of segments with a starting angle
and a turning angle for each segment. The branch is generated from a starting point
and a number of nodes to generate. The length of each segment and angle of each segment
can be adjusted. The branch can be generated in 2D or 3D, render as you wish.
method branch(origin, nodes, segment_length, segment_growth, angle_start, angle_turn)
# Branch Generation.
- `origin`: CommonTypesMath.Vector3 - The starting point of the branch. If the z value is not zero, it will be used as the starting angle.
- `nodes`: int - The number of nodes to generate.
- `segment_length`: float - The length of each segment.
- `segment_growth`: float - The growth of each segment. 0 = no growth, 100 = double the length of the previous segment.
- `angle_start`: float - The starting angle of the branch in degrees.
- `angle_turn`: float - The turning angle of each segment in degrees.
Namespace types: CommonTypesMath.Vector3
Parameters:
origin (Vector3 type from RicardoSantos/CommonTypesMath/1) : The starting point of the branch. If the z value is not zero, it will be used as the starting angle.
nodes (int) : The number of nodes to generate.
segment_length (float) : The length of each segment.
segment_growth (float) : The growth of each segment. 0 = no growth, 100 = double the length of the previous segment.
angle_start (float) : The starting angle of the branch in degrees.
angle_turn (float) : The turning angle of each segment in degrees.
@return segments The list of segments that make up the branch.

Historical Federal Fund Futures CurveUse this indicator to plot the federal funds futures implied rates term structure against historical curves
Based upon the work of @BarefootJoey, @longfiat, @OpptionsOnly

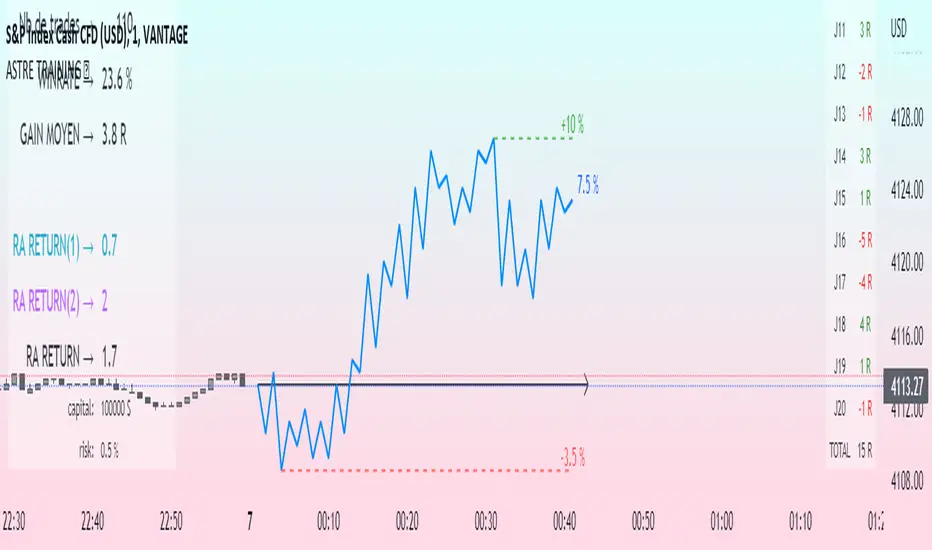
Challenge training (journal)Dynamic trading journal with equity curve display. Detailed results with prop firm objectives, editable, $/month estimation, possibility to compare two strategies.
one line in parameter = one trading day. 20 days max.
For each trading day, specify : The number of trades, the number of SL, the number of total winning RR.
A table at the bottom right summarizes the days and performances during the backtest in order to have an idea of the current performance.
The bottom left table summarizes the overall performance with some key information.
Depending on the number of days traded, a monthly "salary" is deducted, taking into account the prop firm commission.
there is the possibility to define a "Type" for each trading day, 1 or 2. It allows to compare in a binary way, example for type 1: when the high time frame structure is doing well and I am confident for scalping, otherwise type 2.
Again: type 1: SL shorter by 50%, type 2: normal SL etc..
the button "separate 1 and 2" allows to display two additional equity curves : type 1 and type 2. It allows to have a quick visual comparison on the impact of our parameter studied in our backtest on our performance. at the scale of the main equity curve
All the conditions to succeed in the challenge are adjustable in the parameters. The drawdown calculation has been simplified - in order not to have to put 80 trades in the parameters window, I have gathered them by "day", and pessimistically, we consider first the stoplosses and then the take profits, simplifying the performances of the day into "one losing trade" and "one winning trade" (graphically). It is a good compromise between quantity and quality.
Use "A random day trading" indicator to spice up your training.
I hope this will be useful for you to track your performance !
TurntLibraryLibrary "TurntLibrary"
Collection of functions created for simplification/easy referencing. Includes variations of moving averages, length value oscillators, and a few other simple functions based upon HH/LL values.
ma(source, length, type)
Apply a moving average to a float value
Parameters:
source : Value to be used
length : Number of bars to include in calculation
type : Moving average type to use ("SMA","EMA","RMA","WMA","VWAP","SWMA","LRC")
Returns: Smoothed value of initial float value
curve(src, len, lb1, lb2)
Exaggerates curves of a float value designed for use as an exit signal.
Parameters:
src : Initial value to curve
len : Number of bars to include in calculation
lb1 : (Default = 1) First lookback length
lb2 : (Default = 2) Second lookback length
Returns: Curved Average
fragma(src, len, space, str)
Average of a moving average and the previous value of the moving average
Parameters:
src : Initial float value to use
len : Number of bars to include in calculation
space : Lookback integer for second half of average
str : Moving average type to use ("SMA","EMA","RMA","WMA","VWAP","SWMA","LRC")
Returns: Fragmented Average
maxmin(x, y)
Difference of 2 float values, subtracting the lowest from the highest
Parameters:
x : Value 1
y : Value 2
Returns: The +Difference between 2 float values
oscLen(val, type)
Variable Length using a oscillator value and a corresponding slope shape ("Incline",Decline","Peak","Trough")
Parameters:
val : Oscillator Value to use
type : Slope of length curve ("Incline",Decline","Peak","Trough")
Returns: Variable Length Integer
hlAverage(val, smooth, max, min, type, include)
Average of HH,LL with variable lengths based on the slope shape ("Incline","Decline","Trough") value relative to highest and lowest
Parameters:
val : Source Value to use
smooth
max
min
type
include : Add "val" to the averaging process, instead of more weight to highest or lowest value
Returns: Variable Length Average of Highest Lowest "val"
pct(val)
Convert a positive float / price to a percentage of it's highest value on record
Parameters:
val : Value To convert to a percentage of it's highest value ever
Returns: Percentage
hlrange(x, len)
Difference between Highest High and Lowest Low of float value
Parameters:
x : Value to use in calculation
len : Number of bars to include in calculation
Returns: Difference
midpoint(x, len, smooth)
The average value of the float's Highest High and Lowest Low in a number of bars
Parameters:
x : Value to use in calculation
len
smooth : (Default=na) Optional smoothing type to use ("SMA","EMA","RMA","WMA","VWAP","SWMA","LRC")
Returns: Midpoint
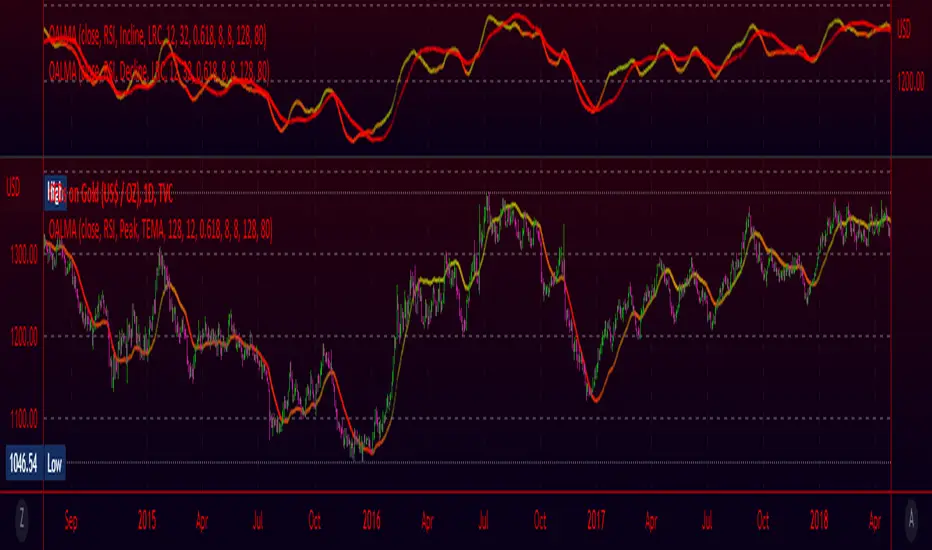
Oscillating Length Moving Averages***CREDIT TO TradingView's TA Library*** (), Attempted to use "import TradingView/ta/4" to import the library, but for whatever reason
some of the functions failed to work, while others had no issue, so I opted to just copy paste what I wanted to use.
This moving average uses an oscillator to influence the length used during calculation. Extremely customizable/tunable with ability to change Max and Min length values, length multiplier, length multiple,4 different settings ,( Decline , <>Peak, >Decline , <>Peak, >
Yield Curve (1-10yr)Yield curve of the 1-10 year US Treasury Bonds, with over 60 years of history.
The Yield Curve is the interest rate on the 10 year bond minus the 1 year bond.
When it inverts (crosses under 0) a recession usually follows 6-12 months later.
It's a great leading indicator to identify risk in the macroeconomic environment.
Yield curves can be constructed on varying durations. Using a 1-year as the short-term bond provides a slightly faster response than the 2-year bond; and the 1-year has more historical data on TradingView.

Yield Curve (2-10yr)Yield curve of the 2-10 year US Treasury Bonds, with over 50 years of history.
The Yield Curve is the interest rate on the 10 year bond minus the 2 year bond.
When it inverts (crosses under 0) a recession usually follows 6-12 months later.
It's a great leading indicator to identify risk in the macroeconomic environment.

Converging Pullbacks and PeaksMulti Timeframe Converging Lines Indicator. Using the highest/lowest Values at 2 different lengths. Convergence created by taking the highest/lowest value and subtracting/adding the # of barssince the highest/lowest bar was set multiplied by the price multiplied by the float. Curves are created from averaging out the emas of the center lines of the extremeties.
Helps show trendlines automatically most of the time but can be tweaked by changing the floats or Fast/Slow lengths to you liking.
Multi Yield CurveAn inversion between the 2 year and 10 year US treasury yield generally means a recession within 2 years. But the yield curve has more to it than that. This script helps analysis of the current and past yield curve (not limited to US treasury) and is very configurable.
"A yield curve is a line that plots yields (interest rates) of bonds having equal credit quality but differing maturity dates. The slope of the yield curve gives an idea of future interest rate changes and economic activity." (Investopedia)
When the slope is upward (longer maturity bonds have a higher interest rate than shorter maturity bonds), it generally means the economy is doing well and is expanding. When the slope is downward it generally means that there is more downside risk in the future.
The more inverted the curve is, and the more the inversion moves to the front, the more market participants are hedging against downside risk in the future.
The script draws up to 4 moments of a yield curve, which makes it easy to compare the current yield curve with past yield curves. It also draws lines in red when that part of the curve is inverted.
The script draws the lines with proper length between maturity (which most scripts do not) in order to make it more representative of the real maturity duration. The width cannot be scaled because TradingView does not allow drawing based on pixels.
This script is the only free script at time of writing with proper lengths, showing multiple yield curves, and being able to show yield curves other than the US treasury.
█ CONFIGURATION
(The following can be configured by clicking "Settings" when the script is added to a chart)
By default the script is configured to show the US treasury (government bond) yields of all maturities, but it can be configured for any yield curve.
A ticker represents yield data for a specific maturity of a bond.
To configure different tickers, go to the "TICKERS" section. Tickers in this section must be ordered from low maturity to high maturity.
• Enable: draw the ticker on the chart.
• Ticker: ticker symbol on TradingView to fetch data for.
• Months: amount of months of bond maturity the ticker represents.
To configure general settings, go to the "GENERAL" section.
• Period: used for calculating how far back to look for data for past yield curve lines. See "Times back" further in this description for more info.
• Min spacing: minimum amount of spacing between labels. Depending on the size of the screen, value labels can overlap. This setting sets how much empty space there must be between labels.
• Value format: how the value at that part of the line should be written on the label. For example, 0.000 means the value will have 3 digits precision.
To configure line settings per yield curve, each has its own "LINE" section with the line number after it.
• Enable: whether to enable drawing of this line.
• Times back: how many times period to go back in time. When period is D, and times value is 2, the line will be of data from 2 days ago.
• Color: color of the line when not inverted.
• Style: style of the line. Possible values: sol, dsh, dot
• Inversion color: color of the line when the curve inverses between the two maturities at that part of the curve.
• Thickness: thickness of the line in pixels.
• Labels: whether to draw value labels above the line. By default, this is only enabled for the first line.
• Label text color: text color of value label.
• Label background color: background color of value label.
To configure the durations axis at the bottom of the chart, go to the "DURATIONS" section.
• Durations: whether to show maturity term duration labels below the chart.
• Offset: amount to offset durations label to be below chart.
█ MISC
Script originally inspired by the US Treasury Yield Curve script by @longfiat but has been completely rewritten and changed.

Cubic Bézier Curve Extrapolation [LuxAlgo]The following script allows for the extrapolation of a Cubic Bézier Curve fit using custom set control points and can be used as a drawing tool allowing users to estimate underlying price trends or to forecast future price trends.
Settings
Extrapolation Length: Number of extrapolated observations.
Source: Source input of the script.
Style
Width: Bézier curve line width.
Colors: The curve is colored based on the direction it's taking, the first color is used when the curve is rising, and the second when it is declining.
The other settings determine the locations of the control points. The user does not need to change them from the settings, instead only requiring adjusting their location on the chart like with a regular drawing tool. Setting these control points is required when adding the indicator to your chart.
Usage
Bézier curves are widely used in a lot of scientific and artistic fields. Using them for technical analysis can be interesting due to their extrapolation capabilities as well as their ease of calculation.
A cubic Bézier curve is based on four control points. Maxima/Minimas can be used as control points or the user can set them such that part of the extrapolated observation better fits the most recent price observations.
A possible disadvantage of Bézier curves is that obtaining a good fit with the data is not their primary goal. Rational Bézier curves can be used if obtaining a good fit is the primary user goal.
Details
At their core, Bézier curves are obtained from nested linear interpolation between each control point and the resulting linearly interpolated results. The Bézier curve point located at the first control point P0 and the last curve point located at the last control point Pn are equal to their respective control points. However, this script does not make use of this approach, instead using a more explicit form.
As mentioned previously, the complexity of a Bézier curve can be determined by its number of control points which is related to the Bézier curve degree (number of control points - 1). Instead of using nested linear interpolations to describe Bézier curves, one can describe them as a polynomial of a degree equal to the degree of the wanted Bézier curve.

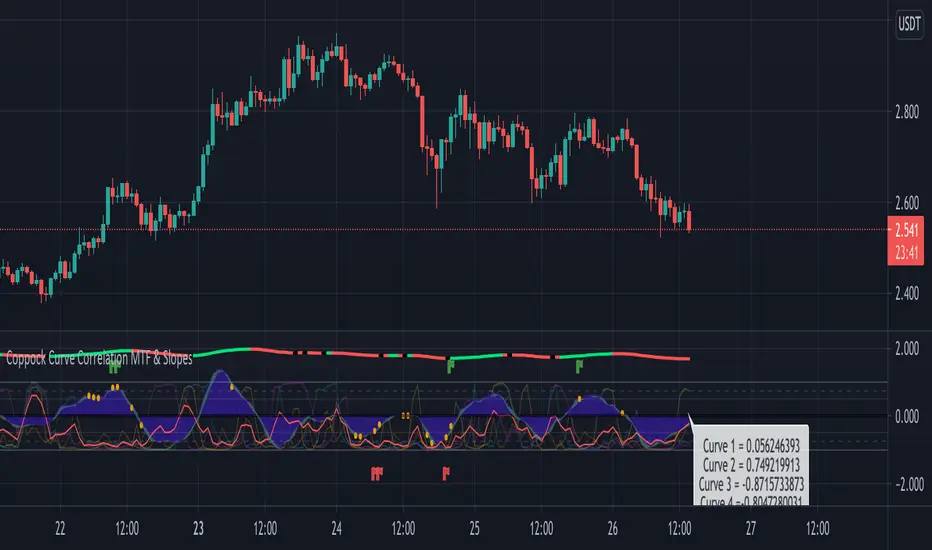
Coppock Curve Correlation between MTF & SlopesMy first tool !
1. The waves shows the slope of the curve. The front one = 3 periods, back one = 2 periods, difference = white area.
2. The moving lines shows the curve correlation between 2x 2 time frames (adjustable on the settings) on 2 periods lookback.
2.1 Theres few regions of high correlation, lines are at (absolute values) 0.5, 0.75, 1
3. On the top there's the Coppock curve -> if falling since 1 period = red, else green.
4. Diamonds shows : if correlation is in the strong correlation area and slope is falling or rising : red or green diamond.
This tool could be interesting to have an idea if there's strong correlation between timeframes instead of watching 4-5 different timeframes !
Dankland Playground Moneymaker - V2“version 2” of my playground bot script. Its essentially a powerhouse suite of strategies. Although it is similar to the previous script, it nets different results as sections have been changed. Such as the somewhat reluctant removal of the Chande Momentum... The RSIs have also been updated, this was one of the main changes. RSIS now include a Moving Average cross of RSI to generate signals above and below the given thresholds instead of simply on crossing a threshold. This should give greater functionality overall. Most functions including Moving Averages have been updated to include a wider range of kinds of moving averages. This includes not just the moving average cross, but MACD and RSIs as well. I tried to perform the same upgrade on the %B, Stochastics and SMI, but hit the unpacked code limit of 60,000 lines... So, more “versions” will have to come for future “upgrades”, with the recognition that there will be cases where the old, “downgraded” versions may perform better and that some people (like myself) may continue to use them on some markets until I/we devise superior settings on the new ones for said markets. For instance, instead of replacing my 1 hr BTCUSD bot (where I used the now deleted Chande to pretty pleasing affect...) I made a new one for LINKUSD 10 min so I can have both running for now and work on replacing the BTCUSD later.
How it works basically is this... you have 16 oscillators which can all be used as independently as you wish. They can be split up into different groups or ran all together.
When in separate groups they should not be able to sell eachothers positions without triggering a full stop loss by turning the Independence/Stop All switches on. Every single oscillator has its own entry and exit position sizing which can be stated as either a percent of balance or a flat amount of contracts (or both combined). Each oscillator has a minimum amount of profit you can tell it to sell it, which is calculated from the average cost of your current position, which does include all groups. This works out to help you average out better entry and exit prices, essentially a method of DCAing.
You can set the minimum sale amount, which is to keep it from placing orders below your exchanges minimum dollar trade cost.
All this functionality combined also ensures more accurate back tests by ensuring that the script simply cannot spend money it doesn't see as in the balance, whereas other scripts will use a percentage of equity, and once 100% of your equity is in BTC for instance, it will keep buying more BTC for free and thus spoof up backtest numbers. If you look through the strategies here, many people claim to have amazing scripts and then you look into it and this is happening and skewing their numbers. These people are either very ignorant or what they made or scam artists and trolls in my opinion.
This version also includes On Bar Close switches for each oscillator. When switched on, signals are only allowed to generate on Bar Close. This helps to prevent retriggering from live signals, which when you are running this many oscillators, will become a problem! However, in most cases, you do not need to generate signals intrabar, as backtests will show, ignoring intrabar buys and sells (intrabar stop losses can still be very important though!) won't exactly keep you from high profitability strategies, but rather, allowing elements of chaos from live indicators moving up and down intrabar will, in fact, drift your actual results further and further from the backtest. You want an accurate backtest though. So choose wisely when you turn these off and you will do better.
The included oscillators are as follows:
NO MORE Chande Momentum cross – REMOVED – I was hitting PINE code limits here so I had to make choices and this one simply had to go. Begone!
Moving Average Cross
MACD cross
%B Bollinger cross
Stochastic cross + region filter
Stochastic RSI cross + region filter
SMII cross and region filter
Three RMIs
Know-Sure-Thing line-cross
Coppock Curve line-cross
TRIX line-cross
RSI of MA w/ MA cross
RSI of MA of KST w/ MA cross
RSI of MA of Coppock Curve w/ MA cross
RSI of MA of Trix w/ MA cross
So the idea is that this is essentially multiple strategies combined into one backtestable house. Balance is calculated for all position sizes in order to try to prevent false entries that plague so many scripts (IE, you set pyramiding to 2, each buy $1000, initial balance $1000, and yet it buys two orders off the bat for $2000 total and nets 400% profit because the second was considered free, happens on 90+% of scripts on Tradingview if you aren't very very careful!)
You tune each indicator and position size them so that they work together as well as you can and in doing so you are able to create a single backtest that is capable of running a bot, essentially, between multiple strategies - you can run a slower Moving Average cross, a faster SMI cross or MACD , or Bollinger that grabs big moves only, all the while having MACD trade small bonuses along the way. This way you can weight the Risk to Reward of each against eachother.
I will not try to claim this is something you can open and with no work have the best bot on the planet. This scripts intention is to take a lot of relatively common trading strategies and combine them under on roof with some risk management and the ability to weigh each against eachother.
If you are looking for a super advanced singular algorithm that tries to capture every peak and valley exactly on the dot, this is not for you. If you are looking for a tool with a high level of customizability, with a publisher who intends to update it to the best of his ability in accordance to seeking to make the best product that I personally can make for both myself and the community (because I will be using this myself of course!) that was specifically designed with the intention of performing well in spot markets by averaging low entry costs and high exit costs, this is for you! That is the exact intention here. It can certainly work with margin, but you will have to take extra care in setting your stop losses. I intend to make a version capable of going short which will be included as part of the package. It may take some work to keep all of the risk management working as well for shorts though. There will be more scripts added to the “package” as I hit the limit on this one a few times and have had to keep some ideas out already.
The current backtest shown is hand-optimized by myself for Link /USD 10min market (Binance US – shouldn't need much work to fit to other exchange markets) with multiple stop losses.

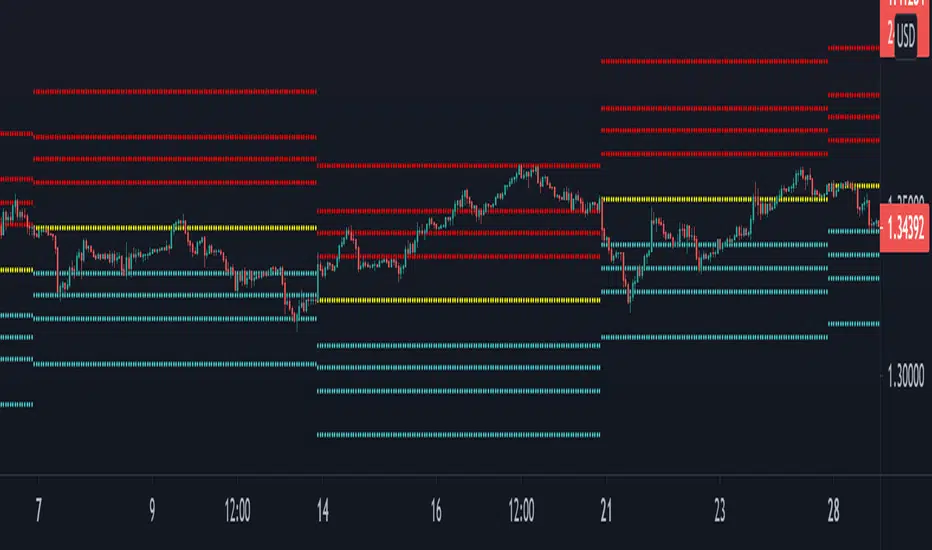
Bell Curve LevelsScript which plots the % change from the open and overlays the 1, 1.5, 2 & 3% levels on the chart.
The bell curve offers a quantifiable clue to the persistent percentages the price moves in the fx market. A simple histogram will convey the %change in bins
this indicator just reflects that with levels on the chart.
Can be an aide for intraday or longer term levels.
Feel free to message me with any queries.
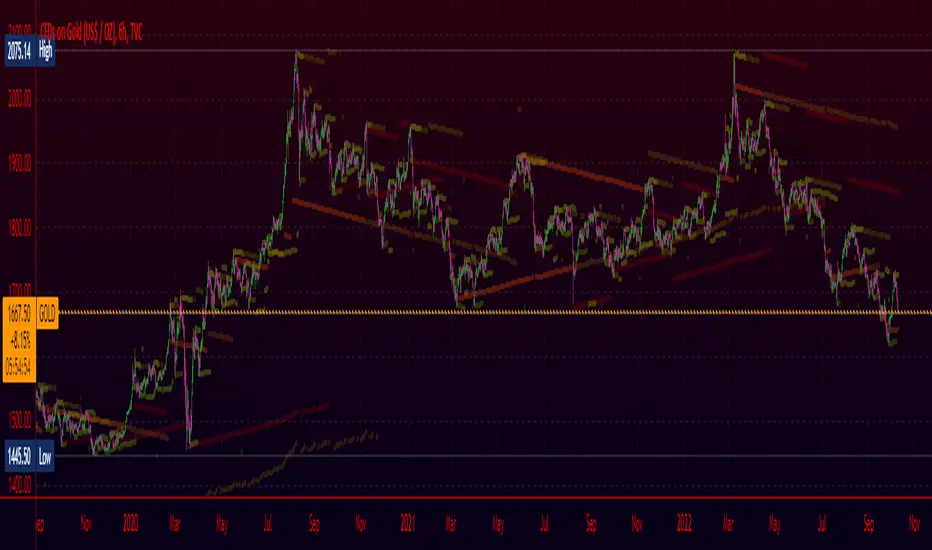
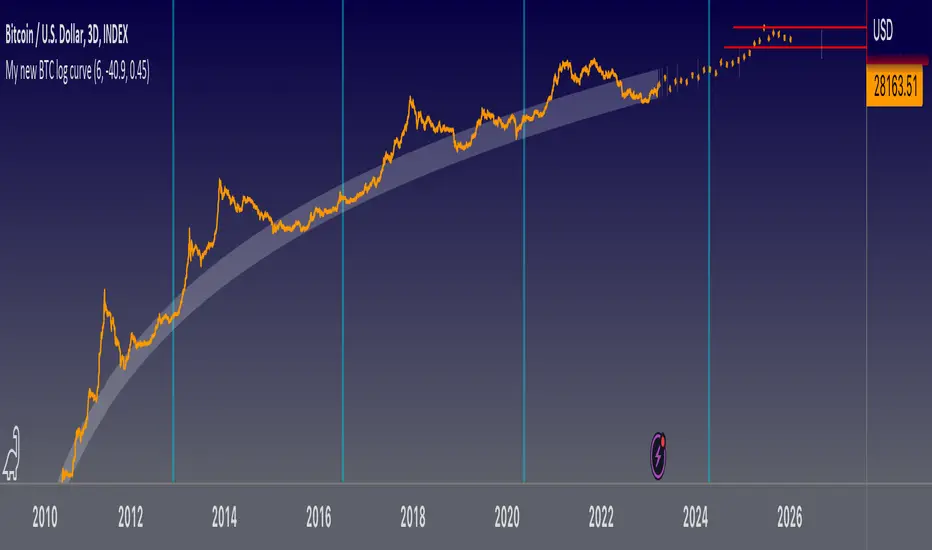
My new BTC log curveThis is my new logarithmic regression curve to the USD/BTC price chart. It is based on a new, very simple equation: y = (e^b)*(x^a), where x is number of days since the Genesis block, a and b are parameters set by the user. Also included is an upper regression curve that is fit to the peaks of each Bitcoin cycle; no fundamental analysis went into making these lines, they are merely fits to the data, so it should not be expected that they can be used to predict tops and bottoms. The upper regression curve is the product of the support curve (lower curve) and two other factors: a constant, and an exponential decay. The constant and the decay factors are parameters that can be set by the user.
Coppock Curve StrategyThis strategy makes use of a not widely known technical indicator called "Coppock Curve".
The indicator is derived by taking a weighted moving average of the rate-of-change (ROC) of a market index such as the S&P 500 or a trading equivalent such as the S&P 500 SPDR ETF. For more info: (www.investopedia.com)
This strategy uses $SPY Coppock curve as a proxy to generate buy signals on other ETF's and stocks.
Buy signals are generated when the Coppock Curve crosses above zero, and sell signals are generated when it crosses below.
An optional, trailing stop loss is available, with default settings to 100% so that it does not currently affect the buy and sell signals solely generated by the Coppock Curve. But you may find adding a Trailing stop loss may improve results on certain ETF's/Stocks.
You may also change the symbol for which signals are generated for, default is $SPY.
The published example shows using this strategy on a leverage ETF $TQQQ w/ starting capital of 10k, w/ 10k per trade. Try it on other stocks such as $AAPL, $AMZN $NFLX ect... I have found it to be an effective strategy that has a favorable risk to reward profile.
Any questions, please let me know!

SBER Coppock Curve with 14EMA (Prefer with 1 HR)Modified coppock curve along with 14EMA can be used by non-aggressive traders as per detailed rules explained in video on "Trading made easy with secret coppock curve"

Yield Inversion HighlightAs traders we must keep track of lots of information to make educated decisions. One factor traders use a lot to gauge sentiment is Yield Inversion. This script paints a red background when it is inverted and a green background when it is not. This is not a comprehensive analysis just a quick way to spot changes in the bonds market.
This can be applied to any symbol.
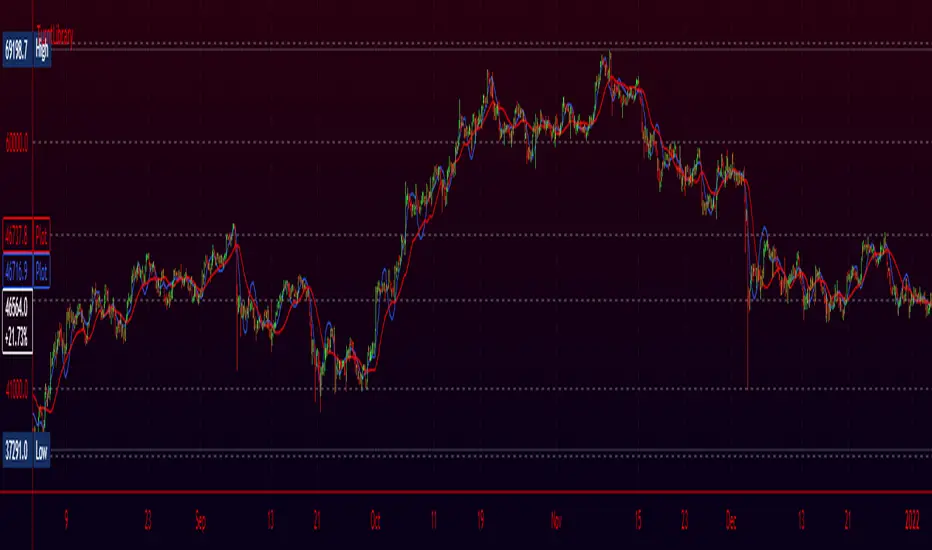
Bitcoin Logarithmic Growth CurvesThis plots logarithmic curves fitted to major Bitcoin bear market tops & bottoms. Top line is fitted to bull tops, bottom line is fitted to lower areas of the logarithmic price trend (which is not always the same as bear market bottoms). Middle line is the median of the top & bottom, and the faded solid lines are fibonacci levels in between.
Inspired by & based on a Medium post by Harold Christopher Burger, which shows how linear Bitcoin's long-term price growth is when plotted on a double-log chart (log scaling on the price AND time axis).
These curves will only make sense for tickers representing Bitcoin vs. USD (such as BITSTAMP:BTCUSD, BITMEX:XBTUSD, BLX index). Plotting on other assets will probably end up with lines that shoot off into space without any relationship to the underlying price action.
The upper, middle & lower curves can be projected into the future, which can be turned on or off in the indicator settings. The fibonacci levels can also be switched on/off. And the upper & lower curve intercepts & slopes can be tweaked.
I'm releasing this open-source, if you end up making something cool based off of this code, I don't need attribution but please hit me up on here or on twitter (same username) so I can check out what ya made. Thanks, hope y'all enjoy it.

Price-Curve ChannelIntroduction
Although many will use lines in order to make support and resistances, others might use curves, this is logical since trends are not always linear. Therefore it was also important to take this into consideration, and when i published the price-line channel indicator, i already started a curved version of it. Therefore i propose this new indicator based on the recursive bands framework that allow to return curved support and resistances. The benefits of this indicator are : a totally stable approach, user friendly, and extremities able to converge faster toward the price.
The Indicator
The indicator is way faster than the price-line channel one, this is due to the fast convergence toward the price of the extremities. Length control the reactivity of the indicator, while mult is more related to the rate of convergence, values of mult lower than 1 will make the curve converge slower,
mult = .5
Higher values of mult will make the extremities converge faster toward the price.
mult = 2
Unlike the price-line channel indicator this one is directly "readjusted", this is due to the fact that the extremities are no longer linear, of course a "perfectly" curved version could come in an update, but for the moment it wasn't really a necessity.
Comparison With Price-Line
The fact that the extremities converge faster toward the price allow to possibly capture more tops/bottoms/retracements. However the extremities of both indicator have the same behavior regarding their accuracy, for example the upper extremity have a higher chance to detect a retracement when on a downtrend, while the lower extremity have higher chance to detect a retracement while on a up-trend.
On The Indicator Construction
The recursive bands framework is the core of the indicator, it is important to use it. The curved effect is given by multiplying the correction factor by the barssince function, therefore the correction factor is no longer constant which in return allow for a non linear output.
The size is divided by the square of length in order to keep a certain logic between the output and the length period.
Conclusion
The recursive bands framework prove again to be quite interesting, lot of indicators can be made using it, i only posted a fraction of what can be done with it, which make the recursive bands indicator one of the best indicators i ever made in my opinion.
The proposed indicator is stable, and don't require nightmarish manipulations (unlike the linear channels indicator), its ability to detect possible support and resistances points, although subjective, remain a feature of the indicator. The use of recursion make the indicator efficient. I hope the indicator find some use in the community.
Thanks for reading !
Linear version.
Note
Respect the house rules, always request permission before publishing open source code. This is an original work, requesting permission is the least you can do.
I apologize for any grammatical/orthographic error in this post.
