AI-Bank-Nifty Tech AnalysisThis code is a TradingView indicator that analyzes the Bank Nifty index of the Indian stock market. It uses various inputs to customize the indicator's appearance and analysis, such as enabling analysis based on the chart's timeframe, detecting bullish and bearish engulfing candles, and setting the table position and style.
The code imports an external script called BankNifty_CSM, which likely contains functions that calculate technical indicators such as the RSI, MACD, VWAP, and more. The code then defines several table cell colors and other styling parameters.
Next, the code defines a table to display the technical analysis of eight bank stocks in the Bank Nifty index. It then defines a function called get_BankComponent_Details that takes a stock symbol as input, requests the stock's OHLCV data, and calculates several technical indicators using the imported CSM_BankNifty functions.
The code also defines two functions called get_EngulfingBullish_Detection and get_EngulfingBearish_Detection to detect bullish and bearish engulfing candles.
Finally, the code calculates the technical analysis for each bank stock using the get_BankComponent_Details function and displays the results in the table. If the engulfing input is enabled, the code also checks for bullish and bearish engulfing candles and displays buy/sell signals accordingly.
The FRAMA stands for "Fractal Adaptive Moving Average," which is a type of moving average that adjusts its smoothing factor based on the fractal dimension of the price data. The fractal dimension reflects self-similarity at different scales. The FRAMA uses this property to adapt to the scale of price movements, capturing short-term and long-term trends while minimizing lag. The FRAMA was developed by John F. Ehlers and is commonly used by traders and analysts in technical analysis to identify trends and generate buy and sell signals. I tried to create this indicator in Pine.
In this context, "RS" stands for "Relative Strength," which is a technical indicator that compares the performance of a particular stock or market sector against a benchmark index.
The "Alligator" is a technical analysis tool that consists of three smoothed moving averages. Introduced by Bill Williams in his book "Trading Chaos," the three lines are called the Jaw, Teeth, and Lips of the Alligator. The Alligator indicator helps traders identify the trend direction and its strength, as well as potential entry and exit points. When the three lines are intertwined or close to each other, it indicates a range-bound market, while a divergence between them indicates a trending market. The position of the price in relation to the Alligator lines can also provide signals, such as a buy signal when the price crosses above the Alligator lines and a sell signal when the price crosses below them.
In addition to these, we have several other commonly used technical indicators, such as MACD, RSI, MFI (Money Flow Index), VWAP, EMA, and Supertrend. I used all the built-in functions for these indicators from TradingView. Thanks to the developer of this TradingView Indicator.
I also created a BankNifty Components Table and checked it on the dashboard.
BANKNIFTY

BankNifty_CSMLibrary "BankNifty_CSM"
TODO: add library description here
getLtp_N_Chang(openPrice, closePrice, highPrice, hl2Price, lowPrice, hlc3Price, bankNiftyClose)
Parameters:
openPrice (float)
closePrice (float)
highPrice (float)
hl2Price (float)
lowPrice (float)
hlc3Price (float)
bankNiftyClose (float)

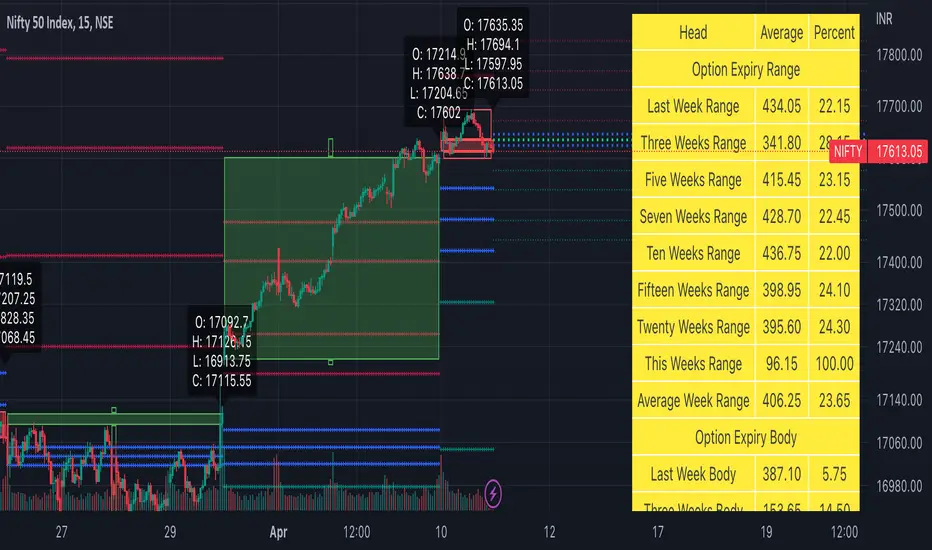
Weekly Options Expiry Candle V.2In India Weekly options expire on Thursday and that creates a different price action candle than the week timeframe.
My previous script Weekly Options Expiry Candle has some limitations. This script overcame those limitations and added some features.
You can use this in any intraday time frame candle.
It will show:
All expiry candle in box format
Expiry OHLC label
Pivot (Floor or Fibonacci) based on expiry OHLC data
Developing Expiry candle and Pivot
A table showing expiry range(high-low) and Expiry body abs(open-close) stats.
You can turn on or off any feature.
Please let me know if you found this script useful or have any questions or suggestions.
NSE:BANKNIFTY
NSE:NIFTY
Commercial FV PriceTrend V1Hello Traders ,
This is a trend trading Indicator where support and resistance and demand zone has been mentioned , It plots according to the trend change . Important point of the indicator is at time when we enter , just on the bases of buy and sell we enter and most of the time market takes out our SL or market reverses or trend changes , There comes the zones part and its functionality is mentioned in the images below and entry is only confirmed only when the candle penetrates inside the any of the zone be that be Resistance zone or Demand Zone and then breaks the low of the Zone (if trend is bearish) then only one can take short position and high of the zone should be the Stoploss ... Similarly if the trend is bullish and price is between Resistance and Demand Zone , if the price breaks the resistance and continue no long position can be taken , atleast for once it should penetrates back inside the Resistance Zone and then breaks the high of the zone that time long entry will become valid and low of the zone will be the Stoploss and 1:3 Risk Reward . By the way this can work with any type of market. However I concluded Intraday levels too which can be turned off according to user comfortability along with mean channel .
Aqua defines BULLISH TREND
RED defines BEARISH TREND
Rules for exit
lONG Exit= Candle closes below Zone Low
Short Exit =Candle closes above Zone high
-----------------
Disclaimer
Copyright by FaizanNawazz.
The information contained in my scripts/indicators/strategies/ideas does not constitute financial advice or a solicitation to buy or sell any securities of any type. I will not accept liability for any loss or damage, including without limitation any loss of profit, which may arise directly or indirectly from the use of or reliance on such information.
All investments involve risk, and the past performance of a security, industry, sector, market, financial product, trading strategy, or individual’s trading does not guarantee future results or returns. Investors are fully responsible for any investment decisions they make. Such decisions should be based solely on an evaluation of their financial circumstances, investment objectives, risk tolerance, and liquidity needs.
My scripts/indicators are only for educational purposes!
Happy Trading!

Strategy: Range BreakoutWhat?
In the price action, levels have a significant role to play. Based on the price moving above/below the levels - the underlying instrument shows some price-action in the direction of breakout/breakdown.
There are plenty of ways level can be determined. Levels are the decision point to take a trade or not. But if we make the level derivation complex, then the execution may get hamper.
This strategy script, developed in PineScript v5, is our attempt at solving this problem at the core by providing this simple, yet elegant solution to this problem.
It's essentially an attempt to Trade Simple by drawing logical (horizontal) lines in the chart and take actions, after multiple associated parameters confirmation, on the breakout / breakdown of the levels.
How?
Let us explain how we are drawing the levels.
We are depending on some of the parameters as described below:
Open Range : During intraday movement, often if prices move beyond a particular level, it exibits more movement in the same swing in same direction. We found out, through our back testing for Indian Indices like NSE:NIFTY , NSE:BANKNIFTY or NSE:CNXFINANCE the first 15m (i.e 09:15 AM to 09:30 AM, IST) is one of such range. For Indian stocks, it is 9:15 to 9:45. And for MCX MCX:CRUDEOIL1! it's 5:00 pm to 6:00 pm. There are our first levels.
PDHCL : Previous Day High, Close, Low. This is our next level
VWAP : The rolling VWAP (volume weighted average price)
In the breakout/breakdown of the Open Range and Previous Day High/Low, we are taking the trade decisions as follows using CEST principle:
C onditions :
If current bar's (say you are in 5m timeframe) closing is broken out the Open Range High or Previous Day High, taken a Buy/Long decision (let's say buying a Call Option CE or selling a Put Option PE or buying the future or cash).
If current bar's (say you are in 5m timeframe) closing is broken down the Open Range Low or Previous Day Low, taken a Sell/Short decision (let's say buying a Put Option CE or selling a Call Option PE or selling the future or cash).
Additionally, and optionally (default ON, one can turn off): we are checking various other associated multiple confirmations as follows:
1. Momentum : Checking 14-period RSI value is more than 50 or less than 50 (all parameters like period, OB, OS ranges are configurable through settings)
2. Current bar's volume is more than the last 20 bars volume average. How much more - that multiplier is also configurable. (default is 1)
3. The breakout candle is bullish (green) or bearish (red).
E ntry :
All of these happens only on the closing of the candle . Means: Non Repainting! .
Clearly in the chart we are showing as green up arrow BO (breakout for buy) and red down arrow BD (breakdown for sell) to take your decision process smooth.
So, on the closing of the decision BO/BD candle we are entering the trade (with a thumping heart and nail biting ...)
S top Loss :
We are relying on the time tasted (last 40 years) mechanism of Average True Range (ATR) of default 14 period. This default period is also configurable.
So for Long trades: the 14 period ATR low band is the SL.
For Short trades: the 14 period ATR high band is the SL.
T arget :
We are depending on the thump rule of 1:2 Risk Reward. It's simple and effective. No fancy thing. We are closing the trade on double the favorable price movement compared to the SL placed. Of course, this RR ratio is confiurable from the settings, as usual.
What's Unqiue in it?
The utter simplicity of this trading mechanism. No fancy things like complex chart pattern, OI data, multiple candlestick patterns, Order flow analysis etc.
Simple level determination,
Marking clearly in the chart.
Making each parameter configurable in Settings and showing tooltip adjacent to the parameter to make you understand it better for your customization,
Wait for the candle close, thus eliminating the chances of repainting menace (as much as possible)
Additional momentum and volume check to trade entry confirmation.
Works with normal candlestick (nothing special ones like HA ...)
Showing everything as a Summary Table (which, again can be turned off optionally) overlaying at the bottom-right corner of the chart,
Optionally the Summary Table can be configured to alert you back (say you get it notified in your email or SMS).
That way, a single, simple, effective trade setup will ease your journey as smooth sail as possible.
Mentions
There are plenty of friends from whom time to time we borrowed some of the ideas while working closely together over last one year.
From tradingview community, we took the spirit of @zzzcrypto123 awesome work done long back (in 2020) as the indicator "ORB - Opening Range Breakout". (We tried to reach him for his explicit consent, unable to catch hold of him).
Some other publicly available materials we have consulted to get the additional checks (like RSI, volume).
Lat word
Use it please and thank you for your constant patronage in following us in this awesome platform. Let's keep growing together.
Disclaimer :
This piece of software does not come up with any warrantee or any rights of not changing it over the future course of time.
We are not responsible for any trading/investment decision you are taking out of the outcome of this indicator.

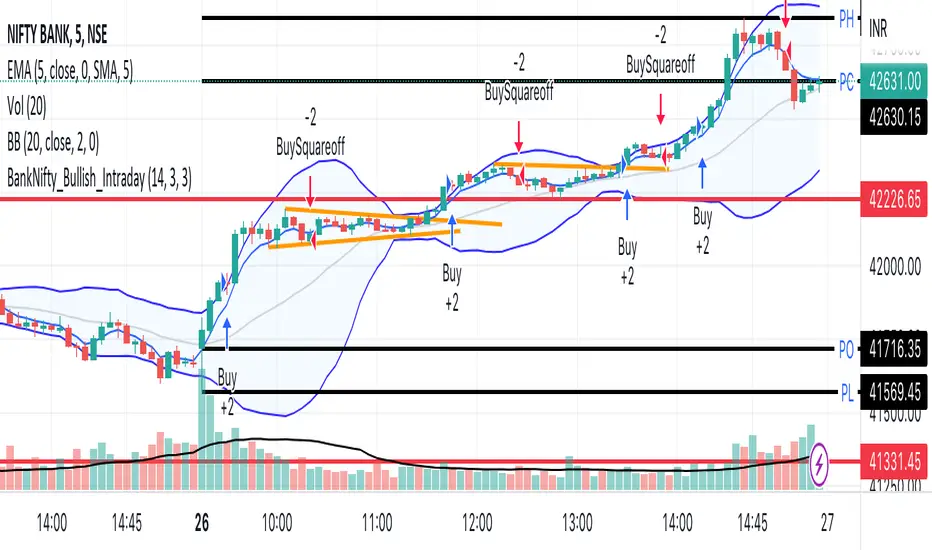
BankNifty_Bullish_Intraday
The script uses following mechanism to give a signal of BUY if multiple parameters evaluated are all passed.
ENTRY-
1. 5 min MACD should be more than its previous tick
2. 15 min MACD should be more than its previous tick
3. 60 min MACD should be more than its previous tick
4. ADX should be more than 12
5. RSI should be more than 60
6. Stochastic %k should have cross over with %d
7. Bollinger band upper band value should be more than previous tick
EXIT
If the 5 min bar price closes below 5 min EMA , it gives an exit signal.
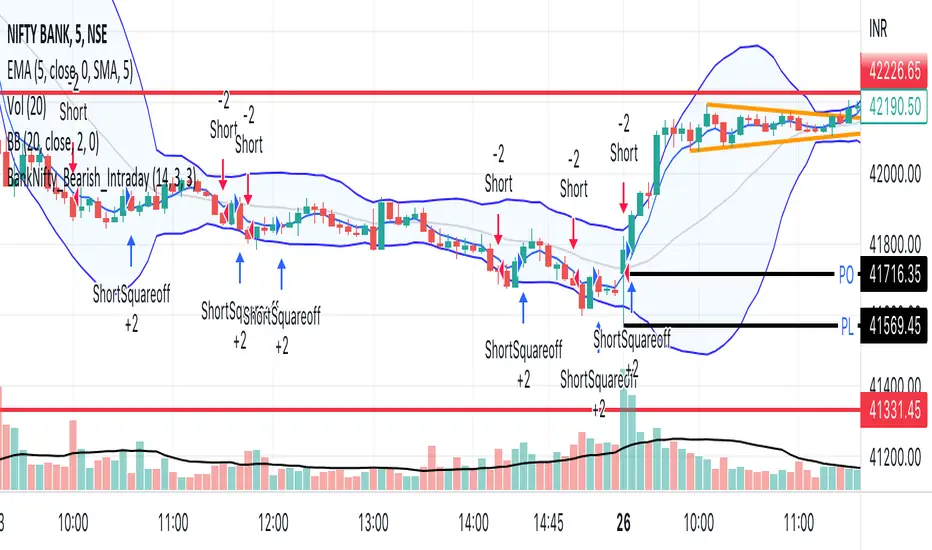
BankNifty_Bearish_Intraday
The script uses following mechanism to give a signal of SELL if multiple parameters evaluated are all passed.
ENTRY-
1. 5 min MACD should be less than its previous tick
2. 15 min MACD should be less than its previous tick
3. 60 min MACD should be less than its previous tick
4. ADX should be more than 12
5. RSI should be less than 40
6. Stochastic %k should have negative cross over with %d
7. Bollinger band lower band value should be less than previous tick
EXIT
If the 5 min bar price closes above 5 min EMA , it gives an exit signal.
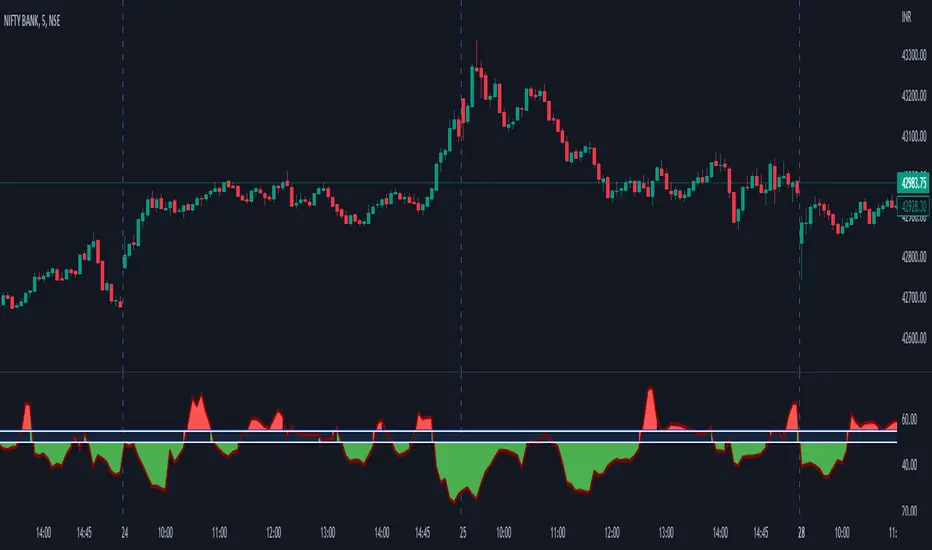
StockCloud_Chopiness This indicator describes the state of the market. If the region is under green shades, you could take trade based on your other criterias and if its red , the market is chopping and it is not advisable to take the trade. This works for BANKNIFTY spot chart and ideally on a 5 min Time frame. Do not use this alone but use it best with Price Action. Also ignonre this indicator values on sudden spike candles, wait for the PA and indicator behaviour to take the trade.
Green signifies the possibility of being in a trend state and doesnt mean a long condition and red in a consolidation / trap state and doesnt mean a short condition.
NSE Sector PerformanceUse this indicator on daily timeframe
This indicator shows the performance of the top NSE Sectors for 4 time periods.
User has the flexibility to define the time periods (ex. Yearly Monthly Quarterly Weekly Daily
indicator shows the performance of the sector for those time periods along with 250d High/Low and distance from the High/Low
User input is provided to drill down into performance of the top stocks in those sectors.

ILM NSE Banknifty DashboardUse this indicator on Daily Timeframe
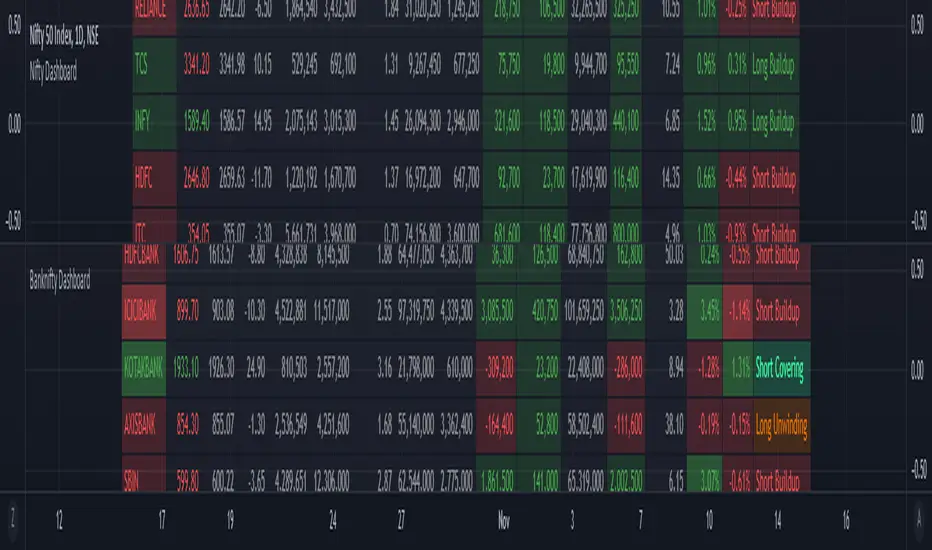
This indicator shows the important metrics of BANKNIFTY and its top 7 constituent stocks.
This indicator is similar to Open Interest indicator but consolidates the data for NIFTY stocks
For more information, look at the Open Interest Indicator
ILM NSE Nifty DashboardUse this indicator on Daily Timeframe
This indicator shows important metrics of NIFTY and its top 7 constituent stocks (Banks are excluded as there is a separate dashboard for BANKNIFTY).
This indicator is similar to Open Interest indicator but consolidates the data for NIFTY stocks
For more information, look at the Open Interest Indicator

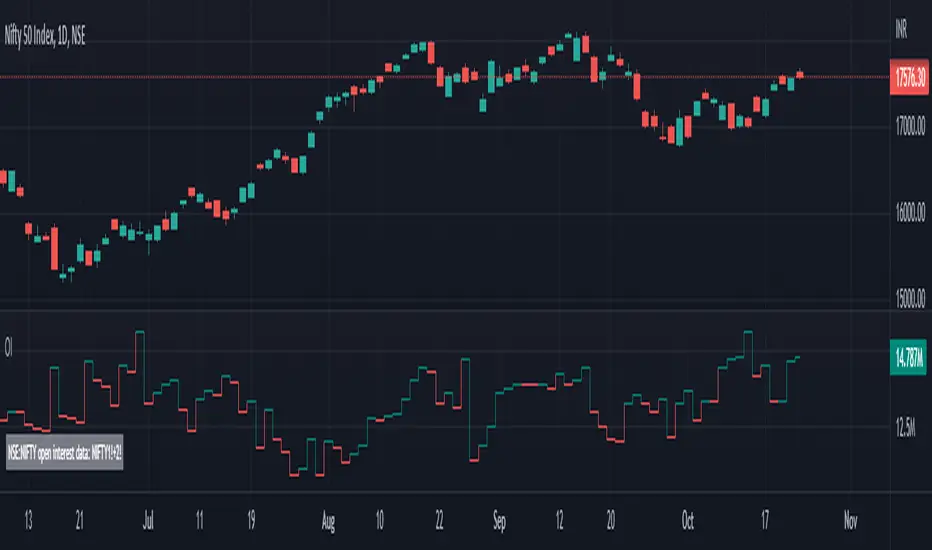
ILM NSE Futures - Open Interest Analysis - FnOUse this indicator on Daily Timeframe
This script works only on India NSE Futures (Indices and Fno Stocks)
This script pulls Stock/Index Price/Volume Info + Futures Current/Next Price/Volume/Open Interest Info
Calculates the Combined OI and identifies the OI Buildup based on the Price Change and color codes the info for easy reading
This script also calculates Stock/Futures Volume action to identify if big players are aggressively trading in Futures
Also OI Buildup to Future Volume is calculated to track the presence of big players.
Summary Row is displayed at the bottom which shows Futures Premium/Discount to Index/Stock

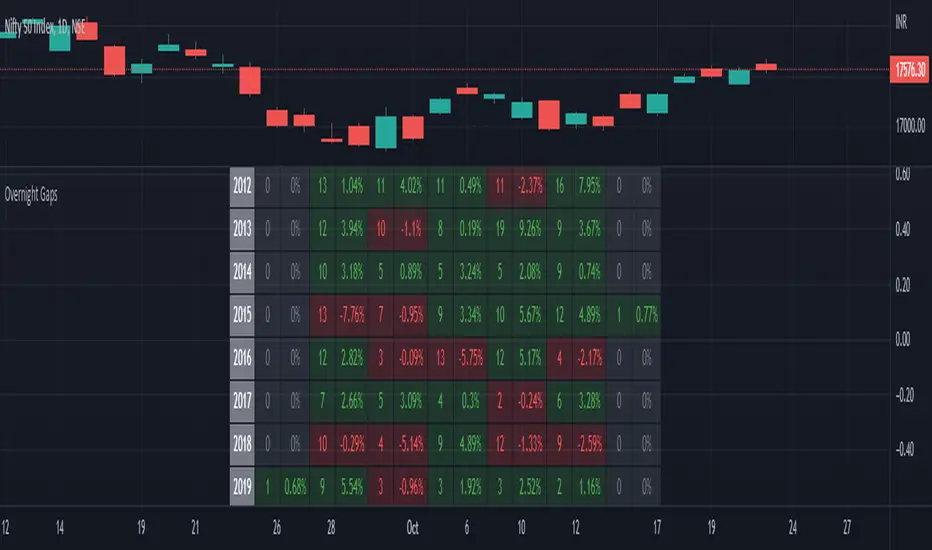
Seasonality Overnight Gaps - Tabular Form Use this indicator on Daily Timeframe
This script calculates the overnight gaps above a specific threshold (that can be set through input parameters) and displays the data in a tabular form with Year in the rows and the day of the week in the columns.
Also a summary row is displayed at the bottom for day of the week.
Detailed Gap info is displayed as tooltip for the cell data
Gap - Open should be outside the previous day's Open and Close
Gap % - open/prev. close - 1 if Gap is there
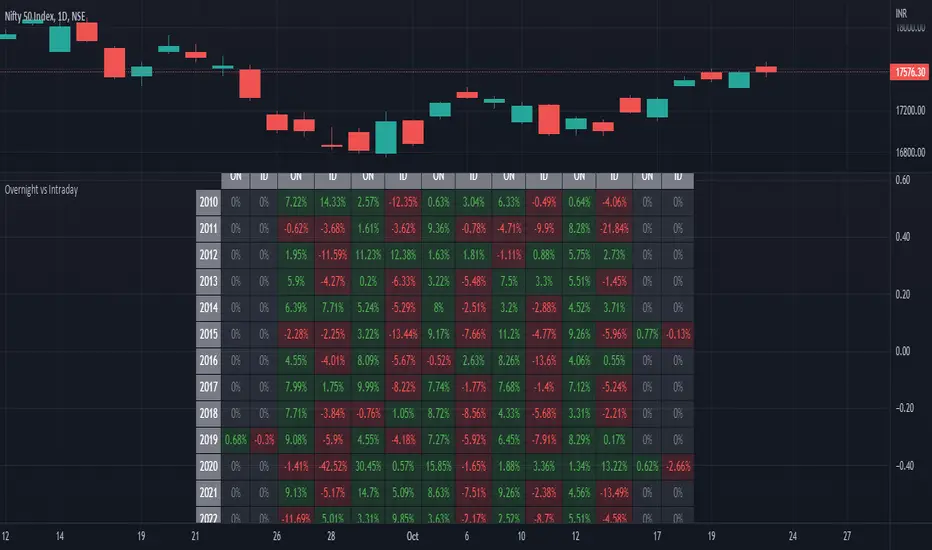
ILM Overnight vs Intraday Performance - Tabular FormUse this indicator on Daily Timeframe
This script compares Overnight vs Intraday Performance based on the Day of the Week (DOW) - Sun - Sat of index/stock/currency/commodity symbols.
ON column indicates Overnight performance = open/close -1
ID column indicates Intraday performance = close-open/1
The calculations are detailed in the tooltips of the individual table cells.
Seasonality DOW - Day Of the Week - Tabular FormUse this indicator on Daily Timeframe
This indicator displays the seasonality data for any instrument (index/stock/ futures /currency) in a tabular data by day of the week - DOW ( Sun - Mon - Tue - Wed - Thu - Fri - Sat ).
User can change the start of the year for analysis from the inputs.
Year is represented in rows and Day of the week (DOW) is represented in cols.
This indicator uses Daily Data feed to calculate the % change
Summary data for DOW displayed as the last row

NSE Open Interest Current + Future Month - OI - COIUse this indicator on Daily Timeframe
This script enhances the standard Open Interest indicator in the following ways
Pulls Current Month and Next Month OI and sums up the data - COI
Works even if input symbol is stock/index and appends Current and Future suffix to pull the data
BankNifty_Component_Stats_StockCloudThis is a summary table for the component top 6 Banks of Banknifty based on the current NSE defined weightage. Explanation of each Column as below:
Price : The current 5 Min close price of the Component mentioned in the rows
Change : The change in terms of number of point wrt to the previous day closing price
Change %: The change in terms of % wrt to previous day closing price
Per Point Chg : How many points Banknifty has moved with 1 point change of the respective component. If HDFC per point chg is shown as 7, it means 1 point move in HDFC has contributed to 7 points move in BankNifty.
Participation : Refers to the total points contributed by the major component. If ICICI participation is shown as 300, it means of the total Banknifty move , a positive 300 points has been contributed by ICICI. if HDFC shows -150. it means HDFC has dragged down Banknifty by 150 points.
TDP : There is a user definable Length "length" in the Input section under settings. If you have given 1 there, this number signifies the number of points contributed by the component bank in the last 5 min. If SBI TDP is shown as 8, it means in the last 5 mins, SBI has added 8 points to Banknifty. If input length is given as 2 , then it means the contribution of that component bank in last 10 mins ( 5*2). TDP= Time Defined Points
Nan : Not applicable
This summary table can be used to know who is actually moving the Banknifty. The current weightage is as follows:
HDFC
ICICI
KOTAK
AXIS
SBI
INDUS
Weightages will be changed as and when NSE changes it.Based on calculated fields above, one can understand how strong the moves are.If the major Banks are contributing more, it means the moves will be stable. If the lower end banks are contributing and top bank are not moving, then the current moves in Banknifty is not strong. It is also recommended to use this stats along with Component Banks charts.
Thanks to Ghanshyam Tech for inspiring to write this script!

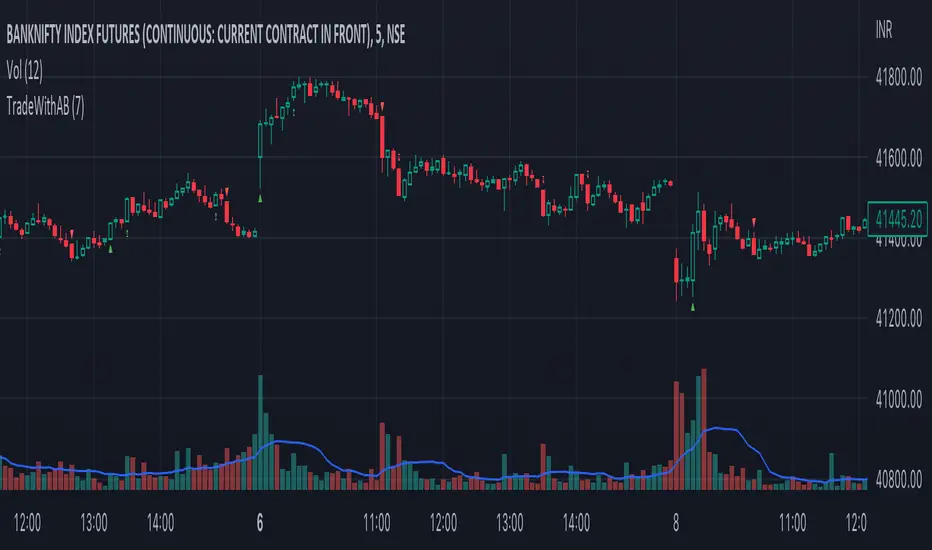
TradeWithAB SignalsThis indicator specifically designed for Momentum trading by an Intraday trader on index( Nifty , BankNifty ) and Equity stocks. This indicator works with DMI and PRICE ACTIONS which gives automated Buy and Sell signals along with Stop loss and Trailing Stop loss when certain criteria are met. It is not a Holy Grail system that gives you continuous profits and it has some limited downfalls also which can be controlled by proper risk Management and position sizing. This is a premium invite only indicator which can be use after given access to you by us. There are some guidelines on how to use this indicator which are given below and you have to follow these guidelines very strictly to get the maximum results.
Guidelines :-
1. Default Timeframe - 5 min
2. You have to take almost all the trade generated by this indicator on a particular stock/index for better results.
3. Signal confirmation is required for enter the trade as it will give you maximum profits.
4. GREEN TRIANGLE is represented as BUY Signal whereas RED TRIANGLE is represented as SELL Signal.
5. GREEN ARROW is considered as BUY TRAILING STOP LOSS as well as BUY RE-ENTRY for some scenarios.
6. RED ARROW is considered as SELL TRAILING STOP LOSS and SELL RE-ENTRY for some scenarios.
7. Ignore the signals(if any) of 1st candle(9:15)and last candle(3:25)of the day for better results.
BUY Trade Management :-
1. Trade should be initiated if and only if there is a buy signal(Green Triangle) is generated.
2. You should only enter the trade at the CLOSE of the signal generated candle.
3. Your Stop loss should be placed at the LOW of the signal generated candle.
4. There is a trailing Stop loss signal (Green Arrow) after the buying signal is generated.
5. You should trail your Stop loss at the LOW of the trailing Stop loss signal generated candle.
6. You should trail your Stop loss repeatedly until your trailing Stop loss got hit and hence Exit your buy trade.
7. After Exiting the trade you always have option to re-enter at the next trailing Stop loss signal(green arrow) generated candle CLOSE and put your Stop loss at LOW of that candle and repeat the same trailing stop loss procedures.
SELL Trade Management :-
1. Trade should be initiated if and only if there is a sell signal(Red Triangle) is generated.
2. You should only enter the trade at the CLOSE of the signal generated candle.
3. Your Stop loss should be placed at the HIGH of the signal generated candle.
4. There is a trailing Stop loss signal (Red Arrow) after the selling signal is generated.
5. You should trail your Stop loss at the HIGH of the trailing Stop loss signal generated candle.
6. You should trail your Stop loss repeatedly until your trailing Stop loss got hit and hence Exit your sell trade.
7. After Exiting the trade you have always option to re-enter at the next trailing Stop loss signal(red arrow) generated candle CLOSE and put your Stop loss at HIGH of that candle and repeat the same trailing stop loss procedures.
Disclaimer :-
*I am not a SEBI Registered Analyst and shall not be liable for any profit, loss or liability resulting, directly or indirectly from the use and results of the indicator. This is not a Holy Grail setup, sometimes the traders hit Stop loss and sometimes it gives amazing results as well.
Instructions to access to this invite-only script:-
*Send us a message if you wish to gain access to this indicator. The subscribers will get benefits of any future development or updates in the current script without any extra charges. Other trading style like swing and positional trading will also available in future updates.
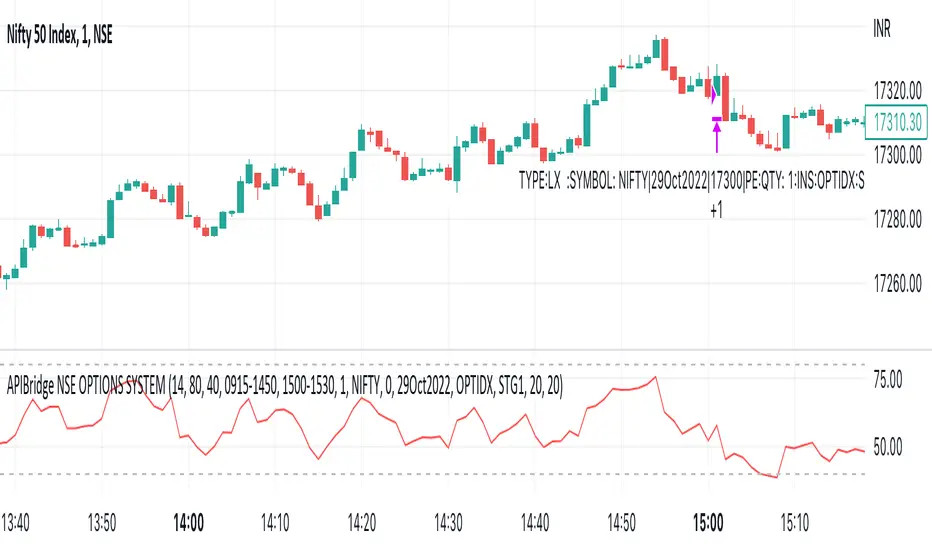
APIBridge Nifty Options Algo StrategyUsing Pinescript, we will use charts of Cash/Future to trade in Options. Note this strategy works well with even the free version of TradingView.
The Relative Strength Index ( RSI ). Is a momentum oscillator that measures the speed and change of price movements. The RSI oscillates between zero and 100. Increasing RSI shows increasing bullish momentum. Decreasing RSI shows increasing bearish momentum. We take RSI upper bound as 80 to indicate bullish momentum and RSI lower bound as 20 to indicate bearish momentum.
We use the above premise to create options buy-only strategy which trades in ATM strikes by default. This strategy requires very less margin (Minimum Rs . 15000).
Since this strategy uses underlying data (cash/future) to place trades in Options, please ignore the backtest of this strategy given by TradingView. TradingView does not provide options data but this strategy bypasses it.
Strategy Premise
The Relative Strength Index (RSI) is a momentum oscillator that measures the speed and change of price movements. The RSI oscillates between zero and 100. Increasing RSI shows increasing bullish momentum. Decreasing RSI shows increasing bearish momentum. We take RSI upper bound as 80 to indicate bullish momentum and RSI lower bound as 20 to indicate bearish momentum.
We use the above premise to create options buy-only strategy which trades in ATM strikes by default. This strategy requires very less margin (Rs. 15000 should be sufficient).
NSE Options Algo Strategy Logic
Long Entry: When RSI goes above 80, send LE in an auto-calculated option strike Call. When RSI goes below 20, send LE in auto-calculated option strike Put.
Long Exit: When we hit Stop loss or Target. In case SL/TGT does not hit and reverse RSI goes above 80 send Long Exit in auto-calculated option. Put as per last trade; RSI goes below 20, send LX in auto-calculated option call as per last trade.
For Long and Short entry the order is fired in the option buying side with auto strike price selection.
Option Strategy Parameters for TraingView Charts
RSI Length(Mandatory): Number of bars used to calculated RSI.
Upper Band(Mandatory): To specify upper band of RSI.
Lower Band(Mandatory): For specifying lower band of RSI.
Use reversal from Upper Band (Optional): This will enable short entry when RSI is falling below 80 from upper band. Recommended to keep unchecked initially.
Use reversal from Lower Band (Optional): This will enable long entry when RSI is raising above 20 from lower band. Recommended to keep unchecked initially.
Quantity: We use this specify the trade quantity (for Nifty min 75)
Custom Stop Loss in Points: Movement in chart price against the momentum which will trigger exit in options positions
Custom Target in Points: Movement in chart price against the momentum which will trigger exit in options positions
Base symbol: This is the base instrument symbol like NIFTY or BANK NIFTY.
Strike distance from ATM: Our default strike selection is considered as first ATM option (with nearest distance, only 100s are considered ). This strike distance allows to calculate ATM options which are at fixed distance.
Expiry: Expiry of option. Weekly and monthly both expiry are allowed.
Instrument: For index instrument will be OPTIDX, for stock instrument will be OPTSTK
Strategy Tag: The Strategy of Nifty options configured in Api bridge.
Setting Up Alert
Before setting up the alert make sure that you have selected desired script, time frame, strategy settings, and APIbridge configuration. Click in settings add alert and paste {{strategy.order.comment}} in message box.
Important: Do not change any settings during live trading. It may break the sequence of exit for the correct call/put.
BankNifty ScriptsBank Nifty Script
Indicator provides Daily, Hourly and Weekly EMA's Exponential Moving Averages for different scripts of Bank Nifty Composition. You'll have CMP and % change along with cRSI.
Credit to RozaniGhani-RG for cRSI code.
Default length is 50 you can change as per your choice.
Table display can be set Vertically top, right, bottom and horizontally left, centre, right.
cRSI if above > 70 the label will change to Focus on Sell and less than < 30 label will show Focus on Buy
Basically created this script for my personal use to see in one shot what's happening in Bank Nifty Composition individual scripts.
Hope it helps.

Inside Bar SetupScript Details
- This script plots Inside Bar for given day in selected time-frame (applicable only for Timeframes < Day)
- Basis plotted inside bar, relevant targets are marked on the chart
- Targets can be customised from script settings. Example, if range of mother candle is 10 points, then T1 is 10 * x above/below mother candle and T2 is 10 * y above/below mother candle. This x & y are configured via script settings
How to use this script ?
- This script works well on 10-15 mins timeframe for stocks, 15/30 mins timeframe for nifty index and 30/60 mins time frame for bank nifty index
- If mother candle high is broken, take long trade with SL of mother candle low and if low is broken, take short trade with SL of mother candle high
Remember:
1. Above logic is to be combined with support/resistances i.e. price action. This script is an add-on to price action analysis giving you more conviction.
2. If range of mother candle is very high, it is recommended to avoid the trade.
3. Basis inside bar formed on higher time frame, take trade on basis of lower time frame i.e if inside bar is formed on 60 mins, take trade on the basis of 10-15 mins time frame
Example:
1. As seen in the chart, Nifty is near it's resistance and we are seeing Inside Bar being formed, In such scenario, even if High of Mother Candle is broken, we should be more interested to short as we are near resistance and probability of getting our targets in long side is less.
2. So, if I see breakdown of mother candle i.e. price going below low of mother candle, we will short with SL of high of mother candle.
3. As seen in the chart, both the targets are achieved.
Additional Info:
1. Targets on Long/Short Side can be configured via settings. For indices 1 times/1.5 times the range works well.
2. This script plots targets basis the first inside bar formed in the day for selected time frame.
3. Inside bars formed through out the day are coloured separately but lines are plotted only on the basis of 1st formed inside bar as this strategy works well for the first formed inside bar)
4. Don't forget to check volume in case of breakout/breakdown.
Note:
1. Mother Candle - First Candle of Inside Bar
2. Child Candle - Candle formed inside Mother Candle (Second Candle of Inside Bar)
Happy Trading :)

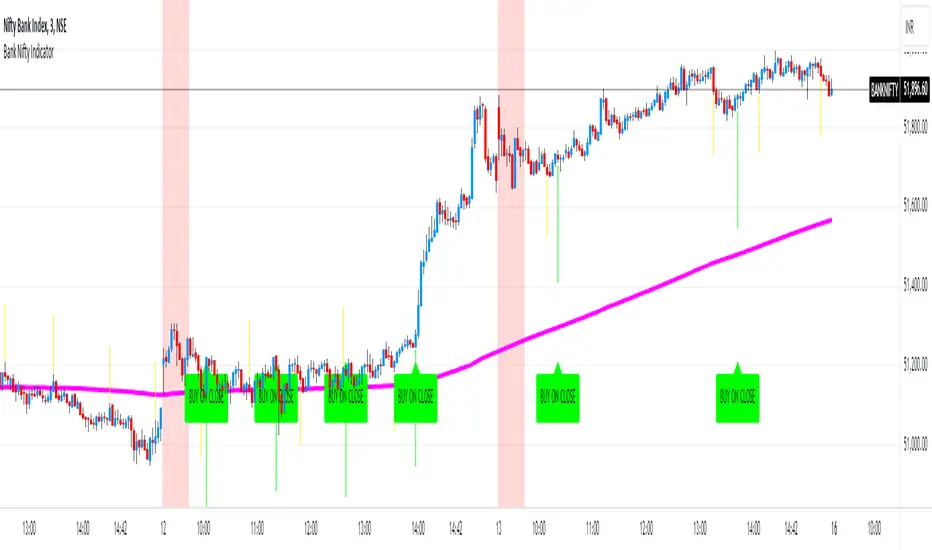
Bank Nifty Indicator by 'Bank Of Nifty'What is this indicator?
The indicator uses a series of Exponential Moving Averages, their directions and crossovers combined with Parabolic Stop And Reverse (SAR) to determine potential intraday entry points on the BANKNIFTY Index. It uses a long-period EMA to filter the direction of trade. For example, when the price is above the long-period EMA, it only generates Buy signals. It generates signals only between 10AM and 02:30PM IST. It has alert conditions for potential Long/Short Entry triggers.
Understanding the indicator plotted on the chart:
- The indicator uses settings that are arrived at after testing multiple conditions. Therefore, it does not allow the user to change these settings as doing so will render the indicator useless.
- EMA Line: One long-period EMA acts as a direction filter for trade signals. If price is above this EMA, only Buy signals are generated and if price is below this EMA, only Sell signals are generated.
- Yellow Arrows: These are early warning signs that a potential entry may be triggering soon. As it uses only some of the entry conditions to predict a potential entry, there can be multiple such signals before an actual signal is generated. These are only meant to be used as alerts and should NEVER be traded individually. Long Warning Alert and Short Warning Alert can be created using the 'Create Alert' dialog box.
- Buy On Close/Sell On Close Signals: These are actual entry triggers that are meant to be traded when confirmed by a candle close.
- Red Background: It indicates the first 30 minutes of the market opening from 9:15AM to 9:45AM.
- Colours for everything appearing on the chart can be customised in settings.
Notes and Usage Guidelines:
- The indicator should only be used on the BANKNIFTY Index for INTRADAY trades .
- For best results, use the 3 Minutes Chart and only trade the day's first signal after a 3 minute candle closes confirming the signal.
- Buy/Sell Signals are only generated between 10AM and 02:30PM .
- These signals work best in trending market conditions. In sideways and range-bound markets, there will be multiple false signals that could lead to losses. Therefore, it is best to limit the number of trades to 1 per day .
Why is this indicator closed source?
This indicator is closed source because it uses a specific combination of settings for indicators that are not available in the public domain, even though the indicators themselves are in the public domain. Keeping it closed source protects these settings from being discovered and as well as preserving them for the indicator to be useful. Without this specific combination of settings and values, the indicator becomes useless.
Disclaimer:
- Trade decisions should NOT be based solely on this indicator. It is meant to aid in confirming a direction bias and act as a confluence to the trader's analysis of the existing market condition.
- The indicator may be updated from time to time to adapt to changed market conditions.
Average Daily Range (ADR) (Multi Timeframe, Multi Period)Average Daily Range (ADR)
(Multi Timeframe, Multi Period, Extended Levels)
Tips
• Narrow Zones are an indication of breakouts. It can be a very tight range as well.
• Wider Zones can be Sideways or Volatile.
What is this Indicator?
• This is Average Daily Range (ADR) Zones or Pivots.
• This have Multi Timeframe, Multi Period (Up to 3 Levels) and Extended Target Levels.
Advantages of this Indicator
• This is a Leading indicator, not Dynamic or Repaint.
• Helps to identify the reversal points.
• The levels are more accurate and not like the old formulas.
• Can practically follow the Buy Low and Sell High principle.
• Helps to keep minimum Stop Loss.
Who to use?
• Highly beneficial for Day Traders
• It can be used for Swing and Positions as well.
What timeframe to use?
• Any timeframe.
When to use?
• Any market conditions.
How to use?
Entry
• Long entry when the Price reach at or closer to the Green Support zone.
• Long entry when the Price retrace to the Red Resistance zone.
• Short entry when the Price reach at or closer to the Red Resistance zone.
• Short entry when the Price retrace to the Green Support zone.
• Long or Short at the Pivot line.
Exit
• Use past ADR levels as targets.
• Or use the Target levels in the indicator for breakouts.
• Use the Pivot line as target.
• Use Support or Resistance Zones as targets in reversal method.
What are the Lines?
Gray Line:
• It the day Open or can be considered as Pivot.
Red & Green ADR Zones:
• Red Zone is Resistance.
• Green Zone is Support.
• Mostly price can reverse from this Zones.
• Multiple Red and Green Lines forms a Zone.
• These lines are average levels of past days which helps to figure out the maximum and minimum price range that can be moved in that day.
• The default number of days are 5, 7 and 14. This can be customized.
Red & Green Target Lines:
• These are Target levels.
What are the Labels?
• First Number: Price of that level.
• Numbers in (): Percentage change and Change of price from LTP (Last Traded Price) to that Level.
General Tips
• It is good if Stock trend is same as that of the Index trend.
• Lots of indicators creates lots of confusion.
• Keep the chart simple and clean.
• Buy Low and Sell High.
• Master averages or 50%.
