OPEN-SOURCE SCRIPT
NSE Sector Performance
Zaktualizowano
Use this indicator on daily timeframe
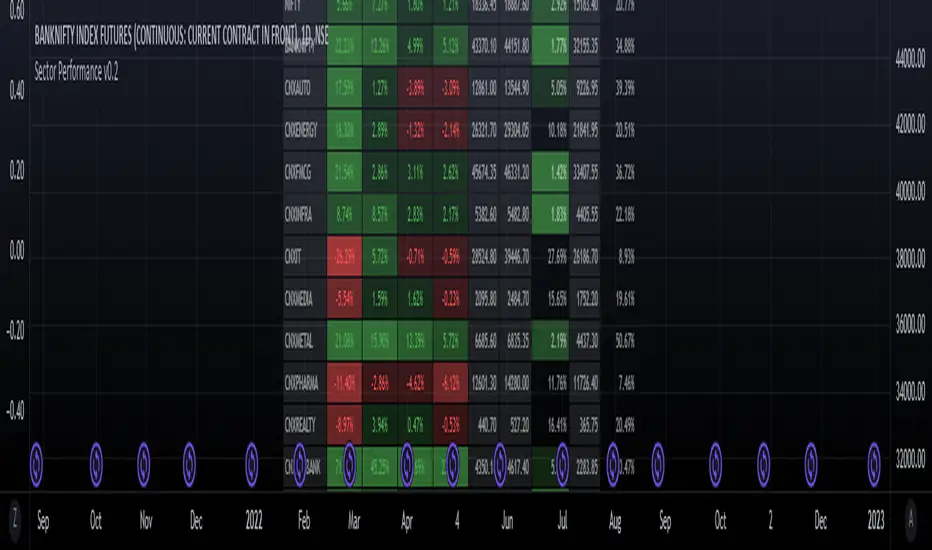
This indicator shows the performance of the top NSE Sectors for 4 time periods.
User has the flexibility to define the time periods (ex. Yearly Monthly Quarterly Weekly Daily
indicator shows the performance of the sector for those time periods along with 250d High/Low and distance from the High/Low
User input is provided to drill down into performance of the top stocks in those sectors.
Informacje o Wersji
- Added a header row to the table to show the sector title
- Input text area to provide option for users to add/modify stocks for the specific sector. Up to 40 stocks/sector are supported.
- % from High, % from Low are color coded to easily identify the sectors/stocks that are about to breakout / breakdown
Informacje o Wersji
Sector RSInformacje o Wersji
- Publishing the table version instead of RS lines version as screenshot shows
Skrypt open-source
W prawdziwym duchu TradingView autor tego skryptu opublikował go jako open source, aby inwestorzy mogli go zrozumieć i zweryfikować. Pozdrowienia dla autora! Możesz go używać bezpłatnie, ale ponowne użycie tego kodu w publikacji podlega Zasadom Regulaminu. Możesz go oznaczyć jako ulubione, aby użyć go na wykresie.
Wyłączenie odpowiedzialności
Informacje i publikacje przygotowane przez TradingView lub jego użytkowników, prezentowane na tej stronie, nie stanowią rekomendacji ani porad handlowych, inwestycyjnych i finansowych i nie powinny być w ten sposób traktowane ani wykorzystywane. Więcej informacji na ten temat znajdziesz w naszym Regulaminie.