OPEN-SOURCE SCRIPT
Donchian Channel Crosses_AIT
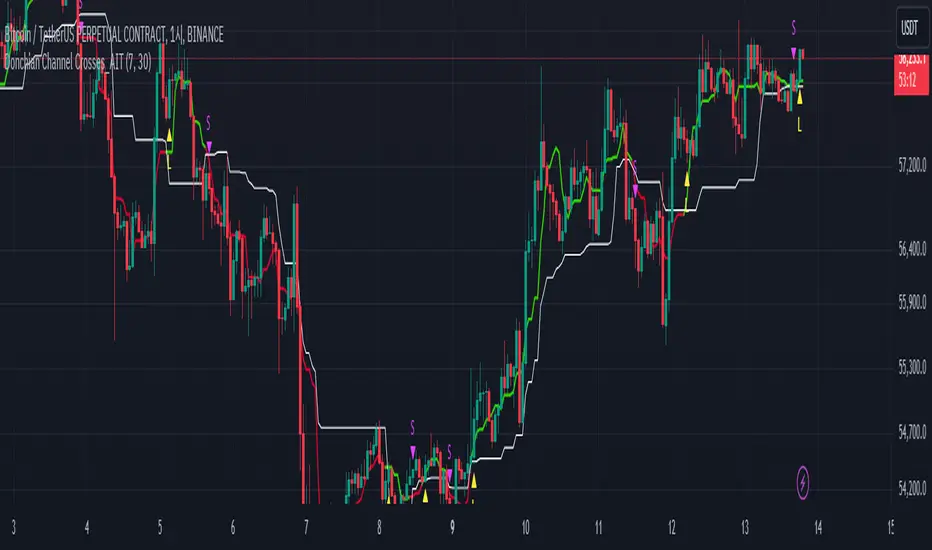
Indicator Name: Donchian Channel Crosses_AIT
Programming Language: Pine Script (TradingView)
Description
The Donchian Channel Crosses_AIT indicator is designed to provide trading signals based on the crossover of two Donchian Channels with different lookback periods. The indicator uses two channels, Donchian Channel A (default 7-day period) and Donchian Channel B (default 30-day period), to detect upward or downward momentum shifts. The signals are generated when the middle line of Donchian Channel A crosses above or below the middle line of Donchian Channel B.
Components
Donchian Channel A:
Default period: 7 days (modifiable by the user).
Middle Line: Calculated as the average of the highest high and lowest low over the period.
The middle line changes color depending on its position relative to Donchian Channel B.
Green: When Donchian Channel A's middle line is above Donchian Channel B's middle line.
Red: When Donchian Channel A's middle line is below Donchian Channel B's middle line.
Donchian Channel B:
Default period: 30 days (modifiable by the user).
Middle Line: Also calculated as the average of the highest high and lowest low over the period.
Always displayed as a white line with a line thickness of 1.
Long Signal:
Triggered when the middle line of Donchian Channel A crosses above the middle line of Donchian Channel B.
Displayed as a yellow triangle pointing up (L) below the price bar.
Short Signal:
Triggered when the middle line of Donchian Channel A crosses below the middle line of Donchian Channel B.
Displayed as a fuchsia triangle pointing down (S) above the price bar.
Settings
Donchian Channel A:
Default period: 7 days (modifiable via user input).
Middle line changes color based on its relationship to Donchian Channel B.
Donchian Channel B:
Default period: 30 days (modifiable via user input).
Middle line is always white and displayed with a line thickness of 1.
Signal Display:
Long Signal: A yellow "L" triangle is displayed when Donchian Channel A’s middle line crosses above Donchian Channel B’s middle line.
Short Signal: A fuchsia "S" triangle is displayed when Donchian Channel A’s middle line crosses below Donchian Channel B’s middle line.
Signals can be toggled on or off using the "Show Signals" setting.
Usage
Trend Confirmation:
Use this indicator to confirm trend direction by monitoring the relationship between Donchian Channel A and Donchian Channel B.
Uptrend: When Donchian Channel A’s middle line is above Donchian Channel B’s middle line (green line for Donchian A).
Downtrend: When Donchian Channel A’s middle line is below Donchian Channel B’s middle line (red line for Donchian A).
Entry and Exit Signals:
Long Signal: Enter a buy position when Donchian Channel A crosses above Donchian Channel B.
Short Signal: Enter a sell position when Donchian Channel A crosses below Donchian Channel B.
Visual Representation:
The Donchian Channels are drawn on the price chart, with Donchian Channel A dynamically changing color depending on its relative position to Donchian Channel B.
Skrypt open-source
W zgodzie z duchem TradingView twórca tego skryptu udostępnił go jako open-source, aby użytkownicy mogli przejrzeć i zweryfikować jego działanie. Ukłony dla autora. Korzystanie jest bezpłatne, jednak ponowna publikacja kodu podlega naszym Zasadom serwisu.
Wyłączenie odpowiedzialności
Informacje i publikacje nie stanowią i nie powinny być traktowane jako porady finansowe, inwestycyjne, tradingowe ani jakiekolwiek inne rekomendacje dostarczane lub zatwierdzone przez TradingView. Więcej informacji znajduje się w Warunkach użytkowania.