OPEN-SOURCE SCRIPT
Critical Levels Mixing Price Action, Volatility and Volume
Introduction
This indicator has the purpose of setting levels, automatically, basing its creation on three aspects of the market:
- price action
- volume
- volatility
Price Action Algorithm
I divided the candle into 3 parts:
- body => abs (close-open)
- lower tail => red candle (close-low) green candle (open-low)
- upper tail => red candle (high-open) green candle (high-close)
- total => high-low
to give the signal the following conditions must be respected
- the body must be smaller than a certain percentage ("MAX CORE SIZE%) and larger than a certain percentage (" MIN CORE SIZE%);
- furthermore, the shorter tail cannot be higher than a certain percentage ("MAXIMUM LENGTH FOR SHORTE TAIL%");
Volume Algorithm
The volume value must be greater than the volume EMA multiplied by a certain value ("Multiplier")
Volatility Algorithm
the True Range of the candle must be greater than the "ATR percentage" of the ATR
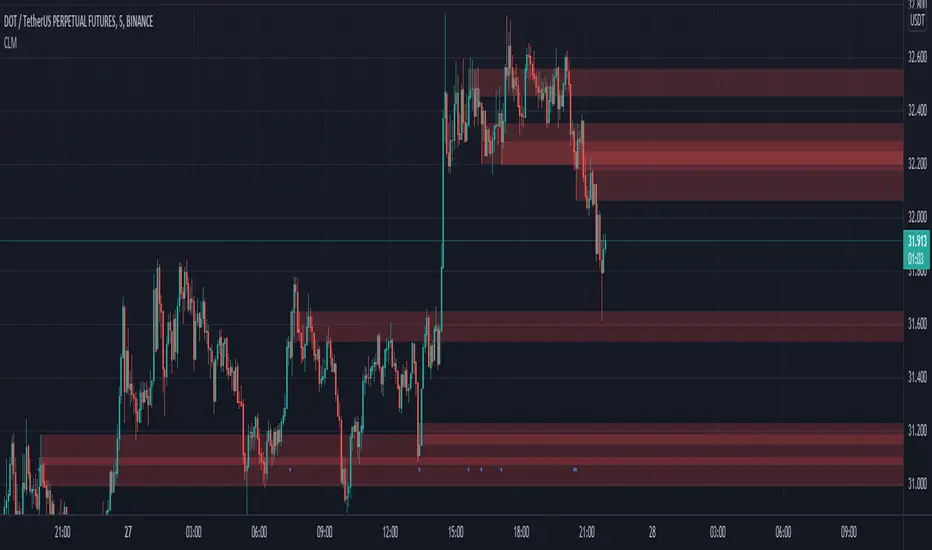
Trigger
If all these three conditions are met then and only then will the level be drawn that will include the prices of the longest tail of the candle (high/open or open/low or high/close or close/low).
How to use
Like any level, the situation in which the price is reached does not imply a market reaction, for this reason, the use together with moving averages or oscillators from which to extrapolate the divergences can be a valid tool.
Using this indicator alone you can enter the market by placing a pending order above the high or low of the candle touching the level.
Example:
a bearish candle touches a low level, we place a pending buy order above the high of the candle
a bullish candle touches a level located high, we place a pending sell order below the low of the candle
This indicator has the purpose of setting levels, automatically, basing its creation on three aspects of the market:
- price action
- volume
- volatility
Price Action Algorithm
I divided the candle into 3 parts:
- body => abs (close-open)
- lower tail => red candle (close-low) green candle (open-low)
- upper tail => red candle (high-open) green candle (high-close)
- total => high-low
to give the signal the following conditions must be respected
- the body must be smaller than a certain percentage ("MAX CORE SIZE%) and larger than a certain percentage (" MIN CORE SIZE%);
- furthermore, the shorter tail cannot be higher than a certain percentage ("MAXIMUM LENGTH FOR SHORTE TAIL%");
Volume Algorithm
The volume value must be greater than the volume EMA multiplied by a certain value ("Multiplier")
Volatility Algorithm
the True Range of the candle must be greater than the "ATR percentage" of the ATR
Trigger
If all these three conditions are met then and only then will the level be drawn that will include the prices of the longest tail of the candle (high/open or open/low or high/close or close/low).
How to use
Like any level, the situation in which the price is reached does not imply a market reaction, for this reason, the use together with moving averages or oscillators from which to extrapolate the divergences can be a valid tool.
Using this indicator alone you can enter the market by placing a pending order above the high or low of the candle touching the level.
Example:
a bearish candle touches a low level, we place a pending buy order above the high of the candle
a bullish candle touches a level located high, we place a pending sell order below the low of the candle
Skrypt open-source
W zgodzie z duchem TradingView twórca tego skryptu udostępnił go jako open-source, aby użytkownicy mogli przejrzeć i zweryfikować jego działanie. Ukłony dla autora. Korzystanie jest bezpłatne, jednak ponowna publikacja kodu podlega naszym Zasadom serwisu.
Wyłączenie odpowiedzialności
Informacje i publikacje nie stanowią i nie powinny być traktowane jako porady finansowe, inwestycyjne, tradingowe ani jakiekolwiek inne rekomendacje dostarczane lub zatwierdzone przez TradingView. Więcej informacji znajduje się w Warunkach użytkowania.