PROTECTED SOURCE SCRIPT
Zaktualizowano 3D-WAVE-PM indicator
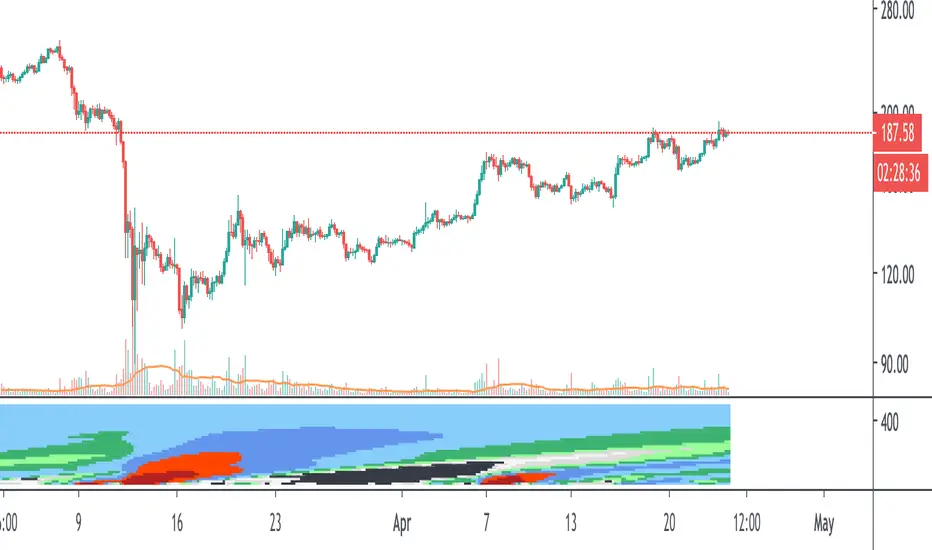
This is an extension of the WAVE-PM indicator as explained by Mark Whistler in his book Volatility Illuminated.
This heatmap represent different lengths of WAVE-PM indicator, starting from 20 and incremented by 15 until 485.
As a reminder, WAVE-PM compare the size of the current distribution to the last 100.
The result is represented as a number between 0 and 1.
The more close to 0, the more contracted the distribution is.
The more close to 1, the more expanded the distribution is.
The color code is the same as my standard WAVE-PM indicator :
Between 0.35 and 0.5 also known as the "Gear change" level => Grey
Between 0.5 and 0.7 also known as the "Consolidation" level => Green
Between 0.7 and 0.9 also known as the "Breakout" level => Blue
Between 0.9 and 1 also known as the "Danger" level => Red
Note that i have colored results below 0.35 as black
Note also that each level has been divided in 2 colors : The light one for the lower half of the range and the dark one for the higher half.
You should resize the indicator window to have a clear and continuous heatmap.
Informacje o Wersji
- Updated to pinescript v4Skrypt chroniony
Ten skrypt został opublikowany jako zamknięty kod źródłowy. Można z tego korzystać swobodnie i bez żadnych ograniczeń — więcej informacji znajduje się tutaj.
Wyłączenie odpowiedzialności
Informacje i publikacje nie stanowią i nie powinny być traktowane jako porady finansowe, inwestycyjne, tradingowe ani jakiekolwiek inne rekomendacje dostarczane lub zatwierdzone przez TradingView. Więcej informacji znajduje się w Warunkach użytkowania.
Skrypt chroniony
Ten skrypt został opublikowany jako zamknięty kod źródłowy. Można z tego korzystać swobodnie i bez żadnych ograniczeń — więcej informacji znajduje się tutaj.
Wyłączenie odpowiedzialności
Informacje i publikacje nie stanowią i nie powinny być traktowane jako porady finansowe, inwestycyjne, tradingowe ani jakiekolwiek inne rekomendacje dostarczane lub zatwierdzone przez TradingView. Więcej informacji znajduje się w Warunkach użytkowania.