INVITE-ONLY SCRIPT
Zaktualizowano Niteya BG Strategy ORION
Niteya BG Strategy ORION is a strategy that generates buy and sell signals with an indicator and supporting the signals of the indicator with two indicators, and enables another two indicators (Trend strength and volume) for supporting the signals depending on the user's request.
Since the long operation entry signal is given at price levels when the trend gains a certain upward momentum, rather than at the beginning of the trend when the risk is high, the profit margin and risk will be relatively lower.
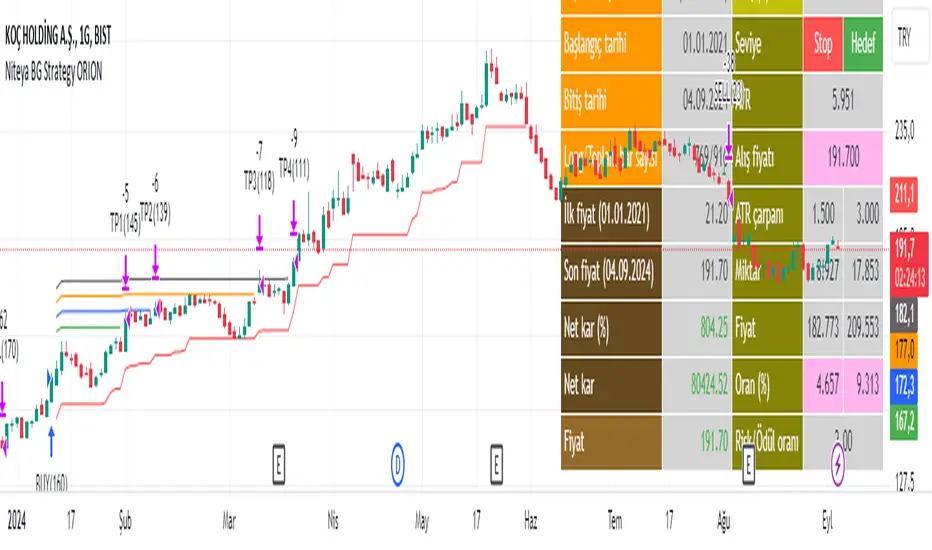
Using the strategy, in order to minimize the risk, before making decisions to enter and exit a long operation for a stock, you can examine the data shown in the table below for the desired time interval on the chart:
bilgigunlugum.net/public/images/borsa/orion_s_table.png
Strategy features
Strategy operations
Within the strategy, predefined values of the strategy can be changed:
Strategy table
All entry values used within the strategy, backtest results, highest closing value of the stock in dollars and TL in the past, future TL price estimate in dollars and expected increase percentage, ATR value obtained in accordance with the chart period and target and stop loss rates and prices are shown in a table.
Details
bilgigunlugum.net/borsa/pine_script/pine_script_strategy/orion_s
Türkçe açıklama
Niteya BG Strategy ORION, al ve sat kararlarını, bir indikatörün sinyallerini iki indikatör ile destekleyerek veren, iki indikatörü (Trend gücü ve hacim) de kullanıcı isteğine bağlı olarak bu kararların alınmasında devreye sokarak, long işlemlere giriş ve çıkış yapılmasını sağlayan bir stratejidir.
Long işleme giriş sinyali, riskin yüksek olduğu trend başlangıcında değil daha sonra trendin belli bir yükseliş ivmesi kazandığı fiyat seviyelerinde verildiğinden, kar oranı ve risk nisbeten daha düşük olacaktır.
Stratejiyi kullanarak, riski en düşük seviyeye indirmek için, bir hisse için long işleme giriş ve çıkış kararları vermeden önce, grafik üzerinde dilediğiniz zaman aralığı için, aşağıdaki tabloda gösterilen verileri inceleyebilirsiniz:
bilgigunlugum.net/public/images/borsa/orion_s_table.png
Strateji özellikleri
Strateji işlemleri
Strateji dahilinde, stratejiye ait ön tanımlı değerler değiştirilebilir:
Strateji tablosu
Strateji dahilinde kullanılan tüm giriş değerleri, backtest sonuçları, hissenin geçmişte dolar ve TL. bazında aldığı en yüksek kapanış değeri, dolar bazında gelecek TL. fiyat tahmini ve beklenen artış yüzdesi ile grafik periyoduna uygun olarak elde edilen ATR değeri ile hedef ve zarar kes oranları ve fiyatları bir tabloda gösterilir.
Detaylar
bilgigunlugum.net/borsa/pine_script/pine_script_strateji/orion_s
Since the long operation entry signal is given at price levels when the trend gains a certain upward momentum, rather than at the beginning of the trend when the risk is high, the profit margin and risk will be relatively lower.
Using the strategy, in order to minimize the risk, before making decisions to enter and exit a long operation for a stock, you can examine the data shown in the table below for the desired time interval on the chart:
bilgigunlugum.net/public/images/borsa/orion_s_table.png
Strategy features
- Backtest date range and results
- Profitable percentage and net profit values
- Number of opened, closed and take-profit operations
- Long operations opening and closing bars and bar index where the operation is made
- Bars and indices where take-profit operations are made and number of shares sold
- Number of bars where backtest is made and number of bars where long operation is opened
- Net profit and net profit percentage value that can be obtained from a stock held after being purchased at the beginning of the backtest time interval
- Closing price of the stock
- Highest closing value of the stock in the past (TL)
- Highest closing value of the stock in the past (USD)
- Future price estimate according to dollar-based value (TL)
- Expected estimated increase percentage
- ATR according to the chart period value
- Share purchase price (Closing value)
- Stop loss and target ATR multipliers
- Amount to decrease or increase in case of stop loss and sell with profit according to the purchase price
- Stop loss and sell with profit prices
- Ratio subtracted from the purchase price for stop loss or added to the purchase price for target price
- Risk/Reward ratio
Strategy operations
Within the strategy, predefined values of the strategy can be changed:
- Strategy backtest range can be changed.
- The location of the strategy table can be changed.
- The trend strength and volume indicator can be used in the implementation of long and short operations depending on the user's request.
- Depending on the user's request, after the Long operation, take profit operations can be made 1-4 times at the price levels calculated according to the ATR value. Take profit price levels are shown on the graph.
- For take profit operations at 4 different levels, take profit multiplier and rate can be changed.
- Depending on the user's request, ATR-based stop loss, indicator short value or both can be used at the same time for exiting the Long operation.
- Stop loss ATR period and multiplier can be changed.
- After long operation, take profit selling price level lines are calculated dynamically depending on ATR value.
- After long operation, stop loss selling price level lines are calculated dynamically depending on ATR value with the tracking feature.
Strategy table
All entry values used within the strategy, backtest results, highest closing value of the stock in dollars and TL in the past, future TL price estimate in dollars and expected increase percentage, ATR value obtained in accordance with the chart period and target and stop loss rates and prices are shown in a table.
Details
bilgigunlugum.net/borsa/pine_script/pine_script_strategy/orion_s
Türkçe açıklama
Niteya BG Strategy ORION, al ve sat kararlarını, bir indikatörün sinyallerini iki indikatör ile destekleyerek veren, iki indikatörü (Trend gücü ve hacim) de kullanıcı isteğine bağlı olarak bu kararların alınmasında devreye sokarak, long işlemlere giriş ve çıkış yapılmasını sağlayan bir stratejidir.
Long işleme giriş sinyali, riskin yüksek olduğu trend başlangıcında değil daha sonra trendin belli bir yükseliş ivmesi kazandığı fiyat seviyelerinde verildiğinden, kar oranı ve risk nisbeten daha düşük olacaktır.
Stratejiyi kullanarak, riski en düşük seviyeye indirmek için, bir hisse için long işleme giriş ve çıkış kararları vermeden önce, grafik üzerinde dilediğiniz zaman aralığı için, aşağıdaki tabloda gösterilen verileri inceleyebilirsiniz:
bilgigunlugum.net/public/images/borsa/orion_s_table.png
Strateji özellikleri
- Backtest tarih aralığı ile sonuçları
- Karlı yüzde ve net kar değerleri
- Açılan, kapatılan ve kar alma işlem sayıları
- Long işlem açılış ve kapanış barları ve işlemin yapıldığı bar endeksi
- Kar alma işlemi yapılan barlar ve endeksleri ile satışı yapılan hisse adedi
- Backtest yapılan bar sayısı ve long işlemin açılı olduğu bar sayısı
- Backtest zaman aralığı başında satın alındıktan sonra elde tutulan bir hisseden elde edilebilecek net kazanç ve net kazanç yüzde değeri
- Hissenin kapanış fiyatı
- Hissenin geçmişte aldığı en yüksek kapanış değeri (TL)
- Hissenin geçmişte aldığı en yüksek kapanış değeri (USD)
- Dolar bazlı değerine göre gelecek fiyat tahmini (TL)
- Beklenen tahmini artış yüzdesi
- Grafik periyoduna göre ATR değeri
- Hisse alış fiyatı (Kapanış değeri)
- Zarar kes ve hedef ATR çarpanları
- Alış fiyatına göre zarar kes ve kar ile satış durumunda azalacak veya artacak miktar
- Zarar kes ve kar ile satış fiyatları
- Zarar kes için alış fiyatından çıkartılan veya hedef fiyat için alış fiyatına eklenen oran
- Risk/Ödül oranı
Strateji işlemleri
Strateji dahilinde, stratejiye ait ön tanımlı değerler değiştirilebilir:
- Strateji backtest aralığı değiştirilebilir.
- Strateji tablosunun yeri değiştirilebilir.
- Trend gücü ile hacim göstergesi kullanıcı isteğine bağlı olarak long ve short işlemlerin uygulanmasında kullanılabilir.
- Kullanıcı isteğine bağlı olarak, Long işlem sonrası, ATR değerine göre hesaplanan fiyat seviyelerinde, 1-4 kez kar alma işlemleri yapılabilir. Kar alma fiyat seviyeleri grafik üzerinde gösterilir.
- 4 farklı seviyedeki kar alma işlemleri için, kar alma çarpanı ve oranı değiştirilebilir.
- Kullanıcı isteğine bağlı olarak, Long işlemden çıkış için ATR temelli zarar kes, gösterge short değeri veya her ikisi birden aynı anda kullanılabilir.
- Stop loss ATR periyodu ve çarpanı değiştirilebilir.
- Long işlem sonrasında, kar alma satış fiyatı seviye çizgileri ATR değerine bağlı olarak dinamik bir şekilde hesaplanır.
- Long işlem sonrasında, zarar kes satış fiyatı seviye çizgileri ATR değerine bağlı olarak iz süren özelliğiyle dinamik bir şekilde hesaplanır.
Strateji tablosu
Strateji dahilinde kullanılan tüm giriş değerleri, backtest sonuçları, hissenin geçmişte dolar ve TL. bazında aldığı en yüksek kapanış değeri, dolar bazında gelecek TL. fiyat tahmini ve beklenen artış yüzdesi ile grafik periyoduna uygun olarak elde edilen ATR değeri ile hedef ve zarar kes oranları ve fiyatları bir tabloda gösterilir.
Detaylar
bilgigunlugum.net/borsa/pine_script/pine_script_strateji/orion_s
Informacje o Wersji
Strategy version 1.1Long entry and exit condition improved
Skrypt tylko na zaproszenie
Dostęp do tego skryptu mają tylko użytkownicy upoważnieni przez autora i zazwyczaj wiąże się z opłatą. Możesz dodać go do ulubionych, ale będziesz mógł z niego korzystać dopiero po uzyskaniu zgody jego autora. Skontaktuj się z Niteya po więcej informacji lub postępuj zgodnie z instrukcjami autora poniżej.
Należy pamiętać, że jest to prywatny skrypt dostępny tylko na zaproszenie, który nie został przeanalizowany przez moderatorów skryptów. Jego zgodność z Regulaminem jest nieokreślona. TradingView nie sugeruje płacenia za skrypt i korzystania z niego, jeśli nie ufasz w 100% jego autorowi i nie rozumiesz, jak działa skrypt. W wielu przypadkach możesz znaleźć dobrą alternatywę open-source za darmo w naszych Skryptach Społeczności.
Instrukcje autora
″Users can request access to the indicator via the e-mail address info@bilgigunlugum.net.
Kullanıcılar indikatöre erişim için info@bilgigunlugum.net e-posta adresinden talepte bulunabilirler.
Chcesz użyć tego skryptu na wykresie?
Ostrzeżenie: przeczytaj to zanim poprosisz o dostęp.
Wyłączenie odpowiedzialności
Informacje i publikacje przygotowane przez TradingView lub jego użytkowników, prezentowane na tej stronie, nie stanowią rekomendacji ani porad handlowych, inwestycyjnych i finansowych i nie powinny być w ten sposób traktowane ani wykorzystywane. Więcej informacji na ten temat znajdziesz w naszym Regulaminie.