OPEN-SOURCE SCRIPT
Rise Sense Capital - RSI MACD Spot Buying Indicator

Today, I'll share a spot buying strategy shared by a member kr陳 within the DATA Trader Alliance Alpha group. First, you need to prepare two indicators:
今天分享一個DATA交易者聯盟Alpha群組裏面的群友kr陳分享的現貨買入策略。
首先需要準備兩個指標
RSI Indicator (Relative Strength Index) - RSI is a technical analysis tool based on price movements over a period of time to evaluate the speed and magnitude of price changes. RSI calculates the changes in price over a period to determine whether the recent trend is relatively strong (bullish) or weak (bearish).
RSI指標,(英文全名:Relative Strength Index),中文稱為「相對強弱指標」,是一種以股價漲跌為基礎,在一段時間內的收盤價,用於評估價格變動的速度 (快慢) 與變化 (幅度) 的技術分析工具,RSI藉由計算一段期間內股價的漲跌變化,判斷最近的趨勢屬於偏強 (偏多) 還是偏弱 (偏空)。

MACD Indicator (Moving Average Convergence & Divergence) - MACD is a technical analysis tool proposed by Gerald Appel in the 1970s. It is commonly used in trading to determine trend reversals by analyzing the convergence and divergence of fast and slow lines.
MACD 指標 (Moving Average Convergence & Divergence) 中文名為平滑異同移動平均線指標,MACD 是在 1970 年代由美國人 Gerald Appel 所提出,是一項歷史悠久且經常在交易中被使用的技術分析工具,原理是利用快慢線的交錯,藉以判斷股價走勢的轉折。
In MACD analysis, the most commonly used values are 12, 26, and 9, known as MACD (12,26,9). The market often uses the MACD indicator to determine the future direction of assets and to identify entry and exit points.
在 MACD 的技術分析中,最常用的值為 12 天、26 天、9 天,也稱為 MACD (12,26,9),市場常用 MACD 指標來判斷操作標的的後市走向,確定波段漲幅並找到進、出場點。

Strategy analysis by member KR陳:
策略解析 by群友 KR陳 :
Condition 1: RSI value in the previous candle is below oversold zone(30).
條件1:RSI 在前一根的數值低於超賣區(30)
Pine Script®

Condition 2: MACD histogram changes from decreasing to increasing.
條件2:MACD柱由遞減轉遞增
Pine Script®

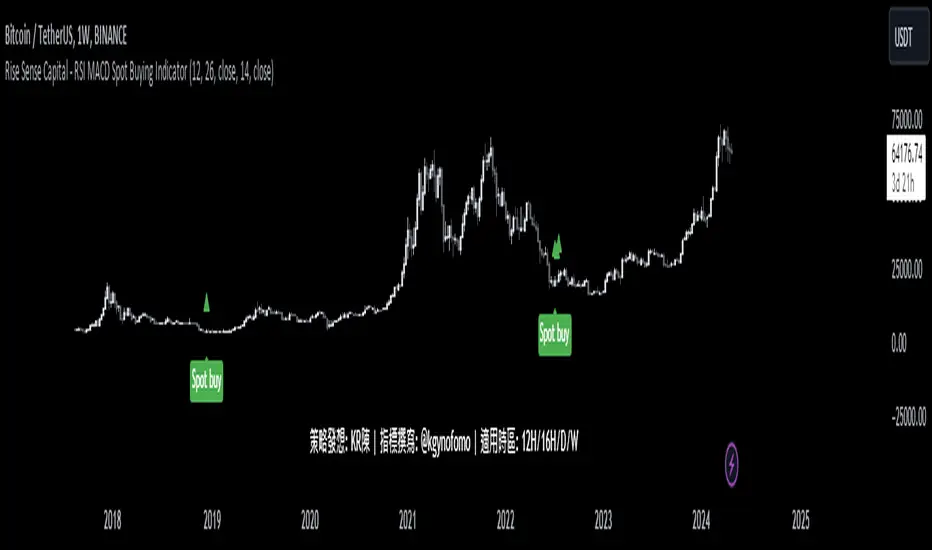
Strategy Effect Display:
策略效果展示:

Slight modification:
稍微修改:
I've added the ATR-MACD, developed earlier, as a filter signal alongside the classic MACD. The appearance of an upward-facing triangle indicates that the ATR MACD histogram also triggers the condition, aiming to serve as a filtering mechanism.
我在經典的macd作爲條件的同時 也加入了之前開發的ATR-MACD作爲過濾信號 出現朝上的三角圖示代表ATR MACD的柱狀圖一樣觸發條件 希望可以以此起到過濾的作用
Asset/Usage Instructions:
使用標的/使用説明
Through backtesting, it's found that it's not suitable for smaller time frames as there's a lot of noise. It's recommended to use it in assets with a long-term bullish view, focusing on time frames of 12 hours or longer such as 12H, 16H, 1D, 1W to find spot buying opportunities.
經過回測發現 并不適用與一些小級別時區 噪音會非常多,建議在一些長期看漲的標的中切入12小時以上的時區如12H,16H, 1D, 1W 中間尋找現貨買入的機會。
A few thoughts:
Overall, it's a very good indicator strategy for spot buying in the physical market. Thanks to member kr陳 for sharing!
一些小感言 綜合來看是一個針對現貨買入非常好的指標策略,感謝群友kr陳的分享!
今天分享一個DATA交易者聯盟Alpha群組裏面的群友kr陳分享的現貨買入策略。
首先需要準備兩個指標
RSI Indicator (Relative Strength Index) - RSI is a technical analysis tool based on price movements over a period of time to evaluate the speed and magnitude of price changes. RSI calculates the changes in price over a period to determine whether the recent trend is relatively strong (bullish) or weak (bearish).
RSI指標,(英文全名:Relative Strength Index),中文稱為「相對強弱指標」,是一種以股價漲跌為基礎,在一段時間內的收盤價,用於評估價格變動的速度 (快慢) 與變化 (幅度) 的技術分析工具,RSI藉由計算一段期間內股價的漲跌變化,判斷最近的趨勢屬於偏強 (偏多) 還是偏弱 (偏空)。
MACD Indicator (Moving Average Convergence & Divergence) - MACD is a technical analysis tool proposed by Gerald Appel in the 1970s. It is commonly used in trading to determine trend reversals by analyzing the convergence and divergence of fast and slow lines.
MACD 指標 (Moving Average Convergence & Divergence) 中文名為平滑異同移動平均線指標,MACD 是在 1970 年代由美國人 Gerald Appel 所提出,是一項歷史悠久且經常在交易中被使用的技術分析工具,原理是利用快慢線的交錯,藉以判斷股價走勢的轉折。
In MACD analysis, the most commonly used values are 12, 26, and 9, known as MACD (12,26,9). The market often uses the MACD indicator to determine the future direction of assets and to identify entry and exit points.
在 MACD 的技術分析中,最常用的值為 12 天、26 天、9 天,也稱為 MACD (12,26,9),市場常用 MACD 指標來判斷操作標的的後市走向,確定波段漲幅並找到進、出場點。
Strategy analysis by member KR陳:
策略解析 by群友 KR陳 :
Condition 1: RSI value in the previous candle is below oversold zone(30).
條件1:RSI 在前一根的數值低於超賣區(30)
buycondition1 = RSI[1]<30
Condition 2: MACD histogram changes from decreasing to increasing.
條件2:MACD柱由遞減轉遞增
buycondition2 = hist[2]>hist[1] and hist[1]<hist
Strategy Effect Display:
策略效果展示:
Slight modification:
稍微修改:
I've added the ATR-MACD, developed earlier, as a filter signal alongside the classic MACD. The appearance of an upward-facing triangle indicates that the ATR MACD histogram also triggers the condition, aiming to serve as a filtering mechanism.
我在經典的macd作爲條件的同時 也加入了之前開發的ATR-MACD作爲過濾信號 出現朝上的三角圖示代表ATR MACD的柱狀圖一樣觸發條件 希望可以以此起到過濾的作用
Asset/Usage Instructions:
使用標的/使用説明
Through backtesting, it's found that it's not suitable for smaller time frames as there's a lot of noise. It's recommended to use it in assets with a long-term bullish view, focusing on time frames of 12 hours or longer such as 12H, 16H, 1D, 1W to find spot buying opportunities.
經過回測發現 并不適用與一些小級別時區 噪音會非常多,建議在一些長期看漲的標的中切入12小時以上的時區如12H,16H, 1D, 1W 中間尋找現貨買入的機會。
A few thoughts:
Overall, it's a very good indicator strategy for spot buying in the physical market. Thanks to member kr陳 for sharing!
一些小感言 綜合來看是一個針對現貨買入非常好的指標策略,感謝群友kr陳的分享!
Skrypt open-source
W zgodzie z duchem TradingView twórca tego skryptu udostępnił go jako open-source, aby użytkownicy mogli przejrzeć i zweryfikować jego działanie. Ukłony dla autora. Korzystanie jest bezpłatne, jednak ponowna publikacja kodu podlega naszym Zasadom serwisu.
Wyłączenie odpowiedzialności
Informacje i publikacje nie stanowią i nie powinny być traktowane jako porady finansowe, inwestycyjne, tradingowe ani jakiekolwiek inne rekomendacje dostarczane lub zatwierdzone przez TradingView. Więcej informacji znajduje się w Warunkach użytkowania.