OPEN-SOURCE SCRIPT
3 EMA/SMA + Colored Candles[C2Trends]
// Indicator Features:
// 1) 3 Exponential Moving Averages and 3 Simple Moving Averages.
// 2) Additional EMA input for colored candles(EMA is hidden from chart, input used for coloring of candles only)
// 3) Turn colored candles on/off from main input tab of indicator settings.
// 4) Turn SMA's and EMA's on/off from main input tab of indicator settings.
// 5) Select single color or 2 color EMA and SMA lines from main input tab of indicator settings.
// Indicator Notes:
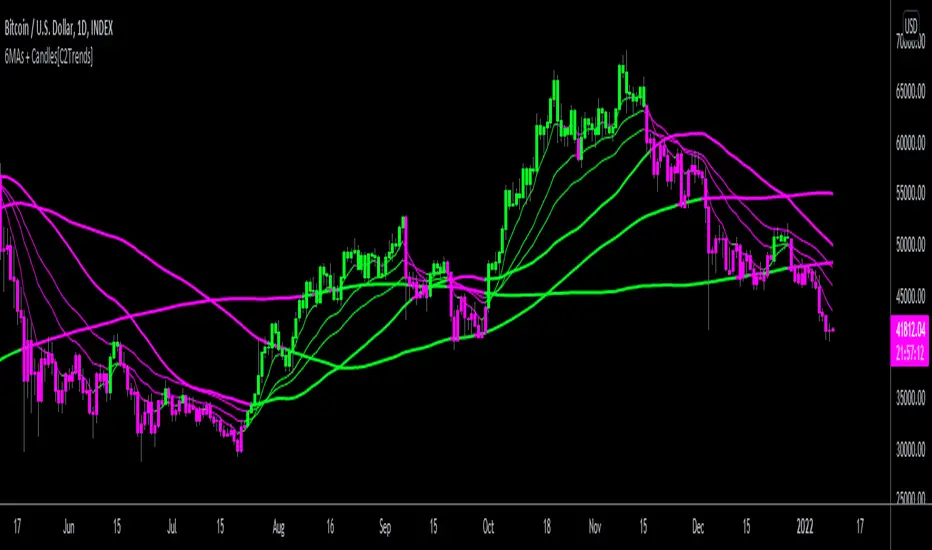
// 1) 'Candle EMA' input is the trend lookback period for the price candle colors. When price is above desired Candle EMA, price candles will color green. When price is below the Candle EMA, price candles will color fuchsia.
// 2) If you are using another indicator that colors the price candles it may overlap the candle colors applied by this indicator. Trying hiding or removing other indicators to troubleshoot if having candle color issues.
// 3) Using 2-color price moving averages: when price is above an average the average will color green, when price is below an average the average will color fuchsia.
// 1) 3 Exponential Moving Averages and 3 Simple Moving Averages.
// 2) Additional EMA input for colored candles(EMA is hidden from chart, input used for coloring of candles only)
// 3) Turn colored candles on/off from main input tab of indicator settings.
// 4) Turn SMA's and EMA's on/off from main input tab of indicator settings.
// 5) Select single color or 2 color EMA and SMA lines from main input tab of indicator settings.
// Indicator Notes:
// 1) 'Candle EMA' input is the trend lookback period for the price candle colors. When price is above desired Candle EMA, price candles will color green. When price is below the Candle EMA, price candles will color fuchsia.
// 2) If you are using another indicator that colors the price candles it may overlap the candle colors applied by this indicator. Trying hiding or removing other indicators to troubleshoot if having candle color issues.
// 3) Using 2-color price moving averages: when price is above an average the average will color green, when price is below an average the average will color fuchsia.
Skrypt open-source
W zgodzie z duchem TradingView twórca tego skryptu udostępnił go jako open-source, aby użytkownicy mogli przejrzeć i zweryfikować jego działanie. Ukłony dla autora. Korzystanie jest bezpłatne, jednak ponowna publikacja kodu podlega naszym Zasadom serwisu.
Wyłączenie odpowiedzialności
Informacje i publikacje nie stanowią i nie powinny być traktowane jako porady finansowe, inwestycyjne, tradingowe ani jakiekolwiek inne rekomendacje dostarczane lub zatwierdzone przez TradingView. Więcej informacji znajduje się w Warunkach użytkowania.