INVITE-ONLY SCRIPT
Implied Volatility Walls
The Implied Volatility Walls (IVW) indicator is a powerful and advanced trading tool designed to help traders identify key market zones where price may encounter significant resistance or support based on volatility. Using implied volatility, historical volatility, and machine learning models, IVW provides traders with a comprehensive understanding of market dynamics. This indicator is especially useful for those who wish to forecast volatility-driven price movements and adjust their trading strategies accordingly.
How the Implied Volatility Walls (IVW) Works:
The Implied Volatility Walls (IVW) indicator uses a combination of historical price data and advanced machine learning algorithms to calculate key volatility levels and forecast future market conditions. It tracks cumulative volatility, identifies support and resistance zones, and detects liquidation bubbles to highlight critical price areas.
The main concept behind this tool is that price tends to move most of the time by the same amount, making it possible to average the past maximum excursion in order to obtain a validated area where traders can be able to see clearly that the price is moving more than normal.
This indicator primarily focuses on:
1. Volatility Zones: Potential support and resistance levels based on implied and historical volatility.
2. Machine Learning Volatility Forecast: A machine learning model that predicts high, medium, or low volatility for future market conditions.
3. Liquidation Detection: Highlights key areas of potential forced liquidations, where market participants may be forced out of their positions, often leading to significant price movements.
4. Backtesting and Win Rate: The indicator continuously monitors how effective its volatility-based predictions are, offering insights into the performance of its predictions.
Key Features:
1. Volatility Tracking:
- The IVW indicator calculates cumulative volatility by analyzing the range between the high and low prices over time. It also tracks volatility percentiles and separates the market conditions into high, medium, or low volatility zones, enabling traders to gauge how volatile the market is.
2. Volatility Walls (Upper and Lower Zones):
- Upper Volatility Wall (Red Zones): Represent resistance levels where the price might encounter difficulty moving higher due to excess in volatility. This zone is calculated based on the chosen percentile in the settings.
- Lower Volatility Wall (Blue Zones): Represent support levels where price may find buying support.
- These walls help traders visualize potential zones where reversals or breakouts could occur based on volatility conditions.
3. Machine Learning Forecast:
- One of the standout features of the IVW indicator is its machine learning algorithm that estimates future volatility levels. It categorizes volatility into high, medium, and low based on recent data and provides forecasts on what the next market condition is likely to be.
- This forecast helps traders anticipate market conditions and adapt their strategies accordingly. It is displayed on the chart as "Exp. Vol", providing insight into the future expected volatility.
4. VIX Adjustments:
- The indicator can be adjusted using the well-known **VIX (Volatility Index)** to further refine its volatility predictions. This enables traders to incorporate market sentiment into their analysis, improving the accuracy of the predictions for different market conditions.
5. Liquidation Bubbles:
- The Liquidation Bubbles feature highlights areas where large forced selling or buying events may occur, which are usually accompanied by spikes in volatility and volume. These bubbles appear when price deviates significantly from moving averages with substantial volume increases, alerting traders to potential volatile moves.
- Red dots indicate likely forced liquidations on the upside, and blue dots indicate forced liquidations on the downside. These bubbles can help traders spot moments of market stress and potential price swings due to liquidations.
6. Dynamic Volatility Zones:
- IVW dynamically adjusts support and resistance levels as market conditions evolve. This allows traders to always have up-to-date and relevant information based on the latest volatility patterns.
7. Cumulative Volatility Histogram:
- At the bottom of the chart, the purple histogram represents cumulative volatility over time, giving traders a visual cue of whether volatility is building up or subsiding. This can provide early signals of market transitions from low to high volatility, aiding traders in timing their entries and exits more accurately.
8. Backtesting and Win Rate:
- The IVW indicator includes a backtesting function that monitors the success of its volatility predictions over a selected period. It shows a Win Rate (WR) percentage (with 33% meaning that the machine learning algorithm does not bring any edge), representing how often the indicator's predictions were correct. This metric is crucial for assessing the reliability of the model’s forecasts.
9. Opening Range:
- At the beginning of a new session, the indicator will plot two lines indicating the high and the low of the first candle of the new time frame chosen.
Chart Breakdown:
Below is a description of what users see when using the Implied Volatility Walls (IVW) indicator on the chart:
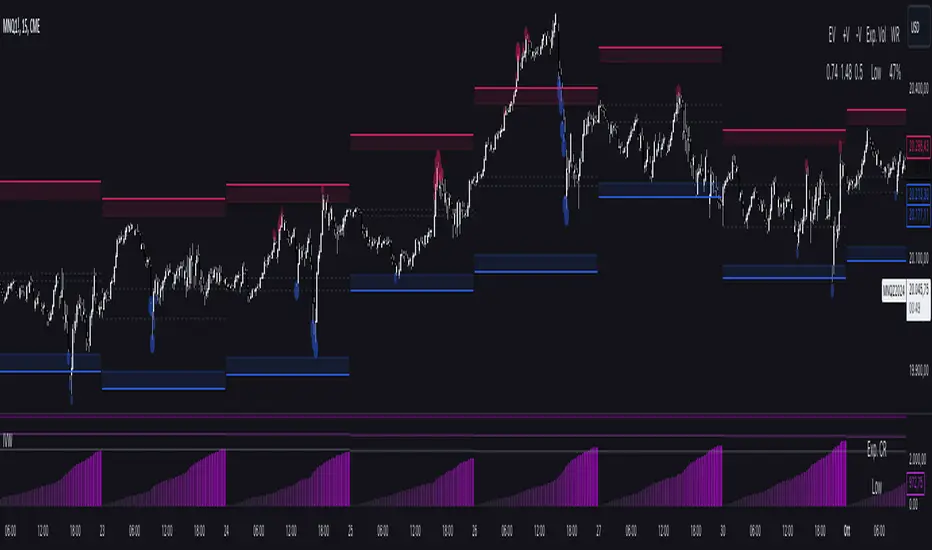
Volatility Walls:
- Red shaded zones at the top represent upper volatility walls (resistance zones), while blue shaded zones at the bottom represent lower volatility walls (support zones). These areas show where price is likely to react due to high or low volatility conditions.
Liquidation Bubbles:
- Red and blue dots plotted above and below the price represent **liquidation bubbles**, indicating moments of market stress where volatility and volume spikes may force market participants to exit positions.
Cumulative Volatility Histogram:
- The purple histogram at the bottom of the chart reflects the buildup of cumulative volatility over time. Higher bars suggest increased volatility, signaling the potential for large price movements, while smaller bars represent calmer market conditions.
Real-Time Support and Resistance Levels:
- Solid and dashed lines represent current and historical support and resistance levels, helping traders identify price zones that have historically acted as volatility-driven turning points.
Gradient Bar Colors:
- The price bars change color based on their proximity to the volatility walls, with different colors representing how close the price is to these key levels. This color gradient provides a quick visual cue of potential market turning points.
Data Tables Explained:
Table 1: **Volatility Information Table (Top Right Corner):
- EV: Expected Volatility (based on the VIX FIX calculation from Larry Williams).
- +V and -V: Represents the adjusted volatility for upward (+V) and downward (-V) movements.
- Exp. Vol: Shows the expected volatility condition for the next period (High, Medium, or Low) based on the machine learning algorithm.
- WR: The Win Rate based on the backtesting of previous volatility predictions (three outcomes, so base Win rate is 33%, and not 50%).
Table 2: Expected Cumulative Range (Top Right Corner of the separated pane):
- Exp. CR: Expected Cumulative Range based on a machine learning algorithm that calculate the most likely outcome (cumulative range) based on the past days and metrics.
How to Use the Indicator:
1. Identify Key Support and Resistance Levels:
- Use the upper (red) and lower (blue) volatility walls to identify zones where the price is likely to face resistance or support due to volatility dynamics.
2. Forecast Future Volatility:
- Pay attention to the Expected Vol field in the table to understand whether the machine learning model predicts high, medium, or low volatility for the next trading session.
3. Monitor Liquidation Bubbles:
- Watch for red and blue bubbles as they can signal significant market events where volatility and volume spikes may lead to sudden price reversals or continuations.
4. Use the Histogram to Gauge Market Conditions:
- The cumulative volatility histogram shows whether the market is entering a high or low volatility phase, helping you adjust your risk accordingly and making you able to identify the potential of the rest of the chosen session.
5. Backtesting Confidence:
- The Win Rate (WR) provides insight into how reliable the indicator’s predictions have been over the backtested period, giving you additional confidence in its future forecasts, remember that considering the 3 scenarios possible (high volatility, medium and low volatility), the standard win rate is 33%, and not 50%!.
Final Notes:
The Implied Volatility Walls (IVW) indicator is a powerful tool for volatility-based analysis, providing traders with real-time data on potential support and resistance levels, liquidation bubbles, and future market conditions. By leveraging a machine learning model for volatility forecasting, this tool helps traders stay ahead of the market’s volatility patterns and make informed decisions.
Disclaimer: This tool is for educational purposes only and should not be solely relied upon for trading decisions. Always perform your own research and risk management when trading.
How the Implied Volatility Walls (IVW) Works:
The Implied Volatility Walls (IVW) indicator uses a combination of historical price data and advanced machine learning algorithms to calculate key volatility levels and forecast future market conditions. It tracks cumulative volatility, identifies support and resistance zones, and detects liquidation bubbles to highlight critical price areas.
The main concept behind this tool is that price tends to move most of the time by the same amount, making it possible to average the past maximum excursion in order to obtain a validated area where traders can be able to see clearly that the price is moving more than normal.
This indicator primarily focuses on:
1. Volatility Zones: Potential support and resistance levels based on implied and historical volatility.
2. Machine Learning Volatility Forecast: A machine learning model that predicts high, medium, or low volatility for future market conditions.
3. Liquidation Detection: Highlights key areas of potential forced liquidations, where market participants may be forced out of their positions, often leading to significant price movements.
4. Backtesting and Win Rate: The indicator continuously monitors how effective its volatility-based predictions are, offering insights into the performance of its predictions.
Key Features:
1. Volatility Tracking:
- The IVW indicator calculates cumulative volatility by analyzing the range between the high and low prices over time. It also tracks volatility percentiles and separates the market conditions into high, medium, or low volatility zones, enabling traders to gauge how volatile the market is.
2. Volatility Walls (Upper and Lower Zones):
- Upper Volatility Wall (Red Zones): Represent resistance levels where the price might encounter difficulty moving higher due to excess in volatility. This zone is calculated based on the chosen percentile in the settings.
- Lower Volatility Wall (Blue Zones): Represent support levels where price may find buying support.
- These walls help traders visualize potential zones where reversals or breakouts could occur based on volatility conditions.
3. Machine Learning Forecast:
- One of the standout features of the IVW indicator is its machine learning algorithm that estimates future volatility levels. It categorizes volatility into high, medium, and low based on recent data and provides forecasts on what the next market condition is likely to be.
- This forecast helps traders anticipate market conditions and adapt their strategies accordingly. It is displayed on the chart as "Exp. Vol", providing insight into the future expected volatility.
4. VIX Adjustments:
- The indicator can be adjusted using the well-known **VIX (Volatility Index)** to further refine its volatility predictions. This enables traders to incorporate market sentiment into their analysis, improving the accuracy of the predictions for different market conditions.
5. Liquidation Bubbles:
- The Liquidation Bubbles feature highlights areas where large forced selling or buying events may occur, which are usually accompanied by spikes in volatility and volume. These bubbles appear when price deviates significantly from moving averages with substantial volume increases, alerting traders to potential volatile moves.
- Red dots indicate likely forced liquidations on the upside, and blue dots indicate forced liquidations on the downside. These bubbles can help traders spot moments of market stress and potential price swings due to liquidations.
6. Dynamic Volatility Zones:
- IVW dynamically adjusts support and resistance levels as market conditions evolve. This allows traders to always have up-to-date and relevant information based on the latest volatility patterns.
7. Cumulative Volatility Histogram:
- At the bottom of the chart, the purple histogram represents cumulative volatility over time, giving traders a visual cue of whether volatility is building up or subsiding. This can provide early signals of market transitions from low to high volatility, aiding traders in timing their entries and exits more accurately.
8. Backtesting and Win Rate:
- The IVW indicator includes a backtesting function that monitors the success of its volatility predictions over a selected period. It shows a Win Rate (WR) percentage (with 33% meaning that the machine learning algorithm does not bring any edge), representing how often the indicator's predictions were correct. This metric is crucial for assessing the reliability of the model’s forecasts.
9. Opening Range:
- At the beginning of a new session, the indicator will plot two lines indicating the high and the low of the first candle of the new time frame chosen.
Chart Breakdown:
Below is a description of what users see when using the Implied Volatility Walls (IVW) indicator on the chart:
Volatility Walls:
- Red shaded zones at the top represent upper volatility walls (resistance zones), while blue shaded zones at the bottom represent lower volatility walls (support zones). These areas show where price is likely to react due to high or low volatility conditions.
Liquidation Bubbles:
- Red and blue dots plotted above and below the price represent **liquidation bubbles**, indicating moments of market stress where volatility and volume spikes may force market participants to exit positions.
Cumulative Volatility Histogram:
- The purple histogram at the bottom of the chart reflects the buildup of cumulative volatility over time. Higher bars suggest increased volatility, signaling the potential for large price movements, while smaller bars represent calmer market conditions.
Real-Time Support and Resistance Levels:
- Solid and dashed lines represent current and historical support and resistance levels, helping traders identify price zones that have historically acted as volatility-driven turning points.
Gradient Bar Colors:
- The price bars change color based on their proximity to the volatility walls, with different colors representing how close the price is to these key levels. This color gradient provides a quick visual cue of potential market turning points.
Data Tables Explained:
Table 1: **Volatility Information Table (Top Right Corner):
- EV: Expected Volatility (based on the VIX FIX calculation from Larry Williams).
- +V and -V: Represents the adjusted volatility for upward (+V) and downward (-V) movements.
- Exp. Vol: Shows the expected volatility condition for the next period (High, Medium, or Low) based on the machine learning algorithm.
- WR: The Win Rate based on the backtesting of previous volatility predictions (three outcomes, so base Win rate is 33%, and not 50%).
Table 2: Expected Cumulative Range (Top Right Corner of the separated pane):
- Exp. CR: Expected Cumulative Range based on a machine learning algorithm that calculate the most likely outcome (cumulative range) based on the past days and metrics.
How to Use the Indicator:
1. Identify Key Support and Resistance Levels:
- Use the upper (red) and lower (blue) volatility walls to identify zones where the price is likely to face resistance or support due to volatility dynamics.
2. Forecast Future Volatility:
- Pay attention to the Expected Vol field in the table to understand whether the machine learning model predicts high, medium, or low volatility for the next trading session.
3. Monitor Liquidation Bubbles:
- Watch for red and blue bubbles as they can signal significant market events where volatility and volume spikes may lead to sudden price reversals or continuations.
4. Use the Histogram to Gauge Market Conditions:
- The cumulative volatility histogram shows whether the market is entering a high or low volatility phase, helping you adjust your risk accordingly and making you able to identify the potential of the rest of the chosen session.
5. Backtesting Confidence:
- The Win Rate (WR) provides insight into how reliable the indicator’s predictions have been over the backtested period, giving you additional confidence in its future forecasts, remember that considering the 3 scenarios possible (high volatility, medium and low volatility), the standard win rate is 33%, and not 50%!.
Final Notes:
The Implied Volatility Walls (IVW) indicator is a powerful tool for volatility-based analysis, providing traders with real-time data on potential support and resistance levels, liquidation bubbles, and future market conditions. By leveraging a machine learning model for volatility forecasting, this tool helps traders stay ahead of the market’s volatility patterns and make informed decisions.
Disclaimer: This tool is for educational purposes only and should not be solely relied upon for trading decisions. Always perform your own research and risk management when trading.
Skrypt tylko na zaproszenie
Dostęp do tego skryptu mają tylko użytkownicy upoważnieni przez autora i zazwyczaj wiąże się z opłatą. Możesz dodać go do ulubionych, ale będziesz mógł z niego korzystać dopiero po uzyskaniu zgody jego autora. Skontaktuj się z OmegaTools po więcej informacji lub postępuj zgodnie z instrukcjami autora poniżej.
TradingView nie sugeruje płacenia za skrypt i korzystania z niego, jeśli nie ufasz w 100% jego autorowi i nie rozumiesz, jak działa skrypt. W wielu przypadkach możesz znaleźć dobrą alternatywę open-source za darmo w naszych Skryptach Społeczności.
Instrukcje autora
″In order to access this and other powerful softwares, please visit: https://www.patreon.com/OmegaTools/shop
Chcesz użyć tego skryptu na wykresie?
Ostrzeżenie: przeczytaj to zanim poprosisz o dostęp.
Wyłączenie odpowiedzialności
Informacje i publikacje przygotowane przez TradingView lub jego użytkowników, prezentowane na tej stronie, nie stanowią rekomendacji ani porad handlowych, inwestycyjnych i finansowych i nie powinny być w ten sposób traktowane ani wykorzystywane. Więcej informacji na ten temat znajdziesz w naszym Regulaminie.