OPEN-SOURCE SCRIPT
Volume Liqidations [EagleVSniper]
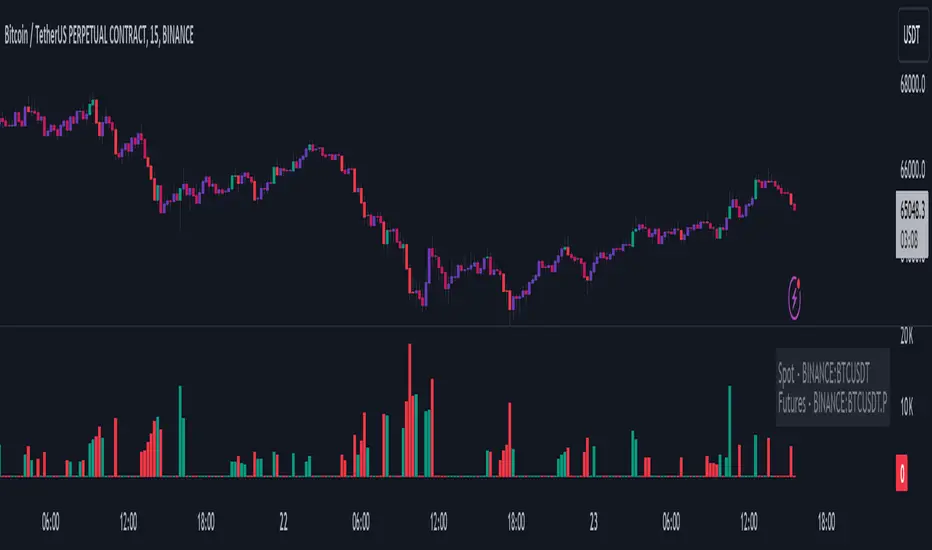
The Volume Liquidations Indicator is designed for traders who want to spot significant liquidation events in the cryptocurrency markets, particularly between spot and futures volumes. This powerful tool auto-detects the trading asset and compares the volume data from both spot and futures markets to highlight potential high-volume liquidation points that can significantly impact price movement. Raw source code owner - tartigradia
Features:
How to Use:
Features:
- Auto-Detect Functionality: Automatically identifies the current trading asset, providing an option for manual selection for both spot and futures symbols.
- Volume Comparison: Calculates the difference between futures and spot volumes within a user-defined timeframe, helping to identify liquidation events.
- Customizable Parameters: Offers customizable options for multipliers, lookback periods, and timeframe selection to tailor the indicator to your trading strategy.
- Visual Indicators: Displays liquidation volumes as color-coded columns, with green indicating potential long liquidations and red for short liquidations. It also highlights bars that exceed the high-volume threshold, providing a clear visual cue for significant liquidation events.
- Spot and Futures Volume MA: Includes optional moving average plots for both spot and futures volumes, allowing for a deeper analysis of market trends.
- Highlighting High-Volatility Candles: The indicator uniquely colors candles that reach a predefined volatility threshold, determined by the user-set multiplier. This functionality aims to spotlight moments of significant market volatility, providing traders with immediate visual cues.
- Dynamic Ticker Selection: Seamlessly switches between auto and manual ticker selection, providing flexibility for all types of traders.
How to Use:
- Setup: Configure the indicator to your preferences. You can choose between automatic or manual ticker selection, set the multiplier for the high-volume threshold, and define the lookback period for the moving average calculation.
- Analysis: The indicator plots differences in volume between futures and spot markets as columns on your chart, color-coded to indicate the direction of potential liquidations.
- Decision Making: Use the indicator to identify potential liquidation events. High-volume thresholds are highlighted, suggesting significant market movements. Combine this information with other analysis tools to make informed trading decisions.
Skrypt open-source
W zgodzie z duchem TradingView twórca tego skryptu udostępnił go jako open-source, aby użytkownicy mogli przejrzeć i zweryfikować jego działanie. Ukłony dla autora. Korzystanie jest bezpłatne, jednak ponowna publikacja kodu podlega naszym Zasadom serwisu.
Wyłączenie odpowiedzialności
Informacje i publikacje nie stanowią i nie powinny być traktowane jako porady finansowe, inwestycyjne, tradingowe ani jakiekolwiek inne rekomendacje dostarczane lub zatwierdzone przez TradingView. Więcej informacji znajduje się w Warunkach użytkowania.