OPEN-SOURCE SCRIPT
VDVA - Volume Delta Volatility Amplifier
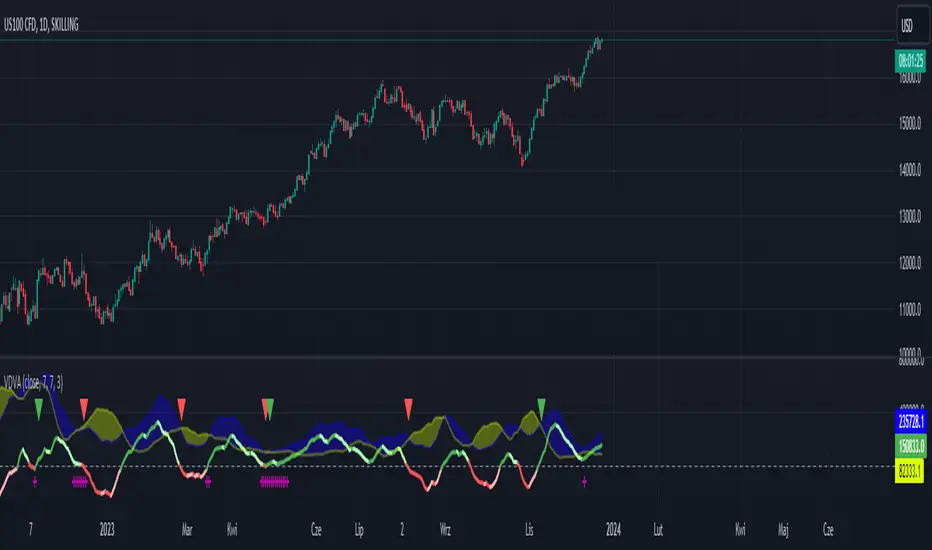
This script defines an indicator named VDVA (Volume Delta Volatility Amplifier), which combines volume delta (the difference between volume up and volume down) and volatility (ATR) into one line. This line is then smoothed using a moving average and compared with the zero level and a shorter-period moving average. The script also plots shapes when the rate of change of the line exceeds the first standard deviation. Moreover, the script uses Bollinger Bands and Keltner Channels to determine the squeeze condition, which is a signal of a potential breakout. Finally, the script plots two bar charts that show the volume up and volume down multiplied by ATR.
dark green line - bullish
light green line - potential bearish
dark red line - bearish
light red line - potential bullish
blue cloud - bullish
yellow cloud - bearish
red triangle - bearish entry
green triangle - bullish entry
purple cross - squeeze
dark green line - bullish
light green line - potential bearish
dark red line - bearish
light red line - potential bullish
blue cloud - bullish
yellow cloud - bearish
red triangle - bearish entry
green triangle - bullish entry
purple cross - squeeze
Skrypt open-source
W zgodzie z duchem TradingView twórca tego skryptu udostępnił go jako open-source, aby użytkownicy mogli przejrzeć i zweryfikować jego działanie. Ukłony dla autora. Korzystanie jest bezpłatne, jednak ponowna publikacja kodu podlega naszym Zasadom serwisu.
Wyłączenie odpowiedzialności
Informacje i publikacje nie stanowią i nie powinny być traktowane jako porady finansowe, inwestycyjne, tradingowe ani jakiekolwiek inne rekomendacje dostarczane lub zatwierdzone przez TradingView. Więcej informacji znajduje się w Warunkach użytkowania.