OPEN-SOURCE SCRIPT
Zaktualizowano Multiple Bollinger Bands + Volatility [AlgoTraderPro]

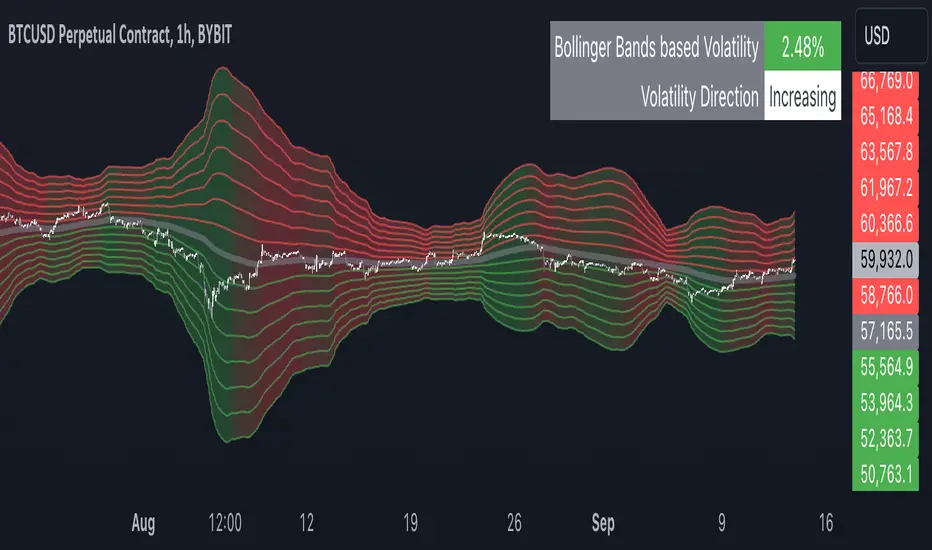
This indicator helps traders visualize price ranges and volatility changes. Designed to assist in identifying potential consolidation zones, the indicator uses multiple layers of Bollinger Bands combined with volatility-based shading. This can help traders spot periods of reduced price movement, which are often followed by breakouts or trend reversals.
█ FEATURES
█ HOW TO USE
█ NOTES
• The indicator is useful in consolidating markets where price movement is limited, offering insights into potential breakout areas.
• Adjust the settings based on asset and market conditions for optimal results.
█ FEATURES
- Multiple Bollinger Bands: Displays up to seven bands with customizable standard deviations, providing a layered view of price range activity.
- Volatility Measurement: Tracks changes in Bollinger Band width to display volatility percentage and direction (increasing, decreasing, or neutral).
- Volatility Shading: Uses color-coded shading between the outermost bands to indicate changes in volatility, helping to visualize potential consolidation zones.
- Customizable Inputs: Modify lookback periods, moving average lengths, and standard deviations for each band to tailor the analysis to your strategy.
- Volatility Table: Displays a table on the chart showing real-time volatility data and direction for quick reference.
█ HOW TO USE
- Add the Indicator: Apply it to your TradingView chart.
- Adjust Settings: Customize the Bollinger Bands’ parameters to suit your trading timeframe and strategy.
- Analyze Consolidation Zones: Use the multiple bands and volatility shading to identify areas of reduced price activity, signaling potential breakouts.
- Monitor Volatility: Refer to the volatility table to track real-time shifts in market volatility.
- Use in Different Markets: Adapt the settings for various assets and timeframes to assess market conditions effectively.
█ NOTES
• The indicator is useful in consolidating markets where price movement is limited, offering insights into potential breakout areas.
• Adjust the settings based on asset and market conditions for optimal results.
Informacje o Wersji
Bug fixes.Informacje o Wersji
Minor fixes.Skrypt open-source
W zgodzie z duchem TradingView twórca tego skryptu udostępnił go jako open-source, aby użytkownicy mogli przejrzeć i zweryfikować jego działanie. Ukłony dla autora. Korzystanie jest bezpłatne, jednak ponowna publikacja kodu podlega naszym Zasadom serwisu.
Trade Smarter, Not Harder!
TradeCreator9
algotraderpro.io/tradecreator9/
TradeCreator9
algotraderpro.io/tradecreator9/
Wyłączenie odpowiedzialności
Informacje i publikacje nie stanowią i nie powinny być traktowane jako porady finansowe, inwestycyjne, tradingowe ani jakiekolwiek inne rekomendacje dostarczane lub zatwierdzone przez TradingView. Więcej informacji znajduje się w Warunkach użytkowania.
Skrypt open-source
W zgodzie z duchem TradingView twórca tego skryptu udostępnił go jako open-source, aby użytkownicy mogli przejrzeć i zweryfikować jego działanie. Ukłony dla autora. Korzystanie jest bezpłatne, jednak ponowna publikacja kodu podlega naszym Zasadom serwisu.
Trade Smarter, Not Harder!
TradeCreator9
algotraderpro.io/tradecreator9/
TradeCreator9
algotraderpro.io/tradecreator9/
Wyłączenie odpowiedzialności
Informacje i publikacje nie stanowią i nie powinny być traktowane jako porady finansowe, inwestycyjne, tradingowe ani jakiekolwiek inne rekomendacje dostarczane lub zatwierdzone przez TradingView. Więcej informacji znajduje się w Warunkach użytkowania.