Buy and Sell with Master_in_chart-ind. [V1]
The targets are defined by Risk to Reward ratios 1:1, 1:1.5 and 1:2.
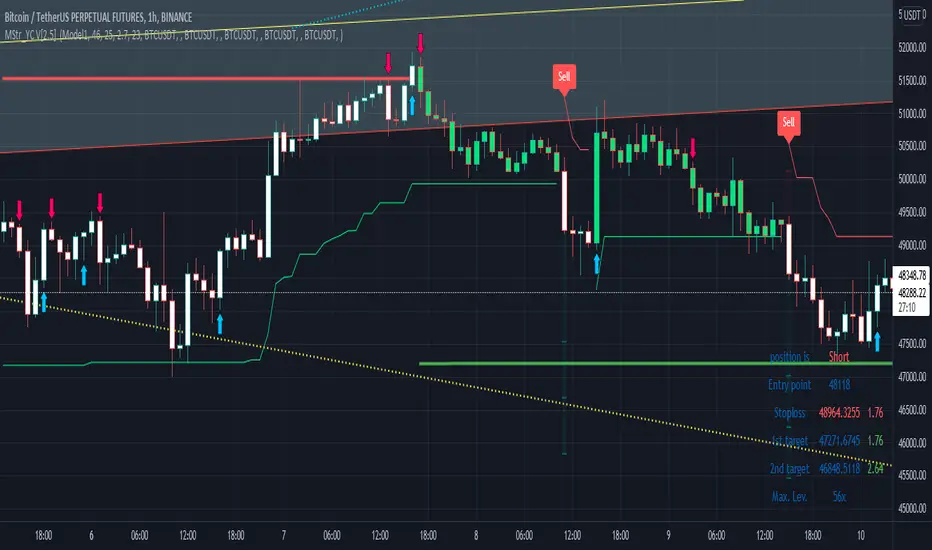
the labels appears when the all conditions are satisfied.
Interesting part of the script is the alert function. Here one can set the script for different
securities and activate alert in TV.
In summary, one can change and tune the setting of the indicator easily by clicking on the gear icon. In the setting, there are four sections. First section sets the slop-loss. Second section activates and shows the super trend indicator. Third section is designed to tune the signals. Finally, you can apply the script on five different symbols at different time-frames. Here you can set alarm to alert you the signals.
I hope you enjoy it!
- Stop loss formula is modified
- circles are added to indicate Buy/Sell warnings
- Alerts are modified
- The functionality of indicator improved.
- Initial indication (suggestion) is promoted
- Initial indication illustrated by up/down arrows
- Input source is modified
- Super Trend in higher time-frame is available now. There fore one can easily compare the trend in current time-frame and higher time-frame. By turning on this option, one can have an appropriate perspective on the trend.
- the same idea applied by coloring candles. I mean that candles are colored in red and green while the super trends in different time-frames are in a same color respectively. if their colors differ, then the candles are in white.
- A new model applied to modify the stop loss and signal labels
- Setting panel is organized
- pivot point forecast option is added. By turning on this option, one can see two vertical lines in green and red that they show the possible position of the pivot points. users are able to change the length directly in the setting
- Now users are able to apply super trend in current time frame and the higher time frame independently.
Skrypt tylko na zaproszenie
Dostęp do tego skryptu mają wyłącznie użytkownicy zatwierdzeni przez autora. Aby z niego korzystać, należy poprosić o zgodę i ją uzyskać. Zgoda jest zazwyczaj udzielana po dokonaniu płatności. Więcej informacji można znaleźć w instrukcjach autora poniżej lub kontaktując się bezpośrednio z master-in-chart.
TradingView NIE zaleca płacenia za skrypt ani korzystania z niego, jeśli nie ma pełnego zaufania do jego autora i nie rozumie się zasad jego działania. Można również znaleźć darmowe, otwartoźródłowe alternatywy w skryptach społeczności.
Instrukcje autora
Wyłączenie odpowiedzialności
Skrypt tylko na zaproszenie
Dostęp do tego skryptu mają wyłącznie użytkownicy zatwierdzeni przez autora. Aby z niego korzystać, należy poprosić o zgodę i ją uzyskać. Zgoda jest zazwyczaj udzielana po dokonaniu płatności. Więcej informacji można znaleźć w instrukcjach autora poniżej lub kontaktując się bezpośrednio z master-in-chart.
TradingView NIE zaleca płacenia za skrypt ani korzystania z niego, jeśli nie ma pełnego zaufania do jego autora i nie rozumie się zasad jego działania. Można również znaleźć darmowe, otwartoźródłowe alternatywy w skryptach społeczności.