INVITE-ONLY SCRIPT
PSWave‴ | Price Spread Wave‴
Zaktualizowano
What does it do?
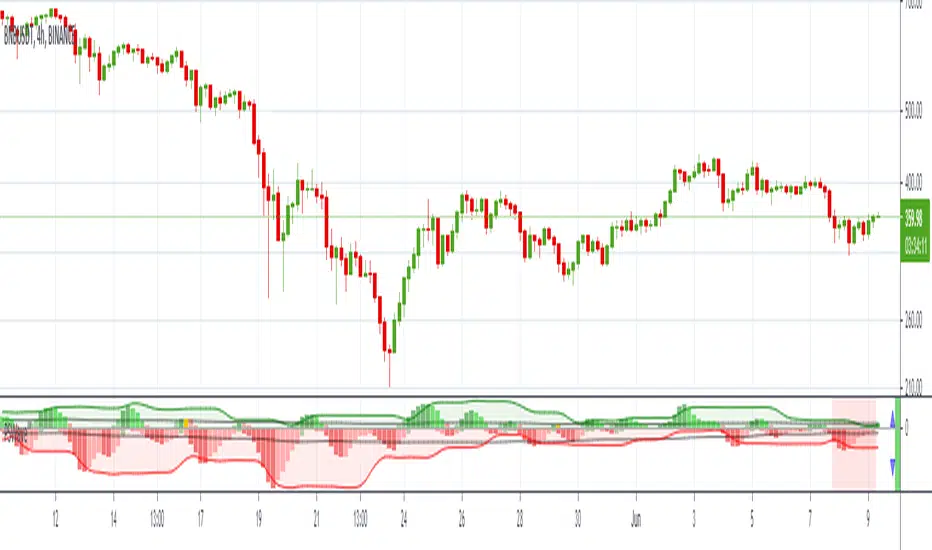
This indicator allows you to identify possible top and bottom reversals by having a prior Spread Price Volume reversal identifiable by positive (top reversal) and negative (bottom reversal) waves.
How does it work?
Everytime the wave starts ending its movement by shrinking the size of the histogram bars, it might be signing that a price reversal is on its way. It is possible to adjust the wave shape by increasing/decreasing its gradient value analysis, but it's so easy to use that most of the times no reconfiguration is needed, just add it and let it guide you.
What's my filling?
I've been testing this indicator for weeks and so far with incredible reversal signals specially if working in conjunction with Volume Wave (VolWave).
Indicator attributes:
- generally waves formation makes a symmetrical arc
- when the second half of a wave is elongated (compared to its first half), it suggests a lack of directional force of the current movement
- peak / bottom formation suggests reversal of the current movement
- smaller amplitude of a wave (compared to the previous wave) suggests loss of power, and vice-verse
- indicates divergence indication between peaks / bottoms
- when the volume bar touches the volume wave band, it suggests imminent reversal of the current movement
- band opening suggests movement increasing strength in that direction
- wavelengths (distance between two peaks / bottoms) tend to be similar
- subsequent wave rarely occurs
Technical information:
- the calculation of the positive movement is independent of the calculation of the positive movement
- the black line in the upper and lower zone is the average of the wave that is overcome, suggests strength in movement
- bands suggest delimitation of a wave's peak / bottom
To have access to this indicator, please DM me.
Don't contact me in the comment area.
Informacje o Wersji
Just Histogram color ajustments to make visibility easier.Informacje o Wersji
Some nice new features:1. now you can choose with color setup you which to see the waves presenting (I like the standard since the other option leads me to misunderstanding signal);
2. light red background presented every time the Volatility is activated in the indicator's timeframe.
Skrypt tylko na zaproszenie
Dostęp do tego skryptu mają tylko użytkownicy upoważnieni przez autora i zazwyczaj wiąże się z opłatą. Możesz dodać go do ulubionych, ale będziesz mógł z niego korzystać dopiero po uzyskaniu zgody jego autora. Skontaktuj się z MarceloTorres po więcej informacji lub postępuj zgodnie z instrukcjami autora poniżej.
TradingView nie sugeruje płacenia za skrypt i korzystania z niego, jeśli nie ufasz w 100% jego autorowi i nie rozumiesz, jak działa skrypt. W wielu przypadkach możesz znaleźć dobrą alternatywę open-source za darmo w naszych Skryptach Społeczności.
Instrukcje autora
″If you wish to now more about this indicator, please DM me.
Do not call me through the comments area.
Chcesz użyć tego skryptu na wykresie?
Ostrzeżenie: przeczytaj to zanim poprosisz o dostęp.
TRADEWISER | Marcelo Torres
marcelo@tradewiser.pro
Vídeo-Análise completa diária no YouTube:
youtube.com/c/TradeWiserPro
Curso/AE
CursoAE.TradeWiser.pro
@TradeWiserPro
Telegram, Twitter, Facebook, LinkedIn, Instagram
marcelo@tradewiser.pro
Vídeo-Análise completa diária no YouTube:
youtube.com/c/TradeWiserPro
Curso/AE
CursoAE.TradeWiser.pro
@TradeWiserPro
Telegram, Twitter, Facebook, LinkedIn, Instagram
Wyłączenie odpowiedzialności
Informacje i publikacje przygotowane przez TradingView lub jego użytkowników, prezentowane na tej stronie, nie stanowią rekomendacji ani porad handlowych, inwestycyjnych i finansowych i nie powinny być w ten sposób traktowane ani wykorzystywane. Więcej informacji na ten temat znajdziesz w naszym Regulaminie.