INVITE-ONLY SCRIPT
[SignalFI] MACD+RSI+MA Trend [V1.0]
Zaktualizowano
Welcome,
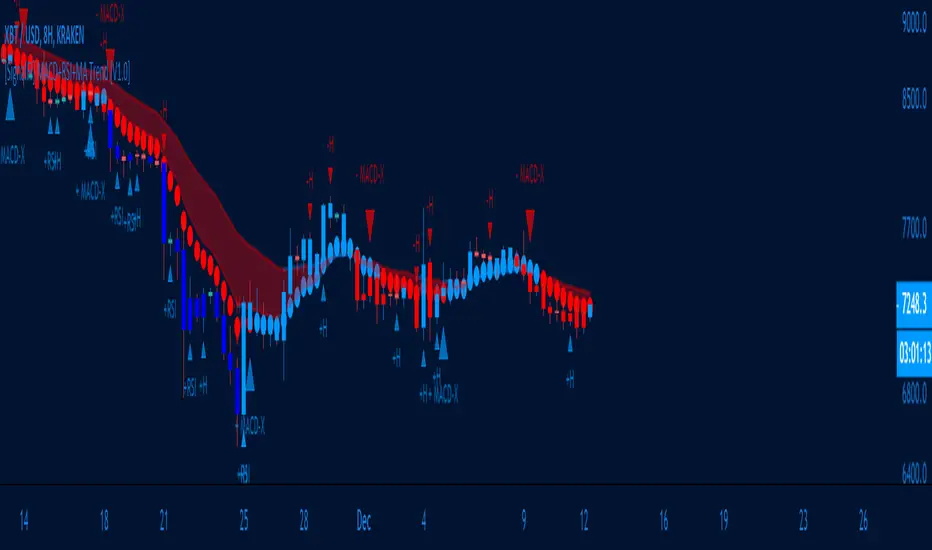
Proud to release a trending analysis tool for looking at the popular strategy of RSI + MACD + 12/26 EMA moving averages. The script is a unified trend script that shows:
- 12/26 EMA Trend
- MACD Crossovers
- MACD Histogram Pivots
- RSI Overbought (RSI > 70 = White Candles)
- RSI Oversold (RSI < 30 = Deep Blue Candles)
- RSI Pivots
Collectively, this allows you to implement and alert on one of the most popular and widely use strategies, all from one script.
In addition, we've added a third EMA moving average (Default 9 Candle EMA) that represents the MACD signal line on the chart. This line will change color to denote whether the MACD signal line is rising or falling compared to the previous candle (represented by the 'circles trend line' on the graph).
Script is fully alerted:
1) Bull MACD X
2) Bear MACD X
3) MACD Histo Pivot (Bull/Bear)
4) RSI Pivot (Bull/Bear)
5) Signal Line X (Bull/Bear)
Enjoy!
SignalFI was created to help traders and investors to effectively analyze the market based on the Golden Mean Ratio (Fibonacci numbers), plan a trade and ultimately execute it. To help inform and educate market decisions we developed a set of Trading Indicators which are available on TradingView , the most advanced and yet easy to use charting platform available on the web.
SignalFI indicators are just that, indicators. Our indicators are generally configured to use completely historical data (negating repaint), and we advise all alerts created with SignalFI indicators to be fired upon "close" of the current candle. Our indicators can provide valuable context and visualization support when performing market analysis and executing buy and sell decisions. However. we are not financial experts, and all information presented on this site or our other media outlets are for educational purposes only.
For subscription information, visit signalfi.net and follow us on twitter .
Informacje o Wersji
1) Color editsInformacje o Wersji
1) Revert CodeSkrypt tylko na zaproszenie
Dostęp do tego skryptu mają tylko użytkownicy upoważnieni przez autora i zazwyczaj wiąże się z opłatą. Możesz dodać go do ulubionych, ale będziesz mógł z niego korzystać dopiero po uzyskaniu zgody jego autora. Skontaktuj się z SignalFi po więcej informacji lub postępuj zgodnie z instrukcjami autora poniżej.
TradingView nie sugeruje płacenia za skrypt i korzystania z niego, jeśli nie ufasz w 100% jego autorowi i nie rozumiesz, jak działa skrypt. W wielu przypadkach możesz znaleźć dobrą alternatywę open-source za darmo w naszych Skryptach Społeczności.
Instrukcje autora
″
Chcesz użyć tego skryptu na wykresie?
Ostrzeżenie: przeczytaj to zanim poprosisz o dostęp.
SignalFi is creating cutting edge TradingView scripts to help identify rogue market Alpha. Check out signalfi.net for subscription information and @signalfi_ on Twitter for updates.
Wyłączenie odpowiedzialności
Informacje i publikacje przygotowane przez TradingView lub jego użytkowników, prezentowane na tej stronie, nie stanowią rekomendacji ani porad handlowych, inwestycyjnych i finansowych i nie powinny być w ten sposób traktowane ani wykorzystywane. Więcej informacji na ten temat znajdziesz w naszym Regulaminie.