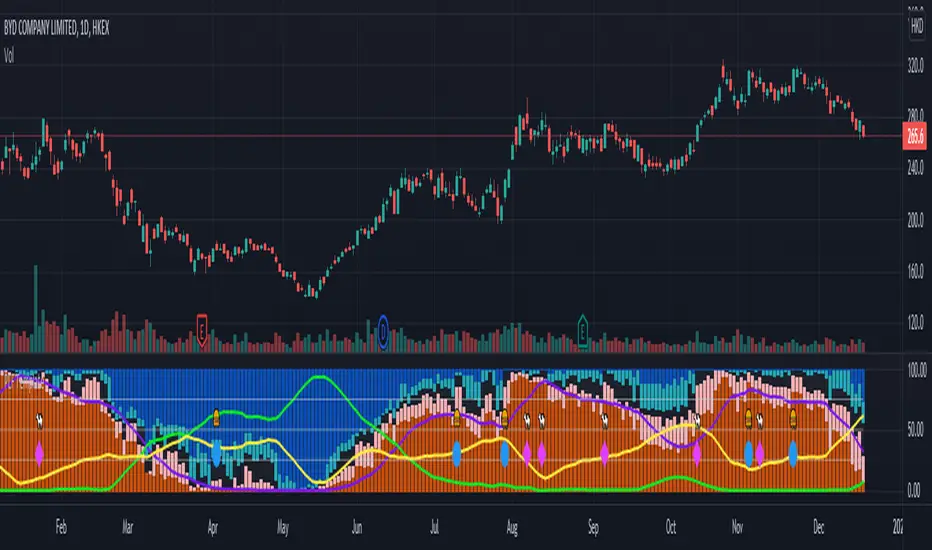
Profit Loss Fund Template ( PLFT / MCDX )

It helps to analyse Institution fund's possible behavior with pool of data derived from price volume movement.
RED bar represents percentage of stock holders are currently in profit.
Purple line is RED bar's moving average.
BLUE bar represents percentage of stock holders are currently in loss.
Green line is BLUE bar's moving average.
RED bar > 50% shows institution fund has in control, uptrend is likely easier to continue.
BLUE bar > 50% shows retailer fund is stucked inside, downtrend is likely easier to continue.
Crossing of moving average lines indicates changing of trend (reversal sign):
1) Purple line up-crossed Green line - UPTREND
2) Green line up-crossed Purple line - DOWNTREND
Skrypt tylko na zaproszenie
Tylko użytkownicy autoryzowani przez autora mają dostęp do tego skryptu, co zazwyczaj wymaga płatności. Możesz dodać skrypt do ulubionych, ale będziesz mógł z niego korzystać dopiero po uzyskaniu zgody autora — więcej informacji tutaj. Aby uzyskać więcej szczegółów, postępuj zgodnie z instrukcjami autora poniżej lub skontaktuj się bezpośrednio z SmartYoloPro.
TradingView NIE zaleca płacenia za skrypt ani jego używania, jeśli nie masz pełnego zaufania do jego autora i nie rozumiesz, jak działa. Możesz także znaleźć darmowe, open-source'owe alternatywy w naszej sekcji skryptów społecznościowych.
Instrukcje autora
Ostrzeżenie: przed złożeniem prośby o dostęp przeczytaj nasz przewodnik dotyczący skryptów dostępnych tylko na zaproszenie.
Wyłączenie odpowiedzialności
Skrypt tylko na zaproszenie
Tylko użytkownicy autoryzowani przez autora mają dostęp do tego skryptu, co zazwyczaj wymaga płatności. Możesz dodać skrypt do ulubionych, ale będziesz mógł z niego korzystać dopiero po uzyskaniu zgody autora — więcej informacji tutaj. Aby uzyskać więcej szczegółów, postępuj zgodnie z instrukcjami autora poniżej lub skontaktuj się bezpośrednio z SmartYoloPro.
TradingView NIE zaleca płacenia za skrypt ani jego używania, jeśli nie masz pełnego zaufania do jego autora i nie rozumiesz, jak działa. Możesz także znaleźć darmowe, open-source'owe alternatywy w naszej sekcji skryptów społecznościowych.
Instrukcje autora
Ostrzeżenie: przed złożeniem prośby o dostęp przeczytaj nasz przewodnik dotyczący skryptów dostępnych tylko na zaproszenie.