INVITE-ONLY SCRIPT
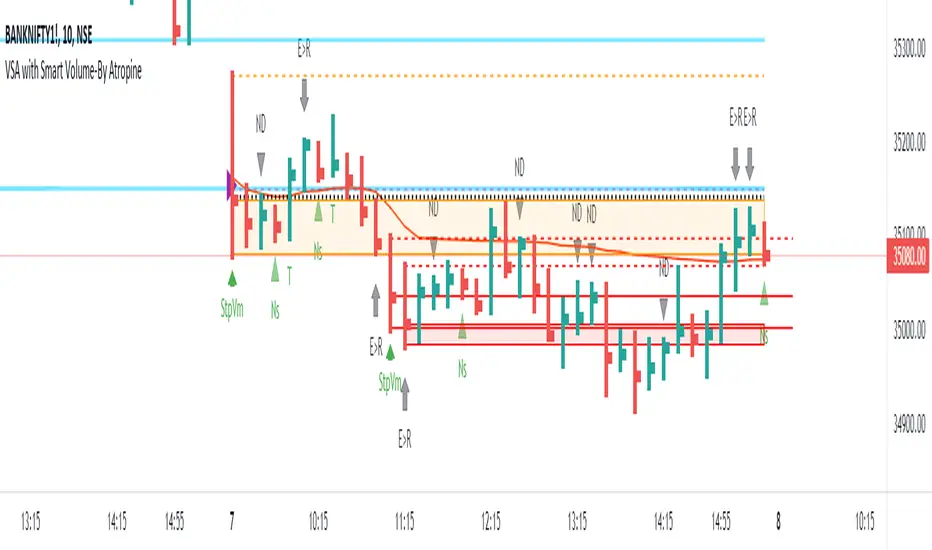
VSA with Smart Volume-Atropine
Zaktualizowano

- Volume spread analysis is a new way of looking at the market. It more like the candlestick analysis taking into consideration the volume . Volume Spread Analysis is one of the most important concepts of technical analysis .
- Volume plays a very important role for traders. It is one of the key movers of the market because the market is mostly moved by fear and greed among the participants. Volume is also important in confirming a trend and chart patterns.
How Does This Indicator Works ?
1. It indicates Strengths and Weakness Signals on the basis of Tom Williams Volume Spread Analysis.
2. It Automatically Draws Potential Zones and you can extend them.
3. It Draws zones over Strength or Weakness Signal for whole session.
4. Gives Options to hide Historical Action to avoid noise over the chart.
5. Shows Cumulative Volume over the Candle to get clear Picture of buyer and seller.
6. It Indicates most important signal of Effort vs Result.
7. Automatically draws zone of High Volume Candle from Higher Time frame.
8. Draws 60min(1Hr) Initial Balance Range.
Informacje o Wersji
(New*) Added Signal Information Function, No any Indicator Available in the Market shows Signal Information like this. This function shows VSA signals Description, Background & Future, by pointing the mouse cursor over the signal.(New*) Added Option to change the text size for Mobile view.
(Optimized) Added option to change the color of Signals and Previous day High & Low and Current day Open.
(Optimized) Signals for Higher Timeframe.
(Removed) Initial Balance Range.
Informacje o Wersji
Improved overall performance.Informacje o Wersji
Added Volume Weighted Average Price (VWAP) and Optimized Script Code.Informacje o Wersji
Updated FeaturesInformacje o Wersji
- Improved Overall Performance
Informacje o Wersji
IMPROVED OVERALL PERFORMANCEInformacje o Wersji
Error FixedSkrypt tylko na zaproszenie
Dostęp do tego skryptu mają tylko użytkownicy upoważnieni przez autora i zazwyczaj wiąże się z opłatą. Możesz dodać go do ulubionych, ale będziesz mógł z niego korzystać dopiero po uzyskaniu zgody jego autora. Skontaktuj się z Bharatgawande12 po więcej informacji lub postępuj zgodnie z instrukcjami autora poniżej.
TradingView nie sugeruje płacenia za skrypt i korzystania z niego, jeśli nie ufasz w 100% jego autorowi i nie rozumiesz, jak działa skrypt. W wielu przypadkach możesz znaleźć dobrą alternatywę open-source za darmo w naszych Skryptach Społeczności.
Instrukcje autora
″This is Subscription Based Indicator, You have to Obtain Subscription to Access it, from https://atropine.in
Chcesz użyć tego skryptu na wykresie?
Ostrzeżenie: przeczytaj to zanim poprosisz o dostęp.
Wyłączenie odpowiedzialności
Informacje i publikacje przygotowane przez TradingView lub jego użytkowników, prezentowane na tej stronie, nie stanowią rekomendacji ani porad handlowych, inwestycyjnych i finansowych i nie powinny być w ten sposób traktowane ani wykorzystywane. Więcej informacji na ten temat znajdziesz w naszym Regulaminie.