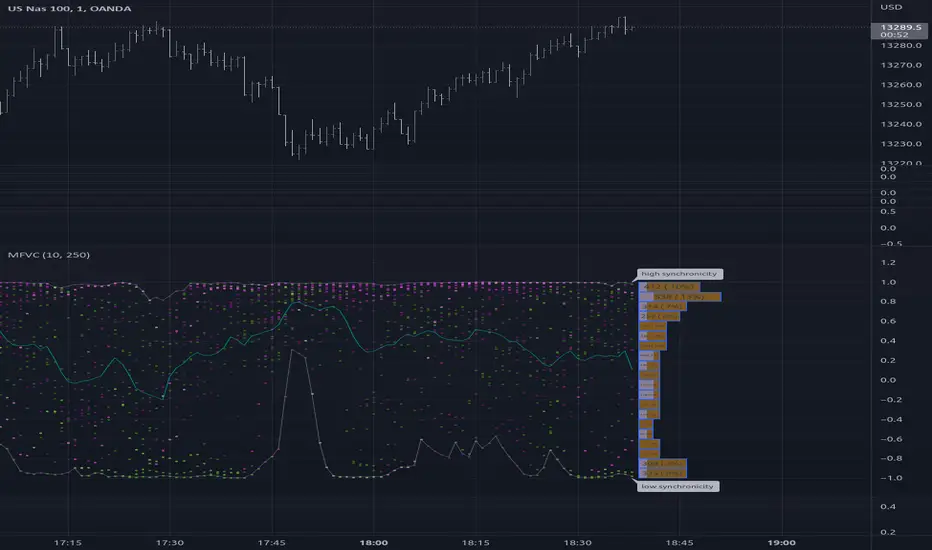
This is a complex indicator that looks to provide some insight into the correlation between volume and price volatility.
Rising volatility is depicted with the color green while falling volatility is depicted with purple.
Lightness of the color is used to depict the length of the window used, darker == shorter in the 2 -> 512 window range.
Rising volatility is depicted with the color green while falling volatility is depicted with purple.
Lightness of the color is used to depict the length of the window used, darker == shorter in the 2 -> 512 window range.
Informacje o Wersji
added a histogram to show last and recent(10 bars) distribution of correlationInformacje o Wersji
updated histogram calculation, it now allows the input length of the aggregation of values, added values display on histogram bars.Informacje o Wersji
added labels with some description.Skrypt open-source
W zgodzie z duchem TradingView twórca tego skryptu udostępnił go jako open-source, aby użytkownicy mogli przejrzeć i zweryfikować jego działanie. Ukłony dla autora. Korzystanie jest bezpłatne, jednak ponowna publikacja kodu podlega naszym Zasadom serwisu.
Wyłączenie odpowiedzialności
Informacje i publikacje nie stanowią i nie powinny być traktowane jako porady finansowe, inwestycyjne, tradingowe ani jakiekolwiek inne rekomendacje dostarczane lub zatwierdzone przez TradingView. Więcej informacji znajduje się w Warunkach użytkowania.
Skrypt open-source
W zgodzie z duchem TradingView twórca tego skryptu udostępnił go jako open-source, aby użytkownicy mogli przejrzeć i zweryfikować jego działanie. Ukłony dla autora. Korzystanie jest bezpłatne, jednak ponowna publikacja kodu podlega naszym Zasadom serwisu.
Wyłączenie odpowiedzialności
Informacje i publikacje nie stanowią i nie powinny być traktowane jako porady finansowe, inwestycyjne, tradingowe ani jakiekolwiek inne rekomendacje dostarczane lub zatwierdzone przez TradingView. Więcej informacji znajduje się w Warunkach użytkowania.