OPEN-SOURCE SCRIPT
Panoramic VWAP
### Panoramic VWAP Indicator Overview
The Panoramic VWAP indicator provides a way to display up to four Volume Weighted Average Price (VWAP) lines on a chart, each anchored to different timeframes. This indicator also includes options for displaying standard deviation bands and close lines, offering a comprehensive view of price action across multiple time horizons.
### Key Features
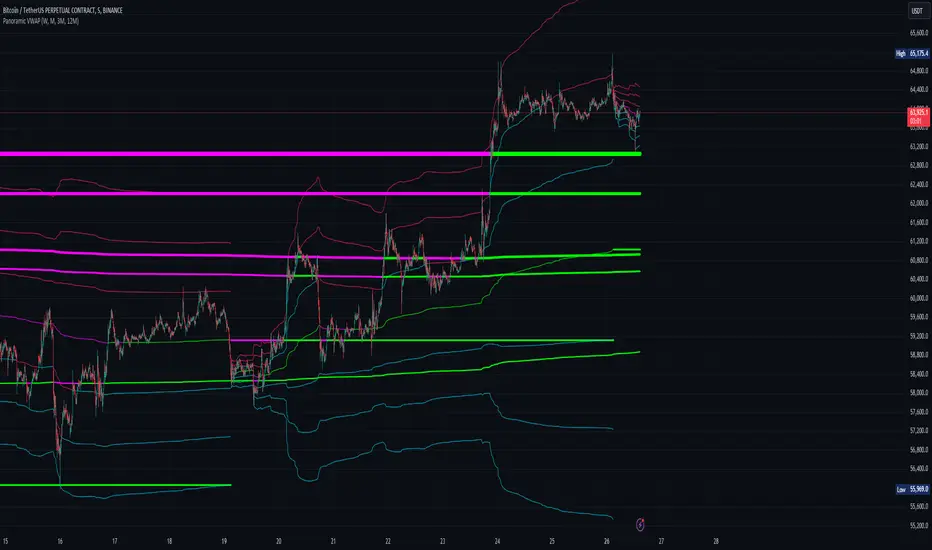
### How It Looks
### How to Use It
### Practical Application
The Panoramic VWAP indicator allows for a detailed analysis of price trends and levels across multiple timeframes, combining VWAPs, standard deviation bands, and close lines in a single, customizable tool.
The Panoramic VWAP indicator provides a way to display up to four Volume Weighted Average Price (VWAP) lines on a chart, each anchored to different timeframes. This indicator also includes options for displaying standard deviation bands and close lines, offering a comprehensive view of price action across multiple time horizons.
### Key Features
- Quad VWAPs: The indicator allows for the display of four VWAP lines simultaneously. Each line can be set to a different timeframe, enabling traders to analyze market conditions across various periods on a single chart.
- Standard Deviation Bands: Users can enable bands around each VWAP line, which represent standard deviations or percentage levels from the VWAP. These bands help in assessing volatility and identifying potential overbought or oversold conditions.
- Close Lines: The indicator includes an option to show close lines, marking the price's closing level relative to the VWAP. This feature is useful for examining how the market closes in relation to VWAP, which can be important for understanding trend strength or potential reversals.
### How It Looks
- VWAP Lines: Multiple VWAP lines are displayed, each reflecting different timeframes. The lines change color depending on whether the price is above or below the VWAP, indicating bullish or bearish momentum.
- Bands: Optional bands around the VWAP lines provide a visual indication of volatility, with the potential to identify overbought or oversold areas.
- Close Lines: These lines represent the price's closing level relative to the VWAP and can be displayed to add further context to the analysis.
### How to Use It
- Trend Analysis:
- Price above a VWAP line indicates bullish momentum.
- Price below a VWAP line suggests bearish momentum. - Support and Resistance:
- VWAP lines often act as dynamic support and resistance. Price approaching a VWAP line from above may find support, while approaching from below may encounter resistance. - Volatility Assessment:
- Bands around the VWAP lines can signal areas of potential reversal. Upper bands may indicate overbought conditions, while lower bands may indicate oversold conditions. - Multiple Timeframe Analysis:
- The ability to display VWAPs from different timeframes simultaneously allows for the identification of confluence zones, where multiple VWAP levels align, indicating potentially significant support or resistance levels. - Customization:
- The indicator settings are customizable, allowing users to choose which VWAP lines, bands, and close lines to display, along with adjustments for visual preferences like line thickness and colors.
### Practical Application
- Intraday Trading: Traders can use the VWAPs and bands to identify potential entry and exit points during the trading day based on price interactions with these levels.
- Swing Trading: Monitoring VWAP lines across different timeframes can help identify key levels where price might reverse or gain momentum, aiding in decisions about holding or exiting positions.
- Long-Term Analysis: VWAP lines on higher timeframes can serve as dynamic support or resistance levels, providing context for long-term trend analysis and investment decisions.
The Panoramic VWAP indicator allows for a detailed analysis of price trends and levels across multiple timeframes, combining VWAPs, standard deviation bands, and close lines in a single, customizable tool.
Skrypt open-source
W zgodzie z duchem TradingView twórca tego skryptu udostępnił go jako open-source, aby użytkownicy mogli przejrzeć i zweryfikować jego działanie. Ukłony dla autora. Korzystanie jest bezpłatne, jednak ponowna publikacja kodu podlega naszym Zasadom serwisu.
Get access to our indicators at: huntergatherers.tech
Wyłączenie odpowiedzialności
Informacje i publikacje nie stanowią i nie powinny być traktowane jako porady finansowe, inwestycyjne, tradingowe ani jakiekolwiek inne rekomendacje dostarczane lub zatwierdzone przez TradingView. Więcej informacji znajduje się w Warunkach użytkowania.