OPEN-SOURCE SCRIPT
Zaktualizowano Price × Volume Table
It creates a table showing:
1- Daily Close × Daily Volume
2- Current Close × Current Volume
3- Close × Highest Volume (last 360 candles)
1- Daily Close × Daily Volume
2- Current Close × Current Volume
3- Close × Highest Volume (last 360 candles)
Informacje o Wersji
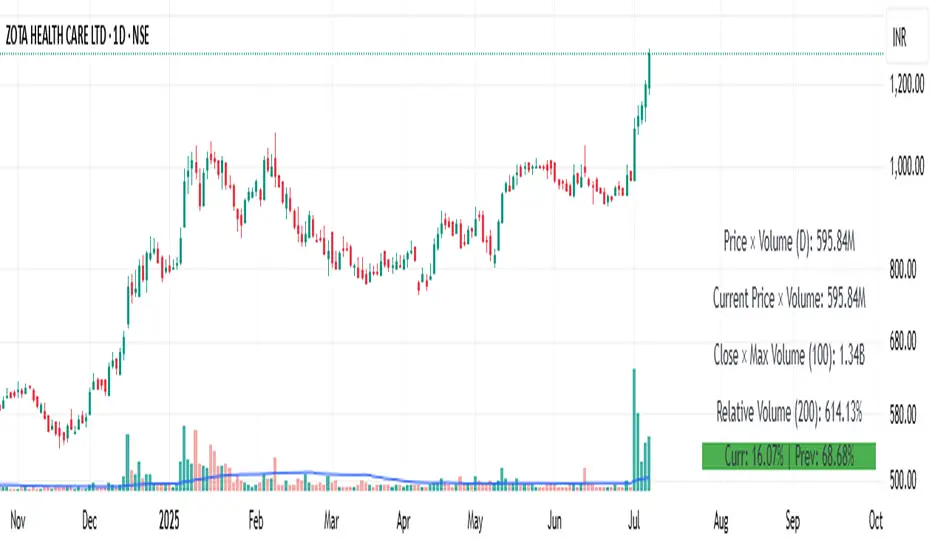
This indicator displays a real-time table showing important volume and liquidity metrics to help traders assess market activity at a glance.Included Metrics:
Price × Volume (1D): Daily closing price × volume from the selected higher timeframe (default: 1D).
Current Price × Volume: Live price × volume for the current bar.
Close × Max Volume (Lookback): Current close multiplied by the highest volume observed over a user-defined lookback period (default: 360 candles).
Relative Volume (RVOL %): Compares current volume with its moving average (default MA: 200) and shows the result as a percentage.
User Settings:
Toggle any of the 4 rows on/off
Customize the moving average length for RVOL
Choose the lookback period for highest volume
Select the timeframe for daily data
Use Case:
This tool helps traders:
Spot volume anomalies
Gauge institutional interest via RVOL
Identify high-liquidity conditions for entries/exits
Notes:
Table is positioned in the bottom-right corner
All values are auto-formatted (e.g., 1.5M, 3.2B)
Compatible with all instruments and timeframes
Informacje o Wersji
Feature Added:- 1- Current candle volume change
2- Previous candle Volume change
Skrypt open-source
W zgodzie z duchem TradingView twórca tego skryptu udostępnił go jako open-source, aby użytkownicy mogli przejrzeć i zweryfikować jego działanie. Ukłony dla autora. Korzystanie jest bezpłatne, jednak ponowna publikacja kodu podlega naszym Zasadom serwisu.
Wyłączenie odpowiedzialności
Informacje i publikacje nie stanowią i nie powinny być traktowane jako porady finansowe, inwestycyjne, tradingowe ani jakiekolwiek inne rekomendacje dostarczane lub zatwierdzone przez TradingView. Więcej informacji znajduje się w Warunkach użytkowania.