OPEN-SOURCE SCRIPT
Zaktualizowano BKSqueeze
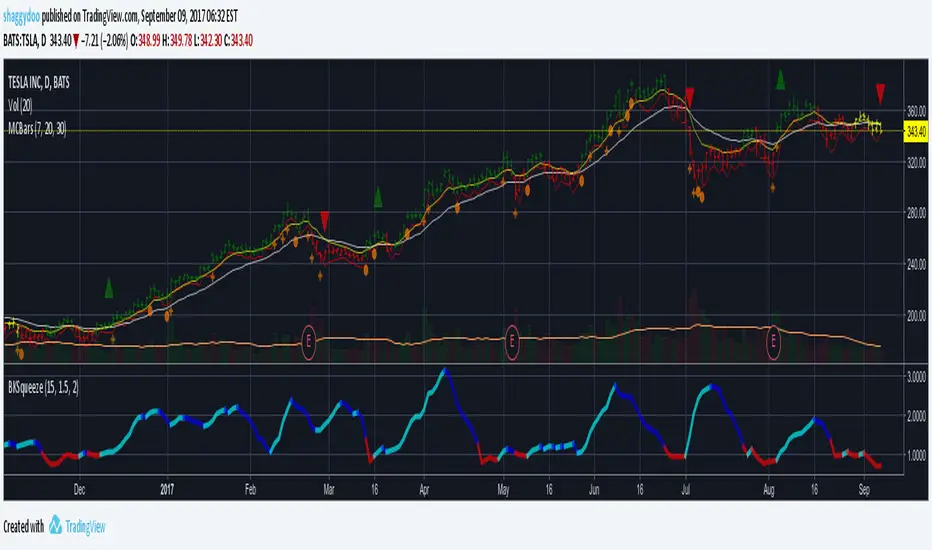
This is a price volatility compression and expansion indicator that uses the ratio of the Bollinger Band and Keltner Ratio.
Red segments indicate extreme price volatility compression that can be ideal entry points for stock/futures/forex and/or options positions.
Aqua segments indicate price volatility is expanding.
Blue segments indicate price volatility is compressing - can be used as an exit point or partial scale out point.
Note that the indicator doesn't indicate direction. One suggestion is to use the DMI indicator for this purpose - really depends on how early you enter the trade.
Suggest using a time period of 15 bars for volatile stocks, such as TSLA for example, otherwise a period of 20 bars suits most stocks/futures/forex symbols.
Informacje o Wersji
Improved in-squeeze calculation - now works for all symbols including forexInformacje o Wersji
Updated for consistencyInformacje o Wersji
Overlayed a momentum indicator for direction:Aqua bar indicates uptrend momentum is increasing.
Blue bar indicates uptrend momentum is decreasing.
Red bar indicates downtrend momentum is increasing.
Yellow bar indicates downtrend momentum is decreasing.
Also added early indication of BKRatio squeeze break out:
Orange: BKRatio in squeeze and rising - indicates potential of breakout - early indication to enter prior to breakout.
Red: BKRatio in squeeze and falling or flat - indicates still in squeeze - lower potential of breakout.
Aqua: BKRatio out of squeeze and volatility increasing - initial Aqua segment can be effective entry - depends if using stock, futures or options.
Blue: BKRatio out of squeeze and volatility decreasing - can indicate a potential exit point or scale out point.
Skrypt open-source
W duchu TradingView twórca tego skryptu udostępnił go jako open-source, aby traderzy mogli analizować i weryfikować jego funkcjonalność. Brawo dla autora! Możesz korzystać z niego za darmo, ale pamiętaj, że ponowna publikacja kodu podlega naszym Zasadom Społeczności.
Wyłączenie odpowiedzialności
Informacje i publikacje przygotowane przez TradingView lub jego użytkowników, prezentowane na tej stronie, nie stanowią rekomendacji ani porad handlowych, inwestycyjnych i finansowych i nie powinny być w ten sposób traktowane ani wykorzystywane. Więcej informacji na ten temat znajdziesz w naszym Regulaminie.