OPEN-SOURCE SCRIPT
Mean Reversion Watchlist [Z score]

Hi Traders !
What is the Z score:
The Z score measures a values variability factor from the mean, this value is denoted by z and is interpreted as the number of standard deviations from the mean.
The Z score is often applied to the normal distribution to “standardize” the values; this makes comparison of normally distributed random variables with different units possible.
This popular reversal based indicator makes an assumption that the sample distribution (in this case the sample of price values) is normal, this allows for the interpretation that values with an extremely high or low percentile or “Z” value will likely be reversal zones.
This is because in the population data (the true distribution) which is known, anomaly values are very rare, therefore if price were to take a z score factor of 3 this would mean that price lies 3 standard deviations from the mean in the positive direction and is in the ≈99% percentile of all values. We would take this as a sign of a negative reversal as it is very unlikely to observe a consecutive equal to or more extreme than this percentile or Z value.
The z score normalization equation is given by

In Pine Script the Z score can be computed very easily using the below code.
Pine Script®
The Indicator:
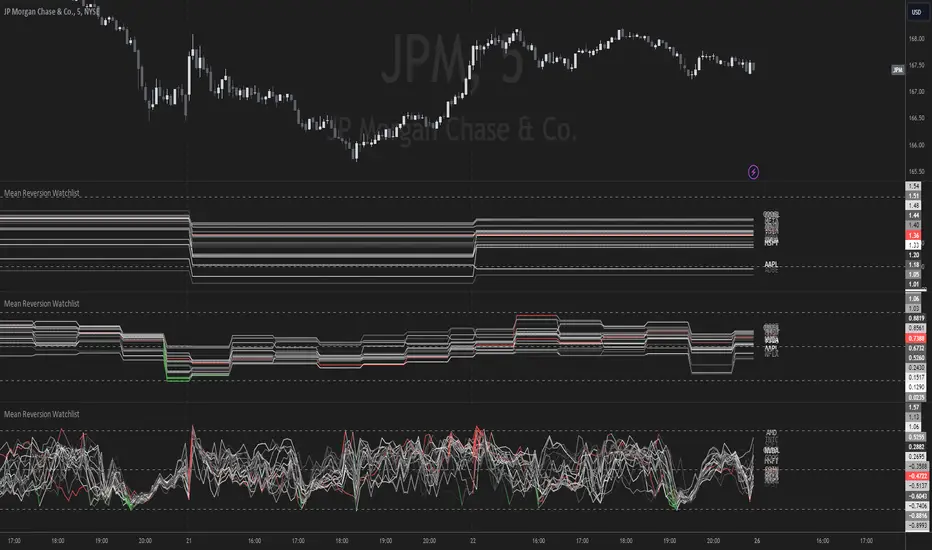
This indicator plots the Z score for up to 20 different assets (Note the maximum is 40 however the utility of 40 plots in one indicator is not much, there is a diminishing marginal return of the number of plots).
Z score threshold levels can also be specified, the interpretation is the same as stated above.
The timeframe can also be fixed, by toggling the “Time frame lock” user input under the “TIME FRAME LOCK” user input group (Note this indicator does not repaint).
What is the Z score:
The Z score measures a values variability factor from the mean, this value is denoted by z and is interpreted as the number of standard deviations from the mean.
The Z score is often applied to the normal distribution to “standardize” the values; this makes comparison of normally distributed random variables with different units possible.
This popular reversal based indicator makes an assumption that the sample distribution (in this case the sample of price values) is normal, this allows for the interpretation that values with an extremely high or low percentile or “Z” value will likely be reversal zones.
This is because in the population data (the true distribution) which is known, anomaly values are very rare, therefore if price were to take a z score factor of 3 this would mean that price lies 3 standard deviations from the mean in the positive direction and is in the ≈99% percentile of all values. We would take this as a sign of a negative reversal as it is very unlikely to observe a consecutive equal to or more extreme than this percentile or Z value.
The z score normalization equation is given by
In Pine Script the Z score can be computed very easily using the below code.
// Z score custom function
Zscore(source, lookback) =>
sma = ta.sma(source, lookback)
stdev = ta.stdev(source, lookback, true)
zscore = (source - sma) / stdev
zscore
The Indicator:
This indicator plots the Z score for up to 20 different assets (Note the maximum is 40 however the utility of 40 plots in one indicator is not much, there is a diminishing marginal return of the number of plots).
Z score threshold levels can also be specified, the interpretation is the same as stated above.
The timeframe can also be fixed, by toggling the “Time frame lock” user input under the “TIME FRAME LOCK” user input group (Note this indicator does not repaint).
Skrypt open-source
W zgodzie z duchem TradingView twórca tego skryptu udostępnił go jako open-source, aby użytkownicy mogli przejrzeć i zweryfikować jego działanie. Ukłony dla autora. Korzystanie jest bezpłatne, jednak ponowna publikacja kodu podlega naszym Zasadom serwisu.
Wyłączenie odpowiedzialności
Informacje i publikacje nie stanowią i nie powinny być traktowane jako porady finansowe, inwestycyjne, tradingowe ani jakiekolwiek inne rekomendacje dostarczane lub zatwierdzone przez TradingView. Więcej informacji znajduje się w Warunkach użytkowania.