OPEN-SOURCE SCRIPT
Shannon Entropy V2

Version 2, Shannon Entropy
This update includes both a deadband (Plotting Optional) and PercentRank Indicating.
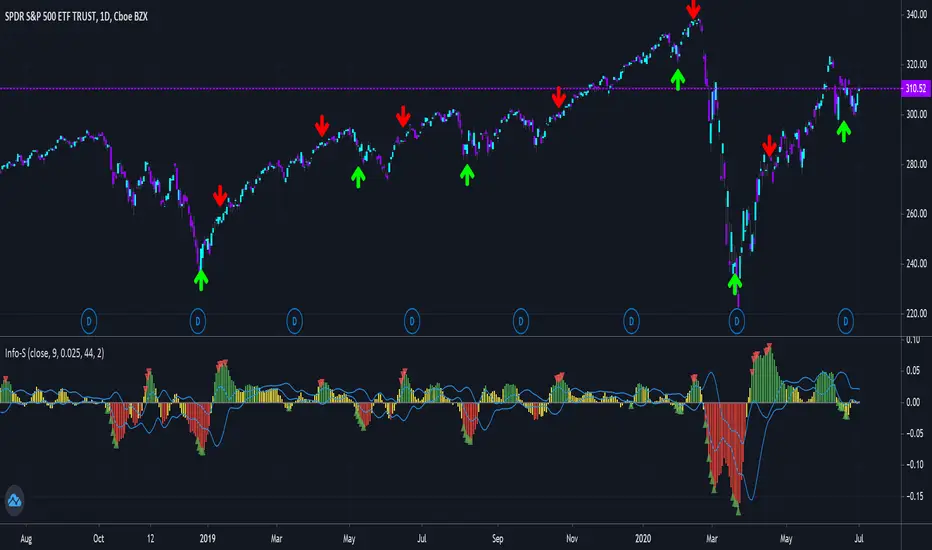
Here is a unique way of looking at your price & volume information. Utilize the calculated value of "Shannon Entropy". This is a measure of "surprise" in the data, the larger the move or deviation from the most probable value, the higher the new information gain. What I think is so interesting about this value, is the smoothness that it displays the information without using moving averages. There is a lot of meat on this bone to be incorporated in other scripts.
H = -sum(prob(i) * log_base2(prob(i)))
I've included the typical way that I've been experimenting with this, which is the difference between the volume information and price information. I've included the option to turn either price or volume data off to see the Shannon Entropy value of either value. There are a ton of complex scripts out there trying to do what this calculation is doing in 3 lines. As with anything, there are no free lunches, so you can nicely see as you lower the lengths you'll quickly learn where your nyquist frequencies are at, you'll want to work at about double the noisy value at a minimum.
Using this script is based on "Information" and it highlights places that need your attention, either because there is a large amount of change (new information) or there is minimal new information (complacency, institutional movements). Buy and Sell points are up to the user, this is just showing you where you need to provide some attention.
You can use it with or without volume data, you can also isolate either the source and volume. Below are some options for printing:

It can also with BTC (better with volume data)

Big shoutout to yatrader2 for great Shannon Entropy discussions.
And to Picte/ for his interesting inspiration STOCH-HVP-picte
This update includes both a deadband (Plotting Optional) and PercentRank Indicating.
Here is a unique way of looking at your price & volume information. Utilize the calculated value of "Shannon Entropy". This is a measure of "surprise" in the data, the larger the move or deviation from the most probable value, the higher the new information gain. What I think is so interesting about this value, is the smoothness that it displays the information without using moving averages. There is a lot of meat on this bone to be incorporated in other scripts.
H = -sum(prob(i) * log_base2(prob(i)))
I've included the typical way that I've been experimenting with this, which is the difference between the volume information and price information. I've included the option to turn either price or volume data off to see the Shannon Entropy value of either value. There are a ton of complex scripts out there trying to do what this calculation is doing in 3 lines. As with anything, there are no free lunches, so you can nicely see as you lower the lengths you'll quickly learn where your nyquist frequencies are at, you'll want to work at about double the noisy value at a minimum.
Using this script is based on "Information" and it highlights places that need your attention, either because there is a large amount of change (new information) or there is minimal new information (complacency, institutional movements). Buy and Sell points are up to the user, this is just showing you where you need to provide some attention.
You can use it with or without volume data, you can also isolate either the source and volume. Below are some options for printing:
It can also with BTC (better with volume data)
Big shoutout to yatrader2 for great Shannon Entropy discussions.
And to Picte/ for his interesting inspiration STOCH-HVP-picte
Skrypt open-source
W zgodzie z duchem TradingView twórca tego skryptu udostępnił go jako open-source, aby użytkownicy mogli przejrzeć i zweryfikować jego działanie. Ukłony dla autora. Korzystanie jest bezpłatne, jednak ponowna publikacja kodu podlega naszym Zasadom serwisu.
Wyłączenie odpowiedzialności
Informacje i publikacje nie stanowią i nie powinny być traktowane jako porady finansowe, inwestycyjne, tradingowe ani jakiekolwiek inne rekomendacje dostarczane lub zatwierdzone przez TradingView. Więcej informacji znajduje się w Warunkach użytkowania.